

When it comes to analyzing long-term trends, the 10-month moving average has been a great metric for charting long-term bull market vs. bear market changes.
The 10-month moving average has been a great metric for charting long-term bull vs. bear market changes.
Generally speaking (there are of course exceptions) when stocks break above this line, they’re in a bull market. When they break below it, they’re entering a bear market.
However, when you’re transitioning from a bull to a bear market, stocks usually follow a specific pattern in which there is a bounce to “kiss” former support as the bulls attempt to reignite the lost momentum.
It is only after the “kiss” (the bulls fail) that the real collapse begins.
Again, the pattern is:
- The initial drop
- The rally to “kiss” former support
- The REAL drop
Here’s how it played out during the last transition to a bear market (’07 to ’08).
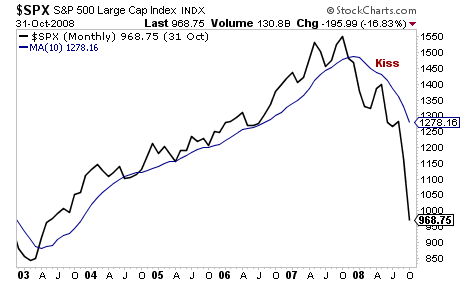
As you can see, throughout the bull market from 2003 to 2007, stocks remained above the 10-month moving average. Indeed, often this line served as key support when stocks began to lose momentum.
However, once the market peaked in 2007, it broke below the 10-month moving average with conviction. If then followed the pattern I’ve outlined, rallying to “kiss” the 10-month moving average.
And after the “kiss” came the real collapse.
Now let’s look at the current bull market begun 2009.
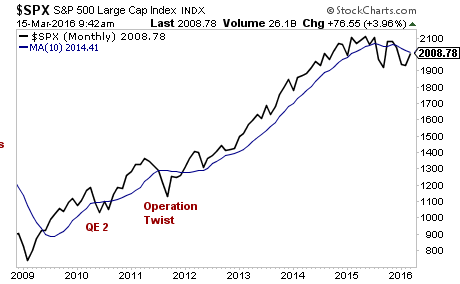
As you can see, once again the 10-month moving average has been a critical line of support for the market.
Initially, stocks struggled to remain above this line during 2010 and 2011. However, the Fed was quick to step in with major monetary policies (QE 2 and Operation Twist respectively) and stocks soon reclaimed the line
From 2012 onward, we were in a full-blown bull market with the 10-month moving average offering critical support.
Fast forward to today.
The meltdown in mid-2015 resulted in stocks taking out this line with conviction. They have since attempted to reclaim the line, but failed. We’re now moving in for another attempt (a “kiss”).
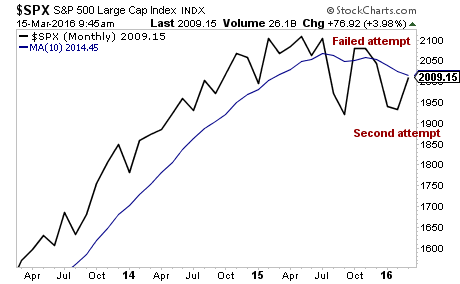
Unless stocks can reclaim this line, then we’re entering a full-scale bear market.
This is increasingly looking like the base case.
Remember, the last two times stocks fell below this line (2011 and 2012) the Fed moved to implement a major monetary policy.
This time around, the Fed is RAISING RATES.
A bear market is looming, are you prepared?
If you’re an investor who wants to protect yourself from the coming bear market, then you NEED to take out a trial subscription to our paid premium investment newsletter Private Wealth Advisory.
Private Wealth Advisory is a WEEKLY investment newsletter with an incredible track record.
To wit… in the last 16 months we’ve closed out 75 straight winning trades.
Did I say, “75 straight”winning trades”?!?
Yes, I did.
For 16 months, not only have Private Wealth Advisory subscribers locked in 75 CONSECUTIVE winners including gains of 18%, 36%, 69%, even 119%…
But throughout that ENTIRE TIME we’ve not closed a SINGLE loser.
As you can imagine, this track record is a getting a ton of attention, so we are going to be closing the doors on our current offer to explore Private Wealth Advisory at the end of this month.
So if you want to try Private Wealth Advisory for 30 days for just 98 cents, you need to get moving, because the clock is ticking and slots are quickly running out.
To lock in one of the remaining slots…
Best Regards
Graham Summers
Chief Market Strategist


