Phoenix Capital Research

These Folks Beat the S&P 500 by SIX FOLD!

Last year was a blockbuster year for stocks, with the S&P 500 rising nearly 30%.

This was the single best year for stocks since 1997. We are literally back to “the good old days” for stocks.

However, a small group of investors saw a return that absolutely dwarfed this.

Indeed, if this groups of folks positively DEMOLISHED the S&P 500 for the year, with an incredible 194% RETURN ON INVESTED CAPITAL.

That is not a typo, nor is it based on some kind of cherry picking (pumping your winners and ignoring your losers). This group of folks nearly TRIPLED their money in 2013.

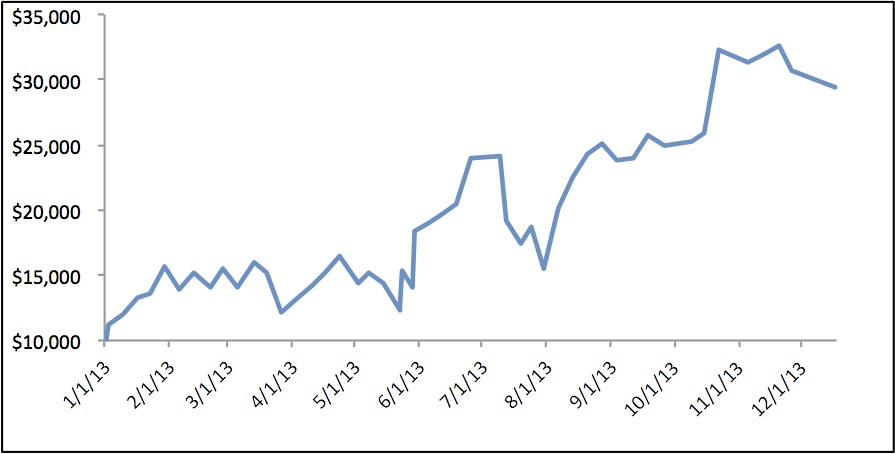
Indeed, using just $10K you could have grown your position into $29K using this ONE strategy.

See for yourself:

And here’s the crazy part… these investors did it this by making JUST ONE TRADE PER WEEK.

I know that sounds absurd. Most people believe that to make money in the markets you need to trade all the time and trade everything under the sun.

Not these folks. They made… 194% GAIN with just ONE TRADE PER WEEK.

And they didn’t trade ANYTHING ELSE.

The groups of investors I’m talking about subscribe to options trading system called OPTIONS 1-1-1.

OPTIONS 1-1-1 is a unique and insanely profitable system for trading options.

It only makes ONE TRADE… On ONE OPTION… ONCE PER WEEK.

Hence the name, OPTIONS 1-1-1.

Don’t let the simplicity fool you… most traders who make money even 51% of the time are considered geniuses…

OPTIONS 1-1-1 makes money 70% of the time.

And because we keep our losers as small as possible, we end up CRUSHING the market AND 99% of investing legends.

Indeed, in 2013, we saw a 194% gain. But we’ve seen even better years than that. In 2011 we were up over 220%!!!

Here’s how it works…

Every Tuesday morning, OPTIONS 1-1-1 sends you an email and text alert identifying your weekly trade.

We pick out the option for you, tell you what price to pay, and how long we’ll be holding the trade for.

All you have to do is enter this information into your brokerage account.

Then, when it’s time to sell, we send you another text and email telling you to sell your position and what price to sell it at.

That’s it.

We’ve made our subscribers tens of thousands of dollars with this system. And we’re inviting you to join us now… before our next trade goes out on Tuesday. There’s already a better than 70% chance it will MAKE a MAJOR profit.

OPTIONS 1-1-1

One Trade… One Option… Once Per Week = BIG PROFITS.

To sign up now…

CLICK HERE!!!

Graham Summers

Editor

Options 1-1-1


Posted by Phoenix Capital Research in It's a Bull Market

The Biggest Opportunities of 2014 Will Be…

Today is the first day for market trading in 2014.

In the very short-term, financial institutions will be repositioning their portfolios to start the year. This will likely mean more buying power in the markets.

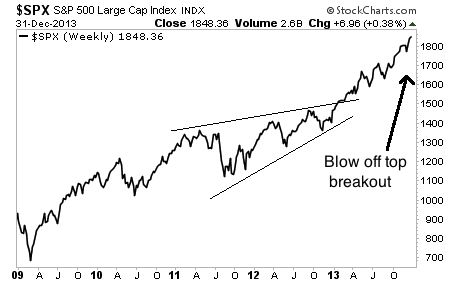
The markets have broken out of the large wedge pattern formed in 2011-2012 and are entering a blow off top.

Wall Street is decidedly bullish now. There is no telling how high this rally can go based on momentum. Manias are always more powerful than one expects. And this is nothing if not a mania (investors are buying stocks at a rate not seen since the Tech Bubble).

Investors who choose to ride this momentum should be cautious. The market is already overbought and overextended. If I were to liken it to anything it would be 1999. We all know how stocks did 1-2 years out from that.

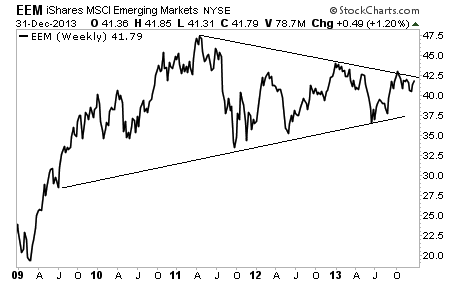
And while the US is taking off, there are other, potentially much larger opportunities outside of it. Take a look at the emerging market space. We are on the verge of breaking out of a massive triangle pattern, much like the one formed by US stocks in 2011-2012.

If we do breakout of this pattern to the upside, the move could be extreme (possibly as high as 60).

I believe the biggest opportunities for investors will be outside the US in 2014. Now is the time to look for greater diversification.

Best Regards

Graham Summers


Posted by Phoenix Capital Research in It's a Bull Market

It’s Official: Investors Are More Bullish Than in 2000!!!

Last year, 2013, will likely go down as the beginning of the end for the bull market in stocks.

Since the market bottom in 2009, stocks have rallied over 170%. It’s been an incredible run, but I fear that we’re nearing the end.

From 2009-late 2012, most of the rally was driven by mutual funds and other large institutional investors. During this period, individual or “Mom and Pop” investors were largely investing in bonds.

This changed in late 2012. At that point, individual investors joined in and stocks entered a mania. You can see it clearly in the chart above.

You can also see this in fund flows movements: from 2009-early 2013, individual investors shunned stock-based mutual funds and poured their money into bonds instead.

This changed in early 2013, as investors suddenly found an appetite for stocks again, pouring a RECORD $324 BILLION into US stock mutual funds.

To put this into perspective, this means investors put more money into stocks this year than they did in 2000: at the very peak of the TECH BUBBLE!

Which brings us to today.

Today investors are more bullish than at any point in 20 years. In fact, they are so bullish they are borrowing money (called margin debt) to BUY stocks at fastest pace in history.

Companies like Twitter, which have never made a penny in profit, are valued at tens of billions of Dollars.

In short, the market, taken as a whole, is overbought, overvalued, and overextended.

Now, this doesn’t mean that stocks cannot go higher from here. After all, market manias always tend to last long than you expect.

However, it does mean that “the good times” are ending. And the likelihood of stocks posting another massive up year is very slim indeed.

In this environment, it’s wise to lighten up on ownership to the longside. It’s even wiser to look for beaten down undervalued companies that offer you good down side protection: companies that will weather any market environment, good or bad.

Companies like ones we single out in our premium value-investing newsletter, Cigar Butts & Moats.

Cigar Butts & Moats follows the investment strategies of value investing legends Benjamin Graham and his famed student Warren Buffett.

That is to say, we look to make a fortune by buying incredible companies that are trading at fantastic prices and holding them for the long-term.

Indeed, our latest pick is already up 3% from last week.This comes on the heels of a 28% winner from August and more! All in less than six months.

If you’re looking for a long-term deep value investing newsletter, you simply cannot do better than this. Our investment analysis is second to none… which is why we have clients in over 56 countries and on four continents.

To take out a trial subscription to Cigar Butts and Moats (a $79.99 cost)…

Click Here Now!!!

Phoenix Capital Research


Posted by Phoenix Capital Research in It's a Bull Market

The REAL South American Gem Investors Should Know About

Greetings from Peru!

When most investors think about South America, they think about Brazil: the single largest South American economy.

Indeed, even the famous acronym for the most important emerging markets “BRIC” features Brazil (the “B”) as the South American representative.

But Peru is a real gem you should know about.

Peru’s economy has grown at an average pace of 7% for the last 10 years. During that time the Peruvian middle class has literally DOUBLED in size.

I can attest to seeing this in action. When I first came here in 2009, the famous Jockey Plaza mall featured mainly Peruvian brands and stores with middle priced goods.

Today, the mall has completely been designed with luxury goods (I saw Versace, Hugo Boss and the like) and beautiful architecture:

Source: Consultora Metropolis

Everywhere you turn Peruvians are hustling, building new condominiums, selling hand crafted goods, and of course, eating the famed Peruvian cuisine (I’ve already packed on 5lbs in the last two weeks alone!).

And the work ethic is tremendous.

Peruvians don’t believe in sitting around waiting for handouts or hoping the Government will pay their bills. There’s a saying in Peru “you don’t work… you don’t eat.” And they live by it.

A friend of mine recently ordered a modern glass dining room table for his 7th floor apartment. The store thought the table would fit in the elevator and so sent only two delivery men for the 100+lb table top to be delivered.

The table didn’t fit in the elevator.

Rather than rescheduling the delivery, the two guys (both of them shorter than 5’5”) hauled the table up the seven flights of stairs. The entire time they had to do so somewhat bent over to fit the table in the stairwell.

THAT’S SOME SERIOUS WORK.

I’ve come down here to scout around for investment opportunities for my Private Wealth Advisory newsletter. I’ll be detailing them in the coming weeks.

If you’re looking for actionable investment strategies on playing the markets, take a look at my monthly investment newsletter, Private Wealth Advisory.

Published on the third Wednesday of every month after the market closes, Private Wealth Advisory, shows individual investors how to beat the market with well-timed unique investments.

To whit Private Wealth Advisory is the only newsletter to have shown investors 72 straight winning trades and no losers during a 12-month period.

Indeed, in the last four months alone we’ve locked in gains of 8%, 12%, 21% and even 28%... with an average holding period of 3-4 weeks.

To find out more about Private Wealth Advisory and how it can help you beat the market with your investments…

Click Here Now!

Best Regards

Graham Summers


Posted by Phoenix Capital Research in It's a Bull Market

Graham Summers Weekly Market Forecast (Waiting On Santa)

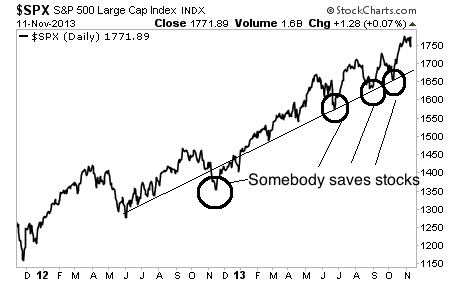
The markets are ramping higher today, with the S&P 500 having bounced of its 50-DMA in the overnight futures session.

As you can see, this has been THE line since stocks began rallying in early 2013. Any time we broke through this line, stocks rallied hard soon after.

With that in mind, it seems likely traders will try to affect a Santa Clause rally. If you’re unfamiliar with this term, the “Santa Clause Rally” refers to the fact that the markets tend to rally into the end of the year.

December is hands down the single best month for stocks: historically the Dow has rallied in December at least 70% of the time.

Moreover, the biggest push usually occurs in the last ten trading days of the year (this week and next). This is why they call it the Santa Clause rally (it happens around Christmas).

So barring any huge negative developments, the markets should rally over the next few weeks based on historical and seasonal patterns.

If you’re looking for actionable investment strategies on playing the markets, take a look at my monthly investment newsletter, Private Wealth Advisory.

Published on the third Wednesday of every month after the market closes, Private Wealth Advisory, shows individual investors how to beat the market with well-timed unique investments.

To whit Private Wealth Advisory is the only newsletter to have shown investors 72 straight winning trades and no losers during a 12-month period.

Indeed, in the last four months alone we’ve locked in gains of 8%, 12%, 21% and even 28%... with an average holding period of 3-4 weeks.

To find out more about Private Wealth Advisory and how it can help you beat the market with your investments…

Click Here Now!

Best Regards

Graham Summers


Posted by Phoenix Capital Research in It's a Bull Market

Graham Summers Weekly Market Review

The markets are in a perilous condition today.

We’ve been noting for months that the markets were displaying signs of a top. Among other items, we recently noted:

1)   Margin debt (when investors borrow money to buy stocks) has hit new all time highs.

2)   The number of bearish investors has hit an all time low.

3)   Market leaders have peaked or are peaking.

4)   Market breadth (the number of stocks that are rallying) is falling.

5)   Earnings are falling at key economic bellweathers.

6)   Stocks have diverged dramatically from earnings and revenues.

Of course, market tops always take longer than one expects. The weakness of the S&P 500 over the last few weeks isn’t too promising.

A break below this line would open the door to a more serious correction, possibly to 1,700.

The key item to note would be if the market does correct in a big way while the Fed was engaged in its $85 billion per month QE plan. We’ve never had a correction greater than 5% since the Fed announced QE 3 and QE 4. A 5% correction from the most recent peak would bring us to 1,710.

That would be the key line to watch. I’ve drawn it in the chart below.

Is the market topping? It’s too early to tell. But for certain we are in a bubble. It’s just a question of when it bursts.

If you’re looking for actionable investment strategies on playing the markets, take a look at my monthly investment newsletter, Private Wealth Advisory.

Published on the third Wednesday of every month after the market closes, Private Wealth Advisory, shows individual investors how to beat the market with well-timed unique investments.

To whit Private Wealth Advisory is the only newsletter to have shown investors 72 straight winning trades and no losers during a 12-month period.

Indeed, in the last four months alone we’ve locked in gains of 8%, 12%, 21% and even 28%... with an average holding period of 3-4 weeks.

To find out more about Private Wealth Advisory and how it can help you beat the market with your investments…

Click Here Now!

Best Regards

Graham Summers


Posted by Phoenix Capital Research in It's a Bull Market

The Secret “Buy” Signal That 99% of Investors Fail To See

Perhaps the single most misunderstood item in the financial world is the Chicago Board Of Options Volatility Index, or VIX.

The VIX is a measure of how much investors are willing to pay for portfolio “insurance.” If they’re willing to pay a lot (the VIX is high), then it’s assumed investors are nervous. If they don’t want to pay much (the VIX is low), then it’s assumed investors are calm and expecting blue skies ahead

Because of this, most investors, including the majority of professional investors, believe the VIX provides a reliable barometer of market risk.

This is not true. The reason is because investors are usually greedy when they should be fearful and vice versa. If the VIX is up, it’s not because the market is “risky” or at risk of falling… it’s because the market already FELL!

As anyone knows, the time to buy stocks is when they’re “low” as in “buy low, sell high.” But as I just explained, stocks are usually “low” when they’ve already fallen  (which would mean the VIX is already spiking). Put another way, the VIX doesn’t really measure risk per se… instead it shows you when investors are panicked… and that’s when you should consider buying

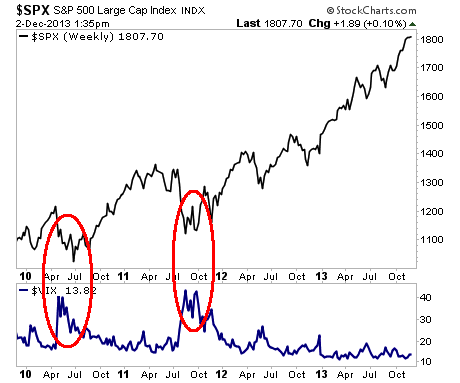
Take a look at the above chart. Everytime the VIX spiked (the blue line below), the market had already dropped and was in the process of bottoming.

Now let’s look at a longer-term chart. Once again, the VIX spiked after the market had already plunged. In fact, buying stocks around the time the VIX spiked was a GREAT way to trade the market going back for years. If you had done this, you would have profited handsomely.

If you want to make a killing in the markets, you need to be willing to see the world the way it really is, NOT how you THINK it is. Most investors think the VIX measures the market’s risk, but really, it’s almost the opposite: the VIX almost always picks market bottoms!

With my weekly premium investment newsletter Global Alpha Trader, I show investors how to play the market using this and other proprietary “risk reward” metrics I’ve developed in over 25 years on Wall Street.

During that time I’ve built up an arsenal of how to find “out of the way” investment ideas that will make you money while always minimizing your risk.

For instance, in the last month alone I’ve alerted subscribers to:

1)   An extraordinary energy asset play that corporate insiders are loading up on. If the market even begins to sniff the value here, we could easily see gains of 400%.

2)   A back-door play on China and India’s ongoing infrastructure boom that Wall Street TOTALLY misunderstands. We could easily see a double-digit winner here within six months.

3)   The single most important theme for the global economy in the year 2014. I call this “the Great Game” but for you it will result in GREAT profits. Indeed, I’ve got three investments based on this theme which could return as much as 800% in the next 24 months.

And much, much more.

An annual subscription to Global Alpha Trader costs $499.99.

Considering these are the same insights my institutional clients used to pay me six figures for when I worked on Wall Street, this is an absolute steal.

Each subscription to Global Alpha Trader comes with:

1)   52 weekly issues of Global Alpha Trader (featuring at least 20 actionable investment ideas per year)

2)   The 400% Energy Opportunity Wall Street Won’t Tell You About Special Report

3)   The Global Alpha Trader investment manual.

4)   Real time trade alerts telling you when to buy or sell an investment.

5)   EVERY Special Report I write between now and December 2014.

… And much more.

You can even keep the investment reports if you decide Global Alpha Trader is not for you and cancel during the first two months for a full refund.

How’s that for a low risk proposition?

To take out an annual subscription to Global Alpha Trader

Click Here Now!!!

Best Regards

Tom Langdon


Posted by Phoenix Capital Research in It's a Bull Market

The Market Is Entering a Blow Off Top

The markets are entering a blow off top.

For five years, by keeping interest rates near zero, the Fed has been hoping to push investors into the stock market. The hope here was that as stock prices rose, investors would feel wealthier (the “wealth effect”) and would be more inclined to start spending more, thereby jump-starting the economy.

This has not been the case.

From 2007-early 2013, individual investors fled stocks for the perceived safety (and more consistent returns) of bonds. During that time, investors have pulled over $405 billion out of stock based mutual funds.

The pace did not slow throughout this period either with investors pulling $90 billion out of stock based mutual funds in 2012: the largest withdrawal since 2008.

In contrast, over the same time period, investors put over $1.14 trillion into bond funds. They brought in $317 billion in 2012, the most since 20008.

Throughout this period, the market rose, largely due to institutional buying. Every time the market started to collapse, “someone” stepped in and propped it up. Consequently, institutional traders were not committed to a collapse, and gradually the market moved higher.

At this point the “mom and pop” crowd was, for the most part, not participating in the rally.

That all changed in early 2013. Suddenly the “crowd” began to get religion about the Fed’s monetary madness and piled into stocks. We’ve now reached truly manic proportions: thus far in 2013, investors have put $277 billion into stock mutual funds.

This is the single largest allocation of investor capital to stock based mutual funds since 2000: at the height of the Tech bubble. That year, investors put $324 billion into stocks. We might actually match that inflow this year as we still have two months left in 2013.

Indeed, investors are reaching a type of mania for stocks. They put $45.5 billion into stock based mutual funds in the first five weeks of October. If they maintain even half of that pace ($22.75 billion) for the remainder of the year, we’ll virtually tie the all-time record for stock fund inflows in a single year.

As a result of this, the market has entered a blow off top from a rising wedge pattern.  You can clearly see the mania beginning to hit in the middle of 2013.

So, we have investor sentiment showing record bullishness, investors are piling into stocks at a pace not seen since 1999-2000: at the height of the Tech Bubble, earnings are generally falling, the global economy is contracting, and the Fed is already buying $85 billion worth of assets per month.

We all know how this bubble will burst: badly. It’s just a question of when. The smart money is either selling into this rally (Fortress and Apollo Group) or sitting on cash (Buffett). They know what’s coming and are waiting.

If you are not preparing yourself for this, NOW is the time to do so.

With that in mind, I’ve already urged my Private Wealth Advisoryclients to start prepping. We’re about to open our crisis trades: the very same trades we used to see triple digit returns in 2008 when the market collapsed.

We’ve also taken care to prepare our finances and our loved ones for what’s coming, by following simple easy to follow steps concerning our savings, portfolios, and personal security via my Protect Your Family, Protect Your Savings & Protect Your Portfolio reports.

You can access all of these reports AND receive my crisis trades when they go out with a subscription to All for the the small price of $179: the annual cost of a Private Wealth Advisory subscription.

To take action to prepare for what’s coming… and start taking steps to insure that when this bubble bursts you don’t lose your shirt.

Click Here Now!

Yours in Profits,

Graham Summers


Best Regards

Phoenix Capital Research


Posted by Phoenix Capital Research in It's a Bull Market

An Energy Opportunity With 400% Upside

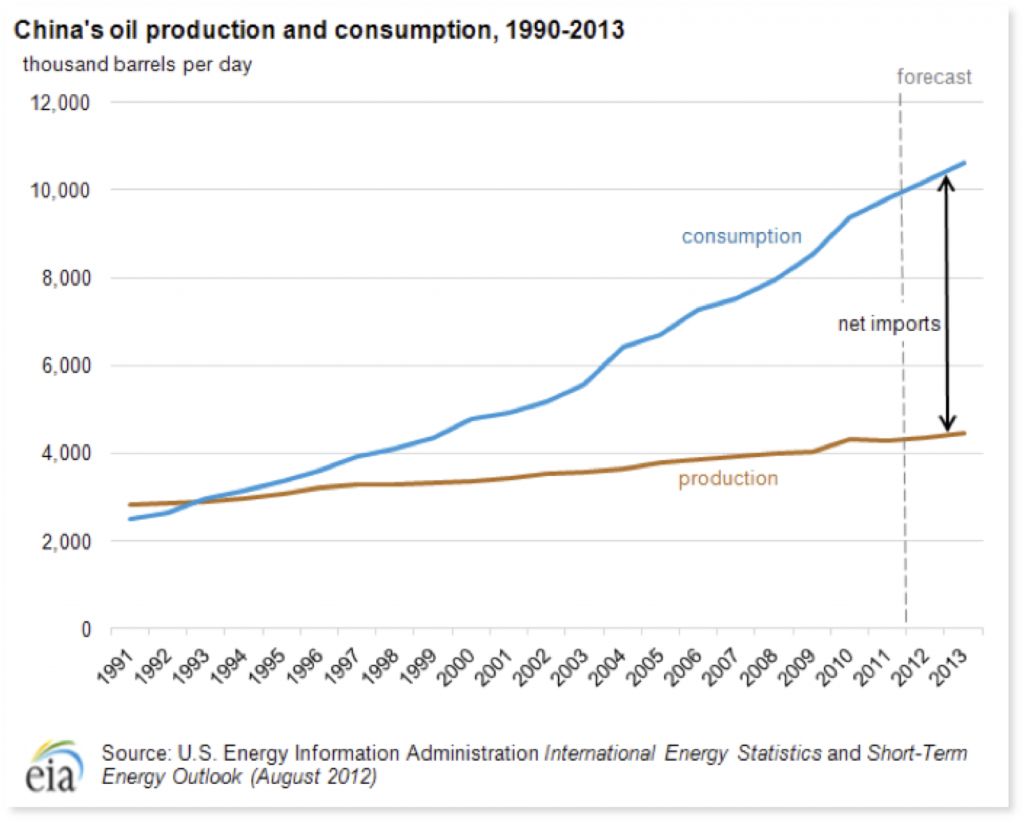
Resource pressure is a constant.  As we continue to track the nearly delusional energy “debate” in the United States about whether we will continue to burn coal and whether natural gas is a panacea, China continues to struggle with the sufficient acquisition and deployment of resources to support economic growth.

China has an environment versus growth problem.    Already China is the #1 importer of oil in the world. That‘s right.  China imports more oil than the United States.   By itself that comment is meaningless because it reflects greater US oil production, substitution by natural gas, and significant and increasing energy efficiency gains.

The United States can hold energy consumption growth below GDP growth with efficiency gains and because of the greater percentage of service relative to the economy.   China cannot.

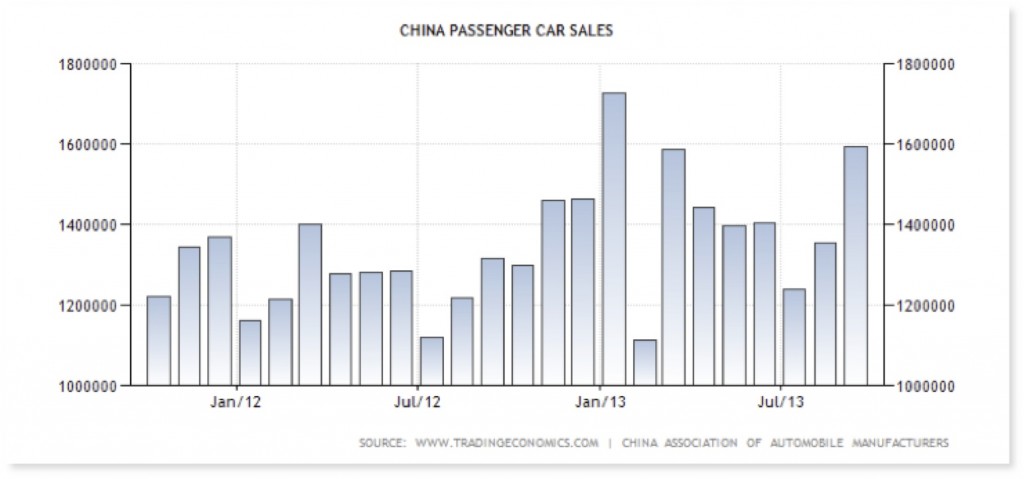
Chinese oil consumption will continue to rise.  China, however, has an emerging and growing middle class that wants to buy a car, as is typical when annual GDP per capital hits $10,000-20,000 per year.  We don’t need to see U.S. ownership rates – the population is 4X so even getting to half the ownership rate over time means twice as many cars.

Besides trail, buses, domestic aviation and trucks China is putting over 1 million cars every month onto its expanding road and highway network.

Which strains other sources of energy supply and water!

We find our best opportunities when we identify a huge gap between public perception and underlying reality.

Indeed, I recently outlined such an opportunity in the energy industry to readers of my Global Alpha Trader newsletter.

Even by conservative estimates, the upside potential for this trend is 400%. There is literally a $21 billion opportunity here. And the three specific companies I’ve outlined in a report The 400% Energy Opportunity Wall Street Won’t Tell You could all show gains between 500%-800% or even more.

This is what we do on a weekly basis with Global Alpha Trader: identify major trends that could show individual investors huge gains with minimal risk.

Every week I outline the most critical developments in the global economy, showing individual investors the opportunities where you can make BIG money and with minimal risk.

I’ve spent the better part of 30 years doing this for institutional clients, pension funds and the like. Now I’m doing it for you!

To find out what these companies are, all you need to do is take out a trial subscription to Global Alpha Trader. You’ll immediately be given access to the Global Alpha Trader subscribers only website where you can download my report: The 400% Energy Opportunity Wall Street Won’t Tell You.

You’ll also begin receive Global Alpha Trader to your inbox every Monday after the market closes.

Now, a subscription to Global Alpha Trader costs $995.

If that sounds like too much money – I can tell you right now Global Alpha Trader is not for you. This research is for serious investors who understand that high quality investment ideas come at a premium: you don’t get insights with 400+% upside cheaply.

Of course, I can tell you about how successful this service has been… but the best way to judge is to check it out for yourself.  So I propose you take the next two months to give Global Alpha Trader a look…

If you find it’s not what you’re looking for, simply drop us a line and we’ll issue a full refund.

To subscribe to Global Alpha Trader today

Click Here Now!!!

Respectfully submitted,

Tom Langdon

Editor

Global Alpha Trader


Posted by Phoenix Capital Research in It's a Bull Market

The Fed Has Learned There Is No Smooth Exit

The primary theme driving US stock markets, is that of whether the Fed will taper or not.

The mere fact that this is the single most important theme for the markets goes a long way towards explaining how busted our financial system has become. Before 2007, the talk concerned whether the Fed would change interest rates. Today we talk about whether scaling back from $85 billion in asset purchases per month represents tightening.”

At the end of the day, the fact is that the Fed can never exit its strategies. I realize there are a lot of smart people with smart explanations for why the Fed can exit, but they are missing a critical component: human nature.

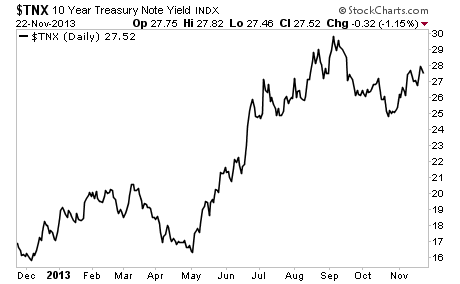
We saw this in real-time back in May 2013 when the Fed first floated the idea of tapering its QE programs. The Fed had hoped it could float this idea and let the markets get used to it, instead interest rates spiked with rates on the 10-year moving up from 1.5% to nearly 3% in a matter of weeks.

At the time, the financial media began to write articles about the market’s “taper tantrum” as though metaphorically aligning the capital markets with s spoiled brat explained the reaction.

The Fed then did a 180 despite all but promising it would taper QE. Bernanke even went so far as to negate the call for a taper in his July Q&A.

Why did he do this? It’s simple. He like the rest of the Fed saw in simple terms that there is no such thing as a smooth exit. The market rebelled at the mere hint of tapering at a time when the Fed is buying $85 billion per month. If the Fed were to actually go ahead and taper what would rates do?

Moreover, with the financial system now even more leveraged than it was going into 2007… what would happen if interest rates moved back to their historical averages of 4% on the ten year Treasury?

Ka-Boom.

So now, there is talk of the Fed tapering in December. Maybe it will, maybe it won’t. I have no idea. No one does. If we were going to try to analyze the Fed’s moves via logic or economic fundamentals, we would have tapered months if not years ago.

Instead we’ll get more of the same: talk of taper to talk the markets down, then a surprise decision to not taper so market take off again. The Fed is now managing expectations more than anything. The Fed has acted in 90+% of the months since the Crisis began. This tells us precisely what the game plan is going forward.

f you are not preparing yourself for this, NOW is the time to do so.

With that in mind, I’ve already urged my Private Wealth Advisory clients to start prepping. We’ve opened a series of targeted investments to profit from any market correction going forward.

And if the market crashes… we could see literal fortunes.

We’ve also taken care to prepare our finances and our loved ones for what’s coming, by following simple easy to follow steps concerning our savings, portfolios, and personal security via my Protect Your Family, Protect Your Savings & Protect Your Portfolio reports.

During the EU Crisis we locked in 72 straight winning trades and not one loser, including gains of 18%, 28% and more.

I believe that when the next Crash comes, we’ll see similar success.

All for the the small price of $179: the annual cost of a Private Wealth Advisory subscription.

To take action to prepare for what’s coming… and start taking steps to insure that when this bubble bursts you don’t lose your shirt.

Click Here Now!

Yours in Profits,

Graham Summers

Posted by Phoenix Capital Research in It's a Bull Market

Are We Heading For a China Spring?

The following is an excerpt from a recent issue of Private Wealth Advisory… To find out more about Private Wealth Advisory and how it can help you beat the market, Click Here Now!!!

China’s government continues to walk a very thin line. China’s GDP is largely created by funneling easy credit (total credit is now at 200% of GDP) into infrastructure projects (a record 49% of China’s GDP is in investment)… the cost of this money pumping and incessant investment is higher inflation:

In China, consumers pay nearly $1 more for a latte at Starbucks than their U.S. counterparts. A Cadillac Escalade Hybrid Base 6.0 costs $229,000 in China, compared to just over $73,000 in the U.S.

Welcome to China’s modern retail world, where the price of many goods is far higher than in many other countries, a disparity that is all the more stark considering the income differences. A basic iPad 2 is priced at $488 in China, where average per capita income is around $7,500. The same tablet is $399 in the U.S., where average per capita personal income totals $42,693.

Clothing and other apparel is on average 70% more expensive for consumers in China than in the U.S., according to data from SmithStreet, which compared the prices of 500 items of 50 brands in both countries.

http://online.wsj.com/news/articles/SB10001424127887323932604579052973988936230

However, the reality of higher inflation won’t show up in China’s inflation data (which clocks in at an absurdly low 3%). However, you can see clear signs of this in China’s civil unrest: you don’t get wage and labor strikes for nothing. Workers protest for higher wages because they cannot afford increased costs of living.

In the three months from June to August 2013, China’s Labor Board recorded a total of 183 incidents on our Strike Map, up seven percent from the previous three months, and more than double the 89 incidents recorded from June to August in 2012.* In July alone, we recorded 78 incidents, with another 67 in August…

In Guangdong, for example, police detained 14 workers from Xinrongxin Kitchen Appliance in Shunde district on 27 August after they took to the streets demanding a total of four million yuan in wage arrears…

One trend of particular note in the strike map data is the increasing number of disputes in larger enterprises, those with 100 to 1000 employees. The proportion jumped from 35 percent in the months of June, July and August 2012 to 60 percent in the same period this year. In addition we noted five strikes involving more than a thousand people. In the manufacturing hub of Dongguan, for example, more than a thousand women workers staged a strike against wage cuts on 14 June and blocked the roads outside Hop Lun, a Swedish-owned garment company.

http://www.clb.org.hk/en/content/china’s-workers-turn-heat-summer-protest

Thus we are in a world in which Chinese officials must manage expectations, trying to convince investors that they won’t let inflation get out of control… but won’t crash the financial system either.

China’s central bank added fuel to fears on Thursday it was clamping down on inflation risks as it allowed cash to drain from the financial system for a second straight week, sparking a jump in short-term rates.

The move by the People’s Bank of China (PBOC) happened as Beijing stepped up its efforts to counter surging property prices in the capital in an attempt to calm rising discontent over the city’s record-high home prices.

China also widened the funding options for local governments and property companies by giving them access to the interbank bond market to finance affordable housing, a priority of Chinese leaders, sources told IFR, a Thomson Reuters publication.

Housing data this week has raised fresh concerns about property bubbles in some major cities, which could add to consumer inflation – already at a seven-month high – and add to criticism that home prices are increasingly out of reach of ordinary Chinese.

http://www.reuters.com/article/2013/10/24/us-china-economy-idUSBRE99N07P20131024

I was bearish on China before, but they appear to have successfully navigated their “liquidity crisis” from earlier this year. But inflation is becoming a real problem there. The key issue will whether it erupts into a “China Spring” similar to the Arab Spring or if it simply will fuel asset bubbles.

Mark this as a major theme for 2014.

Best Regards

Graham Summers


Posted by Phoenix Capital Research in It's a Bull Market

When the US Wobbles On Iran, These Companies Suffer

The Times of Israel recently reported that Saudi Arabia and Israel are coordinating attack planning against Iran should the West (meaning the U.S.) back down and allow for unacceptable development of Iranian nuclear capability.  This situation will have major implications for investors.

Here is our assessment.

Iran will NOT attack Israel because:

  • The IRGC (Revolutionary Guard) controls the economy and has the weapons; the religious leaders do not.
  • A missile leaving Iran has to cross over at least two countries to hit Israel (see the map below).
  • In terms of an attack from the sea, Iran has 3 old Kilo (Russian) subs that would have to transit through a 25-mile choke point into the Red Sea and still have to fire over Egypt (again see the map below).

Iran doesn’t want war. What Iran really wants is a stronger negotiating position for rapprochement with the U.S. and influence in the Middle East.  

Brinksmanship is the order of the day – which means there is always risk of miscalculation. Iran is a rational  (not nice, I said rational) actor and needs an accommodation with the West from an economic perspective:  Iran’s economy is archaic and resource driven.

But pride matters and nations act like five year olds on the world stage.  Iran wants the bomb because it makes them feel big and relevant.  They also compete with Turkey (historically the Ottoman Empire ruled the Middle East) and their own history as a major empire (Persia!) whereas Saudi Arabia is the upstart with money.   By all means – throw in Shia versus Sunni, Arab versus Persian, and family/clan dynamics but, in the end, Iran’s future will be directed by the quest for money and influence, not carnage.

We don’t see an Israeli/Saudi alliance launching an attack.  The House of Al-Saud does not want a shooting war.  The Saudi population is hardly enamored with the ruling family and actually shooting at another Muslim country, even Shia, will not go down well either domestically or in the region.

Israel has lost trust in the U.S. as an ally for at least the next two years and probably longer given an increasingly isolationist bent on both sides of the aisle in the U.S’s congress.  In terms of acting alone, it’s unlike Israel would want to take a potshot against Iran, which has 10X the population and 4X the economy.

Finally, no matter the political posturing, the US is the primary military and geopolitical ally to Saudi Arabia and Israel. And the U.S. does not favor action. At the end of the day, we do provide the supply chain and fulfillment to Saudi Arabia, cash to Israel and intelligence support to both.

With this in mind, it is our view that war with Iran is unlikely. And there will be significant investment implications due to this.

U.S. defense contractors will likely get hurt.

The U.S. is “going wobbly” with consequences.  The fact that Saudi Arabia and Israel are working together is a positive potential silver lining (hey, Saudi Arabia is actually thinking about letting women drive, how progressive!!!!) but U.S. defense firms will probably pay a steep price in terms of future orders for weapons and goods from the region.

The United States represents about half of total global defense spending and in turn is in a tie with Russia for being the largest exporter of defense products and services.  Totals vary by year but roughly speaking Russia is about equal to the US, China is about 25% but growing and France and Germany are both about 10-15%.

The two biggest buyers of defense offerings are Saudi Arabia, particularly the last two years, and India.  The U.S. benefitted handsomely from the success of their weapons and systems over the years. The fact that Saudi Arabia is beginning to realize that the US is unlikely to be overly supportive of military action against Iran suggest that Saudi Arabia may start shopping elsewhere.

Saudi Arabia has the largest wallet here. Their thinking is likely the following:

  • Supply chain – can I get parts and support and to whom am I locked in contractually?
  • Needs – do I need top shelf weapons and defense items or is an older generation aircraft adequate?
  • Supporting allies – Dassault (France) makes good aircraft too, should we shop there instead?
  • Sending a message to the US – see prior comment?

Unfortunately these recent developments suggest significant incremental headwinds for U.S. defense companies like Lockheed Martin (LMT), Northrop Grumman (NOC), Raytheon (RTN), L3 Systems (LLL) and others.

These companies are already under siege in the U.S. given that “international growth” could dry up quickly.  Do not forget Boeing (BA), which is about 40% defense over time and, additionally, must compete for commercial orders with EADS, which makes aircraft that are just as good.

Bad politics can be very bad for business. And a wobbly U.S. in the Middle East will hurt profits at US defense contractors.

Respectfully submitted,

Tom Langdon


Posted by Phoenix Capital Research in It's a Bull Market

The QE Experiment is Failing… Will Stocks Crash?

We’ve long maintained that Japan is ground zero for the “QE works vs QE doesn’t work” debate.

The Fed’s economic models, and 99% of the economic models employed by Central Banks in general, believe that monetary easing can bring about an economic recovery. The primary argument for this crowd if QE has thus far failed to produce a recovery is that the QE efforts have not been big enough.

And then there’s Japan. In a nation with GDP of $5.96 trillion, the Bank of Japan has launched a $1.4 trillion QE effort: a monetary move equal to 23% of Japan’s GDP.

To put this into perspective, this would be akin to the US’s Federal Reserve announcing a QE effort of over $3 trillion.

Suffice to say, Japan’s QE most certainly should be considered “enough” by even the most pro-QE supporter. But the very problem is that it does not appear to be having the intended effects.

The following is an article from the Wall Street Journal. I’ve highlighted a few choice items for your review:

At Koeido Co., a 156-year-old sweets maker based in this city in southwest Japan, chairman Shuichi Takeda says he feels the country may finally be coming out of a 20-year funk.

Sales of Koeido’s sweet millet dumplings are holding up. The company is spending around 80 million yen ($800,000) to renovate two shops—a sign of how Japan’s economy is showing signs of life, lifted in part by a flood of easy money from the central bank that has boosted stocks and helped spur growth.

But with future demand unclear, and costs for imported sugar rising, Koeido still isn’t bullish enough to take out bigger loans to replace equipment or expand its business—even though banks are begging it to borrow more.

The economy doesn’t necessarily get better just because of monetary easing,” says Mr. Takeda. “And you don’t borrow just because rates are low.”…

It is an attempt to literally crowd banks and other investors out of the market and force them to put their money to work in other ways—through loans or investments in real estate, for example—to help stimulate the economy…

“The idea that the Bank of Japan will buy bonds, and then the extra money will start flooding into corporate or retail loans—that’s just a theoretical exercise,’‘ says Chugoku’s Mr. Miyanaga. “Most important is [for the government] to hurry up and produce a concrete growth strategy, which will spur private economic activity.”

http://online.wsj.com/news/articles/SB10001424052702304470504579163094082999108

I want to point out that the individuals who are expressing basic common sense views about monetary policy and the economy are businesspeople who run actual businesses, NOT academics.

This is what happens when academic monetary theory meets reality: theory proves to be just that theory.

There are some perceived benefits (the markets rally) from the easy money high. But the inevitable hangover is usually intense (see 2000-2001 and 2007-2008).

So stocks rally for now. But eventually this will end. In fact it may come sooner rather than later.

Remember 2008? Everyone said everything was just fine… right up until the Crash hit.

We’re seeing the same warnings in the markets now.

If you are not preparing yourself for this, NOW is the time to do so.

With that in mind, I’ve already urged my Private Wealth Advisory clients to start prepping. We’ve opened a series of targeted investments to profit from any market correction going forward.

And if the market crashes… we could see literal fortunes.

We’ve also taken care to prepare our finances and our loved ones for what’s coming, by following simple easy to follow steps concerning our savings, portfolios, and personal security via my Protect Your Family, Protect Your Savings & Protect Your Portfolio reports.

During the EU Crisis we locked in 72 straight winning trades and not one loser, including gains of 18%, 28% and more.

I believe that when the next Crash comes, we’ll see similar success.

All for the the small price of $179: the annual cost of a Private Wealth Advisory subscription.

To take action to prepare for what’s coming… and start taking steps to insure that when this bubble bursts you don’t lose your shirt.

Click Here Now!

Yours in Profits,

Graham Summers

Posted by Phoenix Capital Research in It's a Bull Market

The China Crisis You Haven’t Heard About

There are two “clear cut” roads to long-term economic disaster.

1)   Spending too much relative to GDP (see European social welfare states).

2)   Reproducing too little.

Today we’re focusing on #2.

Analyzing demographics can lay the groundwork for future investment success in a big way. Population growth plus productivity improvement are what drive long-term changes in GDP. Long-term changes in GDP drive investment success (or failures).

Unfortunately for investors, demographically much of the developed world is in trouble. Japan, Europe and even the United States have seen declining fertility rates in recent decades. Today, all three regions are well below the 2.05 children per woman needed to sustain, let alone grow population.

This same issue affects the developing world too. And China is the clear leader for a potential demographic crisis in the coming years.

Today China produces only 1.6 children per woman across the board. If you want to focus on the wealthier segments of the Chinese population, using Hong Kong as a proxy, the numbers are even worse.

It is not coincidence that the country China intends to further loosen its “one child” policy and is also considering the closing of labor camps.  Both are welcome developments even if the latter may not be a “done deal.” And both are designed to help boost China’s population.

China needs to produce, on average, 2.05 children per woman to maintain its population and support its ageing citizens. Anything lower then this means a slowdown economically in the future (no matter how much China improves productivity).

This issue also comes with geopolitical consequences.

China is surrounded by large regional competitors with much higher fertility rates (India, Pakistan, etc.). China has had conflict with one in the past (India). The other (Pakistan) is currently an economic and military ally of China owing to proximity and a common rival (India). But Pakistan’s government is hardly in control of its population which is growing rapidly.

Throw Indonesia (also growing rapidly) into the mix and there are going to be a LOT MORE people competing for limited resources in and around China.

China must turn its fertility rate around soon.  An ageing population shifts the ratio of worker to retiree and pushes social costs upward.   China’s GDP per capita is only 15% of the U.S., which means the burden per worker is much worse than in the Unites States (each worker in China must provide for a much larger number of aging retirees as opposed to their counterparts in the US).

Productivity can boost an economy, but in the end you need new people and a new child today takes at least 20 years to become a productive worker and form a new household.

What does this mean for investors?

Two things:

1)   In the near-term, China will engage in capital investment (the substitution of capital, technology and information for labor) to drive economic growth. This means the Chinese Government throwing money at the manufacturing, information technology and healthcare sectors in its economy.

2)   Long-term, China will face geopolitical challenges from its neighbors most of whom are experiencing rapid population growth. Simply put there will be a lot more people competing for a very limited number of resources (China already imports much of its agriculture and natural resources).

Respectfully submitted,

Tom Langdon


Posted by Phoenix Capital Research in It's a Bull Market

The Single Biggest Reason Most Investors LOSE Money

It’s almost never openly admitted in public, but the reality is that few if any investors actually beat the market in the long-term.

The reason for this is that most of the investment strategies employed by investors (professional or amateur) simply do not make money.

I know this runs counter to the claims of the entire financial services industry. But it is factually correct.

In 2012, the S&P 500 roared up 16% including dividends. During that period, less than 40% of fund managers beat the market. Most investors could have simply invested in an index fund, paid less in fees, and done better.

If you spread out performance over the last two years (2011 and 2012) the results are even worsen with only 10% of funds beating the market.

If we stretch back even further, the results are even more dismal. For the ten years ended 1Q 2013, a mere 0.4% of mutual funds have beaten the market.

0.4%, as in less than half of one percent of funds.

These are investment “professionals,” folks whose jobs depend on producing gains, who cannot beat the market for any significant period.

The reason this fact is not better known is because the mutual fund industry usually closes its losing funds or merges them with other, better performing funds.

As a result, the mutual fund industry in general experiences a tremendous survivor bias. But the cold hard fact what I told you earlier: less than half of one percent of fund managers outperform the market over a ten-year period.

So how does one beat the market?

Cigar Butts and Moats.

“Cigar butts” was a term used by the father of value investing, Benjamin Graham, to describe investing in companies that trade at significant discounts to their underlying values. Graham likened these companies to old, used cigar butts that had been discarded, but which had just one more puff left in them.

Like discarded cigar butts, these investments were essentially “free”: investors had discarded them based on the perception that they had no value.

However, many of these cigar butts do in fact have on last puff in them. And for a shrewd investor like Benjamin Graham, that last puff was the profit potential obtained by acquiring these companies at prices below their intrinsic value (below the value of the companies assets plus cash, minus its liabilities).

Graham used a lot of diversification, investing in hundreds of “cigar butts” to produce average annual gains of 20%, far outpacing the S&P 500’s 12.2% per year over the same time period.

So when I say that you can amass a fortune by investing in Cigar Butts, I’m not being facetious. For this reason, cigar butts, or deeply undervalued companies, will be a focus of this newsletter. And like Benjamin Graham, we’ll only be holding these companies in the short-term: until they reach their intrinsic value.

The other term, “moats” is in reference to the investments Warren Buffett, a student of Ben Graham and arguably the greatest living investor, seeks out…

Buffett amassed his enormous fortune through a systematic investment philosophy consisting of a few key ideas. However, the single most important one was buying companies with “moats” around them meaning that they have a competitive advantage that stops competitors from breaking into their market share.

Our new newsletter Cigar Butts & Moats focuses exclusively on these two types of investments. We only invest in deeply undervalued “cigar butts” or companies with economic “moats” around them.

So far in 2013, we’ve invested in three “Cigar Butts” and three “Moats.”

As far as the “Moats” are concerned, we closed out one for a 28% gain in less than a month. Another one is up over 15%. And the third is down just 9% (which honestly has only made it that much more attractive as we believe the upside is easily 50%+).

Of our Cigar Butts, two are break even (we only opened them last week). And the other one is down 19% (due to it issuing shares, not a change in its fundamental business).

By the way, that 19% loser is now trading at over 35% below its book value and yields 12%.

This is the beauty of investing in Cigar Butts and Moats: you have such a wide margin of safety that if a company temporarily trades down, you actually end up wanting to buy MORE.

To find out what these companies are all you need to do is take out an annual subscription to Cigar Butts & Moats.

The price of an annual subscription is just $79.99.

For that price you get:

* 12 monthly issues of Cigar Butts & Moats

* All of our Special Investment Reports outlining special investment opportunities you won’t hear about anywhere else.

* Real time investment updates as needed

All of this for just $79.99

To take out an annual subscription to Cigar Butts & Moats…

Click Here Now!

Yours in Profits,

Graham Summers

Editor

Cigar Butts and Moats


Posted by Phoenix Capital Research in It's a Bull Market

The Fed Has Juiced the System in 55.5 of the Last 60 Months

The markets have been extremely quiet the last few days. With the exception of the hard selling that occurred on Thursday it’s been a snooze fest.

The reason for this is that no one wants to commit heavily to a position at the moment. We’re all well aware of the negatives the market is facing, namely declining earnings, a weakening economy, the decreasingly marginal effect of Fed intervention, etc.

However, no one wants to commit heavily to shorting the markets because they’re all too afraid that the Fed or “someone” will step in to prop up the markets should any significant drop occur.

This has happened repeatedly in the last year: every time the market began to crumble and take out support, “someone” stepped in a started buying. And soon stocks were back off to the races.

At this point we all know that the “someone” is the Fed. Numerous Fed officials have pointed to the rising stock market as a sign that Fed intervention has been “successful.”

Moreover, the Fed has barely left the markets alone since 2008.

If you go back to the first announcement of QE 1 in November 2008, there have only been two periods in which the Fed wasn’t engaging in direct monetary interventions its balance sheet between the end of QE 1 and the launch of QE 2 (June 2010-November 2010) and from the end of QE 2 until the launch of Operation Twist (June 2011-September 2011).

A total of 60 months have passed since the Fed announced QE 1. The Fed was not engaged in major monetary interventions in only six months out of these 60. Put another way, the Fed has been actively intervening to the tune of billions of dollars in 90% of ALL months since it began QE 1.

Even during the brief periods in which the Fed wasn’t officially engaging in a major monetary program, it still routinely expanded its balance sheet during options expiration week every month.

If you remove those weeks from the periods in which the Fed wasn’t officially engaging in a program, you’re left with a total of just 4.5 months in which the Fed wasn’t actively pumping the markets.

That’s 4.5 months out of 60, or less than 8%.

However, this is not to say that this Fed intervention is not creating tremendous opportunities for stock pickers. After all with the Fed juicing stocks to this degree, there is no shortage of mis-pricings in high quality companies.

Indeed, recently, subscribers of our value stock picking newsletter Cigar Butts & Moats  locked in a 28% gain on our latest stock pick in less than one month.

We did this by buying a deeply undervalued business. Based on its market valuation, this company could easily take itself private, using the cash generated from operations to pay the loan required to buyback all of its shares on the open market.

In fact, this business was so cheap that it could do this even if its earnings fell in HALF.

That’s one heck of a margin of safety. We bought on October 3 2013. And we closed out on October 23 2013 for a 28% gain.

Over the same time period, the S&P 500 rose just 4%.

This is how to make a killing in the market today: by focusing on value stock picking. It’s the very reason we launched Cigar Butts & Moats.

The price of an annual subscription to Cigar Butts & Moats is just $79.99.

For that price you get:

  • 12 monthly issues of Cigar Butts & Moats
  • Our proprietary deep value Investment Special Report How to Make a Fortune With Value Investing (a $199 value) which outlines specifically how Warren Buffett made his fortune investing in stocks.
  • All of our other Special Investment Reports outlining special investment opportunities.
  • Real time investment updates as needed (like the one that told investors to lock in a 28% gain).

All of this for just $79.99.

To take out an annual subscription to Cigar Butts & Moats…

Click Here Now!

Best Regards

Phoenix Capital Research


Posted by Phoenix Capital Research in It's a Bull Market

How We’re Finding Value In the Markets Today

The following is an excerpt from our most recent Cigar Butts & Moats newsletter.

One of the primary themes of our articles over the last few months has been the potential of a major market top forming. We now have what I can only call “numerous bells” ringing.

First and foremost, I want to alert you to a disturbing trend in stock mania. That trend pertains to money inflows to stock mutual funds.

One of the best means of gauging investor sentiment for individual investors pertains to how they move their money in and out of mutual funds.

For example, from 2007 until the end of 2012, investors pulled over $405 billion out of stock based mutual funds. Over $90 billion of this was pulled in 2012 alone: the largest withdrawal since 2008.

In contrast, over the same time period, investors put over $1.14 trillion into bond funds. They brought in $317 billion in 2012: again, this was the most since 2008.

This marks quite a reversal of asset class fund flows: before 2008, stock funds usually took in $2 for every $1 investors allocated to bond funds.

However, this trend reversed back to normal in 2013. The Fed finally succeeded in inducing investors to move into stocks again. And they have done so in a big way. Thus far in 2013, investors have put $277 billion into stock mutual funds.

This is the single largest allocation of investor capital to stock based mutual funds since 2000: at the height of the Tech bubble. That year, investors put $324 billion into stocks. We might actually match that inflow this year as we still have two months left in 2013.

Indeed, investors are reaching a type of mania for stocks. They put $45.5 billion into stock based mutual funds in the first five weeks of October. If they maintain even half of that pace ($22.75 billion) for November and December, we’ll virtually tie the all-time record for stock fund inflows in a single year.

That record, again, occurred in 2000. At that time the NASDAQ had just staged a massive bubble rally.

What followed was one of the worst market collapses of all time:

However, this is not to say that there are not tremendous opportunities for stock pickers in this environment.

Indeed, recently, subscribers of our value stock picking newsletter Cigar Butts & Moats  locked in a 28% gain on our latest stock pick in less than one month.

We did this by buying a deeply undervalued business. Based on its market valuation, this company could easily take itself private, using the cash generated from operations to pay the loan required to buyback all of its shares on the open market.

In fact, this business was so cheap that it could do this even if its earnings fell in HALF.

That’s one heck of a margin of safety. We bought on October 3 2013. And we closed out on October 23 2013 for a 28% gain.

Over the same time period, the S&P 500 rose just 4%.

This is how to make a killing in the market today: by focusing on value stock picking. It’s the very reason we launched Cigar Butts & Moats.

The price of an annual subscription to Cigar Butts & Moats is just $79.99.

For that price you get:

  • 12 monthly issues of Cigar Butts & Moats
  • Our proprietary deep value Investment Special Report How to Make a Fortune With Value Investing (a $199 value) which outlines specifically how Warren Buffett made his fortune investing in stocks.
  • All of our other Special Investment Reports outlining special investment opportunities.
  • Real time investment updates as needed (like the one that told investors to lock in a 28% gain).

All of this for just $79.99.

To take out an annual subscription to Cigar Butts & Moats…

Click Here Now!

Best Regards

Phoenix Capital Research


Posted by Phoenix Capital Research in It's a Bull Market

The Definitive Proof That QE is Not Effective At Creating Jobs

For over four years now, the mainstream media continues to parrot the Federal Reserve’s assertion that QE is in fact a monetary tool that will create jobs.

This assertion overlooks Japan, where QE efforts equal to over 25% of GDP have failed to improve the unemployment situation significantly, as well as the UK where QE efforts equal to over 20% of GDP have proven similarly ineffective.

We now can definitively add the US to the list of QE failures.

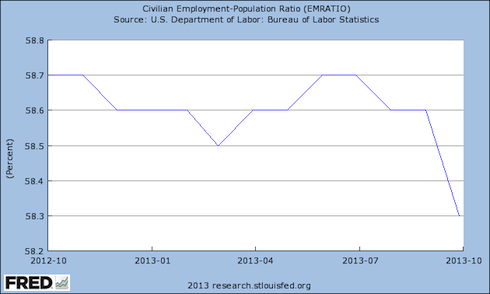
It’s been 14 months since the Fed announced QE 3 and nearly 12 months since it announced QE 4: both open ended programs that have run continuously since they were announced.

And yet through this period the employment population ratio (which measures the percentage of working age adults who are in fact employed) has in fact FALLEN.

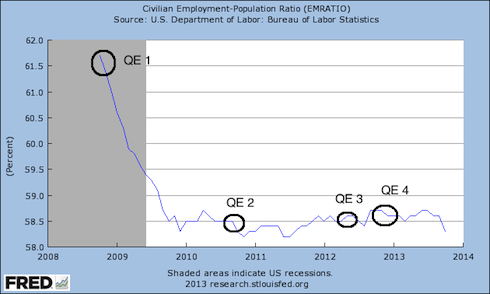
The above graph shows in clear terms that the US is not creating jobs at a rate that can account for population growth. QE 3 and QE 4 have failed to have any significant effect. In fact, if you consider that the chart has dropped dramatically in the last quarter (giving QE 3 and QE 4 a year to have an effect) one can definitively say that QE has been a total failure as far as jobs growth is concerned.

This is nothing new. If you look at the five-year chart you cannot with a straight face say QE has succeeded in any meaningful way.

QE does not create jobs. It has been a total failure. And yet, five years after the Fed embarked on this policy we continue to hear people talk about how the real problem is that we need MORE QE.

QE failed for Japan. It has failed for the UK. It ha failed for the US. Collectively, countries comprising over a third of the world’s GDP have proven QE doesn’t work.

However, this is not to say that there are not tremendous opportunities for stock pickers in this environment.

Indeed, recently, subscribers of our value stock picking newsletter Cigar Butts & Moats  locked in a 28% gain on our latest stock pick in less than one month.

We did this by buying a deeply undervalued business. Based on its market valuation, this company could easily take itself private, using the cash generated from operations to pay the loan required to buyback all of its shares on the open market.

In fact, this business was so cheap that it could do this even if its earnings fell in HALF.

That’s one heck of a margin of safety. We bought on October 3 2013. And we closed out on October 23 2013 for a 28% gain.

Over the same time period, the S&P 500 rose just 4%.

This is how to make a killing in the market today: by focusing on value stock picking. It’s the very reason we launched Cigar Butts & Moats.

The price of an annual subscription to Cigar Butts & Moats is just $79.99.

For that price you get:

  • 12 monthly issues of Cigar Butts & Moats
  • Our proprietary deep value Investment Special Report How to Make a Fortune With Value Investing (a $199 value) which outlines specifically how Warren Buffett made his fortune investing in stocks.
  • All of our other Special Investment Reports outlining special investment opportunities.
  • Real time investment updates as needed (like the one that told investors to lock in a 28% gain).

All of this for just $79.99.

To take out an annual subscription to Cigar Butts & Moats…

Click Here Now!

Best Regards

Phoenix Capital Research


Posted by Phoenix Capital Research in It's a Bull Market

What Japan’s Game Plan Means For Investors Going Forward

Editor’s Note: Tom Langdon (a pseudonym) is a former intelligence officer and Wall Street trader with over 25 years of experience advising institutional clients, government officials and business executives. Previously selected by the Wall Street Journal for its “Best of the Street” stock pickers and singled out multiple times by the Institutional Investor All America Research Team, Tom has a lengthy track record of making major calls and showing investors (both institutional and private) how to outperform the markets with minimal risk.

Governments are on a short leash – globally.

Five plus years after the Great Recession few populations are satisfied with their governments and new parties and movements continue to emerge, whether the Tea Party (US), AfD (Germany), Aam Aadmi Party (India), and unfortunately violent groups like Golden Dawn (Greece).

We see major issues in most political arenas primarily as a result of the political instability. Whether we consider the US, the EU, India, or China, all major regimes are finding themselves more accountable to populations that are growing increasingly dissatisfied with the status quo.

Japan is the exception

Prime Minister Shinzo Abe actually has a mandate and a game plan. The world can squabble about this plan, but at the end of the day, everybody else has used their paper currency as a weapon, or tried to, and Japan is taking its turn.

For investors, the question is whether you think the move in the Yen and the Nikkei is sustainable.  Our answer is unequivocally yes.  Prime Minister Abe learned some lessons from his first run as PM – which ended after one year in 2007 – and is riding high in popularity at 60% – an almost unheard of level for a Japanese politician.

Challenges will come – he will likely seek to leverage control of both houses of Japanese Parliament into reforms in labor, agriculture, healthcare and women in the workplace – all sorely needed in a country with a low birth rate and no desire to assimilate immigrants.

We like to swim downstream.  Investors do well when nations put sound long-term economic policies in place, and likewise profitable trades can be realized when governments or ministries make moves that can help the short term.

Japan’s export industries managed to survive a currency that appreciated by 30% over a decade while others depreciated – which means their cost structures are lean as hell – and you can expect them to compete more effectively with the currency wind going the other way.

Indeed, a Japanese process control manufacturer, which we track closely because of our management access and information quality, recently reported a 20% sales increase, largely because of currency.

Because nearly all its cost structure is denominated in Yen, the cost of goods sold and SG&A only rose 15-16% and allowed operating profit to increase by over 80%!  Needless to say, no Western industrial executive we speak to had a similar result to report.  That sort of thing makes Japanese stocks rise and boosting the savings and happiness of Japanese investors/voters.

Abe-nomics is not without its problems, but it is greatly boosting corporate profits in Japan. This remains a dominant theme for us going forward as we look for investment opportunities.

Sincerely,

Tom Langdon


Posted by Phoenix Capital Research in It's a Bull Market

How to Stockpick in an Overvalued Market

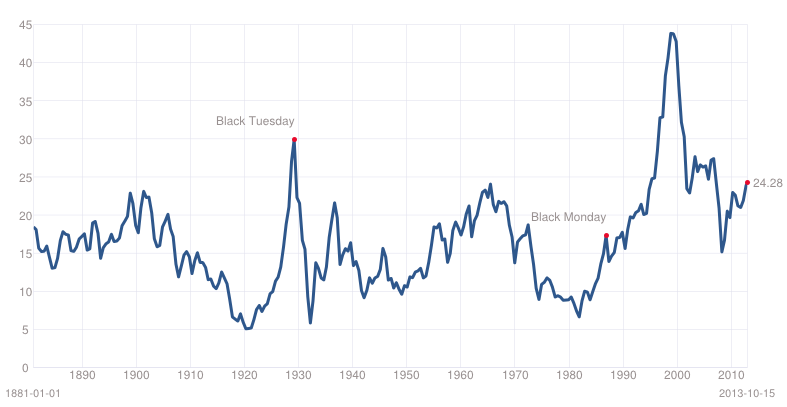
The market is overpriced, to be sure. I’m gauging this on the single most important valuation metric in finance: the cyclically adjusted price-to-earnings ratio or CAPE ratio.

Generally speaking, most investors price a company based on its current Price to Earnings or P/E ratio. Essentially what you’re doing is comparing the price of the company today to its ability to produce earnings (cash).

However, corporate earnings are heavily influenced by the business cycle.

Typically the US experiences a boom and bust once every ten years or so. As such, companies will naturally have higher P/E’s at some points and lower P/E’s at other. This is based solely on the business cycle and nothing else.

CAPE adjusts for this by measuring the price of stocks against the average of ten years’ worth of earnings, adjusted for inflation. By doing this, it presents you with a clearer, more objective picture of a company’s ability to produce cash in any economic environment.

I mentioned before that CAPE is the single most important metric for long-term investors. I wasn’t saying that for impact.

Based on a study completed Vanguard, CAPE was the single best metric for measuring future stock returns. Indeed, CAPE outperformed

  1. P/E ratios
  2. Government Debt/ GDP
  3. Dividend yield
  4. The Fed Model,

…and many other metrics used by investors to predict market value.

So what is CAPE telling us today?

Today the S&P 500 has a CAPE of over 24.  This means the market as a whole is trading at 24 times its average earnings of the last ten years.

Put another way, if you bought the entire stock market today, it would take you roughly 24 years to make your money back.

That’s expensive. Indeed, the market has only been this expensive a handful of times in the last 100+ years. Every time we’ve been closer to a market top than a new bull market run.

However, this is not to say that there are not tremendous opportunities for stock pickers in this environment.

Indeed, recently, subscribers of our value stock picking newsletter Cigar Butts & Moats  locked in a 28% gain on our latest stock pick in less than one month.

We did this by buying a deeply undervalued business. Based on its market valuation, this company could easily take itself private, using the cash generated from operations to pay the loan required to buyback all of its shares on the open market.

In fact, this business was so cheap that it could do this even if its earnings fell in HALF.

That’s one heck of a margin of safety. We bought on October 3 2013. And we closed out on October 23 2013 for a 28% gain.

Over the same time period, the S&P 500 rose just 4%.

This is how to make a killing in the market today: by focusing on value stock picking. It’s the very reason we launched Cigar Butts & Moats.

The price of an annual subscription to Cigar Butts & Moats is just $79.99.

For that price you get:

  • 12 monthly issues of Cigar Butts & Moats
  • Our proprietary deep value Investment Special Report How to Make a Fortune With Value Investing (a $199 value) which outlines specifically how Warren Buffett made his fortune investing in stocks.
  • All of our other Special Investment Reports outlining special investment opportunities.
  • Real time investment updates as needed (like the one that told investors to lock in a 28% gain).

All of this for just $79.99.

To take out an annual subscription to Cigar Butts & Moats…

Click Here Now!

Best Regards

Phoenix Capital Research


Posted by Phoenix Capital Research in It's a Bull Market