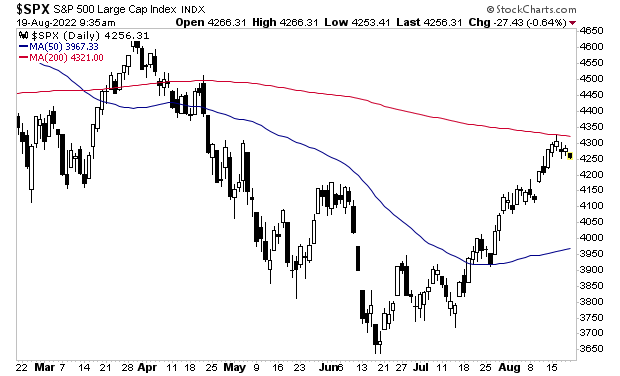
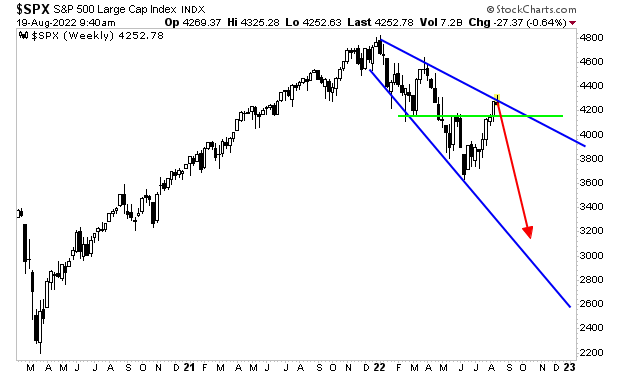
Judging from last
week, the bear market rally ended right at the 200-day moving average (DMA) for
the S&P 500.
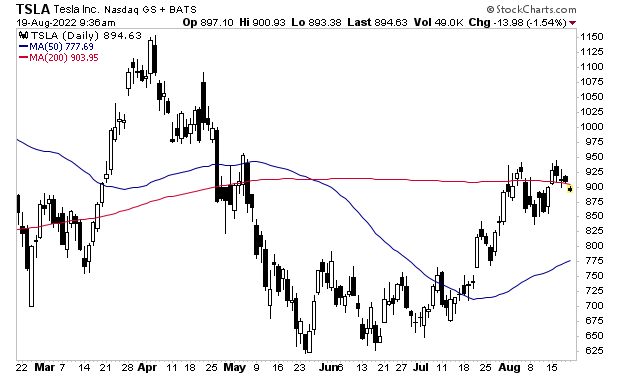
This was right
where market leaders such as Tesla (TSLA) had suggested we’d see a top. Indeed,
one of the first signs that the market would be topping out was the fact TSLA
struggled to remain above its 200-DMA once it initially broke above that line
in mid-July.
So where do we go
from here?
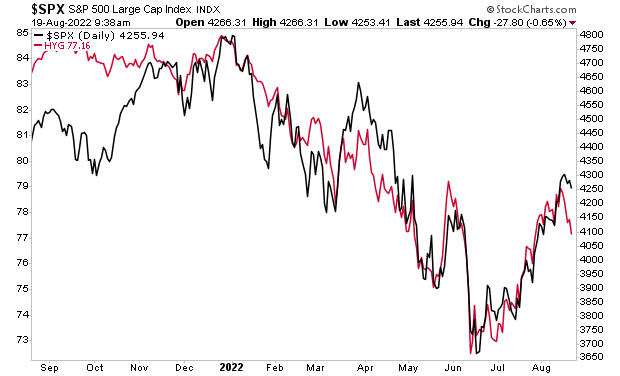
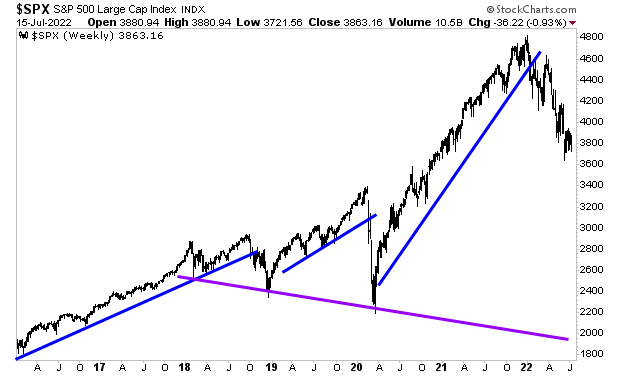
High yield credit,
which leads stocks, suggests the S&P 500 is going to 4,100 in the near-term.
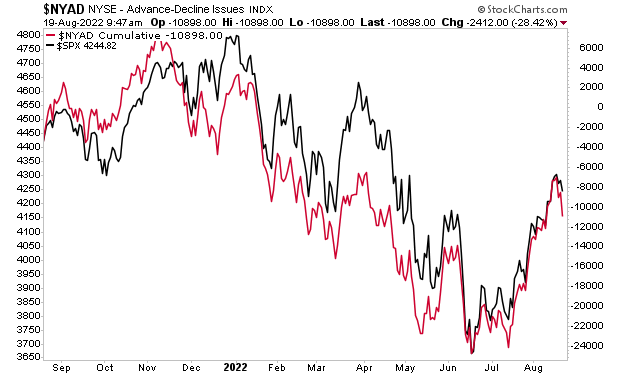
It’s a similar story
for breadth, which also leads stocks.
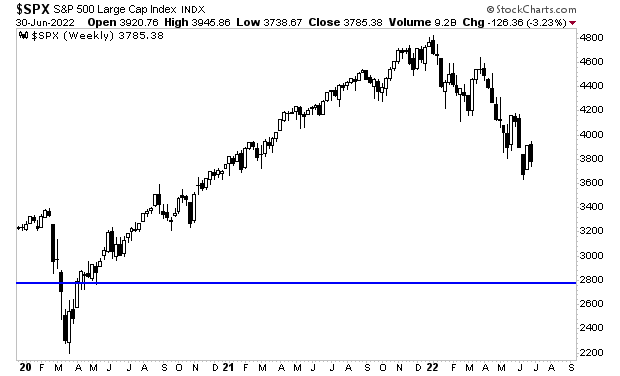
However, if the
S&P 500 cannot maintain support (green line in the chart below) around
4,100, things could get UGLY fast.
For those looking to prepare and profit from this
mess, our Stock Market Crash Survival Guide can
show you how.
We are making just 100 copies available to the general
public.
Yesterday we put
this recent stock market rally in the context of historical bear market
rallies.
By quick way of
review.
It is
extremely common for stocks to rally, and sometimes by quite a lot and for as
long as two months, during a secular bear market.
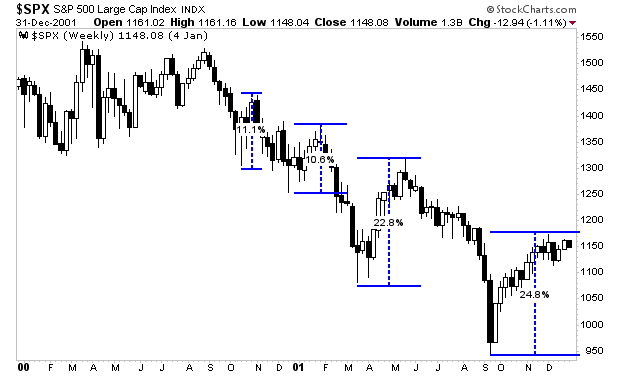
During
the Tech Crash, the S&P 500 experienced four rallies, ranging from 10% to
25%, and lasting two weeks up to 2.5 months.
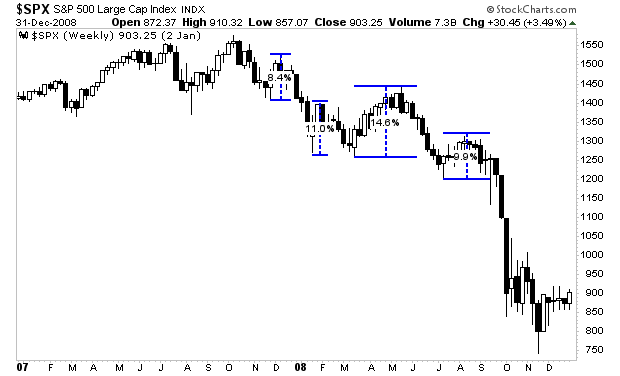
During
the Housing Crash, the S&P 500 experienced four rallies, ranging from 10%
to 15% and lasting one to two months each.
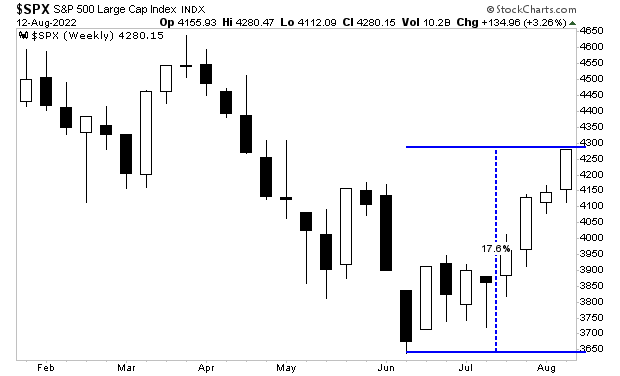
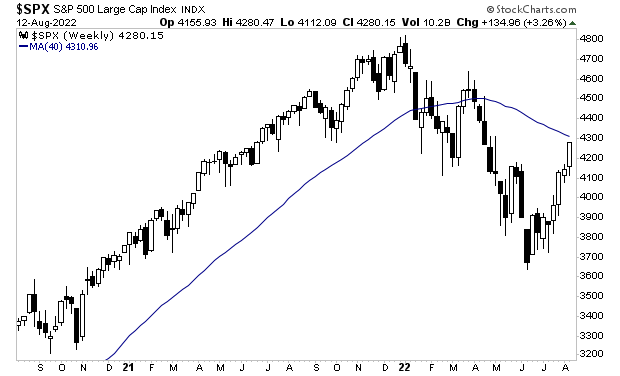
In this context,
the current rally in stocks is 9 weeks old (a little over two months) and has
seen the S&P 500 rally some 17%.
This begs the
question… if this is indeed a bear market rally… when will it end? Put another
way, when does the next leg down begin?
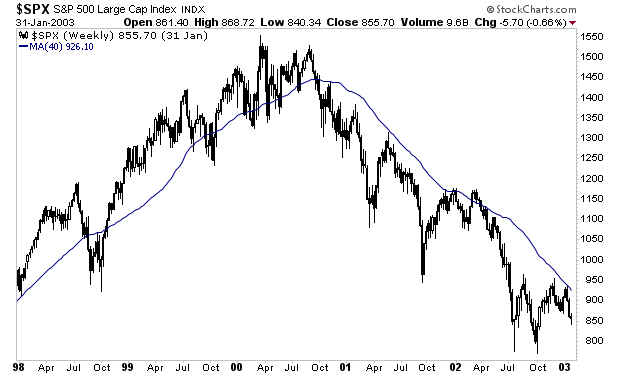
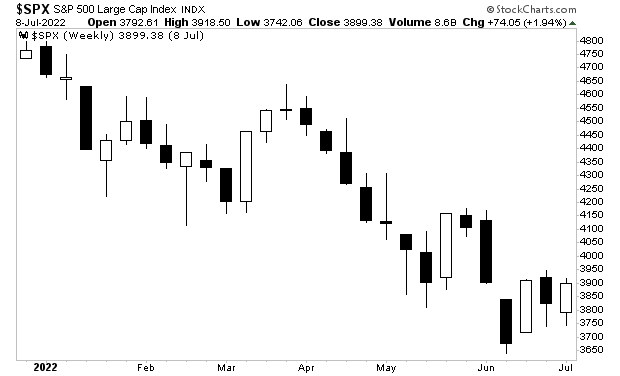
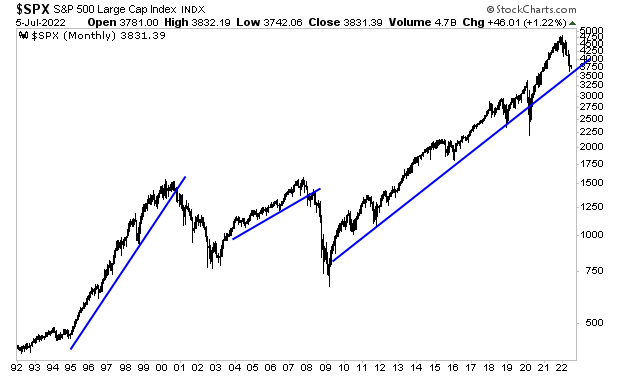
Historically, the
40-week moving average (the same as the 200-day moving average) has been a line
of GREAT significance during bear markets. During the Tech Crash, the S&P
500 was never able to break above this and stay there.
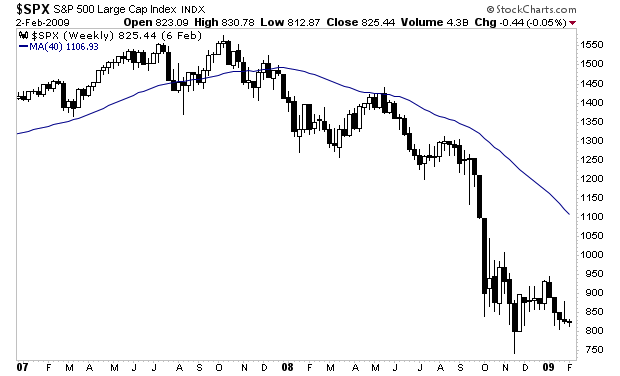
A similar dynamic
played out during the Housing Crash. Here again, the S&P 500 was unable to
reclaim the 200-DMA/40-WMA.
So where are
stocks trading today in relation to this line?
The S&P 500 is
just about to test its 200-DMA/40-WMA. If history is any guide, it won’t be
able to reclaim this line and stocks will begin their next leg down in the next
few weeks.
For those looking to prepare and profit from this
mess, our Stock Market Crash Survival Guide can
show you how.
On Friday I
outlined the technical setup for the stock market’s current bear market rally.
By quick way of
review…
The
price action in 2022 had been extremely bearish with 12 out of the
previous 15 weeks closing down as of mid-June.
The
S&P 500 was extremely extended below its 50-day moving average (DMA)…
hitting a low of 11% below that line in early June.
Put simply, the
markets were primed for a bear market rally. After all, EVERY major bear market
experiences these.
It is not uncommon for stocks to rally quite a lot… and for several weeks if not months, during bear markets. During the first 12 months of the Tech Crash, the stock market experienced two rallies of ~10 each lasting over a month in length, as well as two rallies of ~20+%, both of which lasted two months.
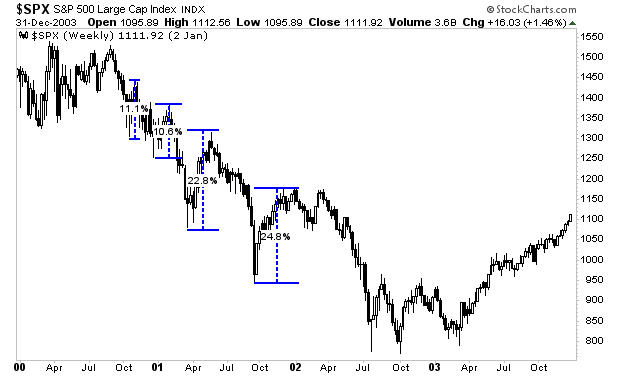
However, despite
these significant rallies, stocks continued down another year, finally starting
the bottoming process in late 2002.
Similarly, during
the Housing Bust, there were four stock market rallies of 10%-15%, each lasting
three weeks or more. Again, each of these ended in misery with stocks plunging
an additional 50% before the market bottomed in 2009.
My point with all
of this is that bear markets are extremely dangerous because stocks don’t go
straight down. Instead, the stock market frequently experiences significant
~10+% rallies that can last as much as two months.
Just like this current rally.
I’ll outline when the next leg down in this secular bear market will begin in tomorrow’s article… in the meantime, if you’re looking to prepare and profit from this mess, our Stock Market Crash Survival Guide can show you how.
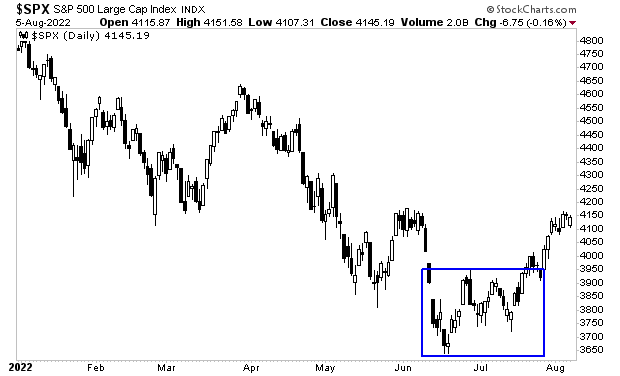
First and foremost, the price action for stocks in 2022 had been EXTREMELY bearish. The S&P 500 experienced EIGHT consecutive down weeks from late March until mid-May of 2022. Even more striking, from mid-March until early July, only THREE out of the 15 weeks had been up.
Historically, in any given week, stocks rally 56% of the time. So, the stock market’s performance has been extremely unusual in 2022. In this context, the market was overdue for a significant rally when stocks began to form a base in June-July.
Indeed, at the June lows, the S&P 500 was trading a whopping 11% below its 50-day moving average (DMA). I’ve illustrated this level in the below chart with a blue line. As you can see, this is an extremely rare occurrence having only happened two other times in the last 10 years: the COVID crash and the Fed 2018-policy error which blew up the debt markets.
My point is that
stocks were EXTREMELY oversold and stretched to the downside in mid-June of
2022. So, the stage was set for a bear market rally.
However, I have to emphasize that this is a bear market rally. Which means the next leg down is coming. The below chart tells us the story… though it’s not one the bulls want to see.
For those looking to prepare and profit from this
mess, our Stock Market Crash Survival Guide can
show you how.
Today is the last day this report is available to the
public.
We extended our offer by an additional 24 hours due
to the holiday weekend, but this is it… no more extensions!
July’s jobs numbers were amazing. And this is great news!
Or it would be… if the jobs numbers were remotely accurate.
According to the headlines, the U.S. added 528,000 jobs last month. Unfortunately, most if not all of these “jobs” were created in a spreadsheet, not the real economy.
Let’s dive in.
The most obvious issue concerns “seasonal adjustments.” You see, job growth isn’t spread out consistently throughout the calendar year. Some months typically see greater job growth than others. For example, the Retail and Hospitality industries typically see tremendous job growth during the holidays (November through January), and minimal job growth in other times of the year.
The problem here, is that this is going to make some months look great and others look no so good. So the Bureau of Labor Statistics (BLS) tries to get around this with “seasonal adjustments” which are meant to kind of average out the job creation throughout the year.
However, in reality these seasonal adjustments are just gimmick the BLS uses to fake the numbers… particularly at a time when the BLS is under tremendous political pressure to make the economy look better than it really is.
Times like today.
As Bill King notes, the seasonable adjustments for July 2021, were NEGATIVE 65,000. And yet, for some reason, the seasonable adjustments for July 2022, were POSITIVE 287,000.
So right off the bat, there are 352,000 “jobs” (65,000+287,000= 352,000) that were created in a government spreadsheet, NOT the real economy.
This represents over HALF of the supposed jobs created in the month of July 2022!
Then there’s the “Birth/ Death” model.
Throughout the year, new companies are created while old companies go out of business. The BLS tries to get around this issue with its “Birth/ Death” which is meant to average out the numbers throughout the year.
In reality, this too is just another gimmick. And it created another 85,000 jobs last month.
So now we’re talking about 437,000 (352,000+85,000) FAKE jobs.
That’s 437,000 out of the total 528,000 jobs reported for the month of July. Put another way, 82% of the jobs everyone was cheering about were created with accounting gimmicks!
I wish I was done here, but I’m not.
The BLS actually publishes TWO jobs reports… the Household Survey and Non-Farm Payrolls. The Household Survey is based on surveys of actual people while the Non-Farm Payrolls is crafted in a spreadsheet using the gimmicks I’ve already outlined above.
Guess which one tends to be more accurate?
And here’s the zinger… since May of 2022, the Non-Farm Payrolls shows the economy creating nearly one million jobs (926,000 to be exact).
The Household Survey shows the economy has LOST 136,000 jobs over the same time period.
This is the dark secret the bean-counters are trying to hide: that since at last May the economy is LOSING more jobs than it is creating.
There’s a word for this: it’s recession.
Ignore Wall Street and the financial media. The real economy is already in a recession. And those investors who believe the official jobs numbers are being lead like sheeps to the slaughter.
For those looking to prepare
and profit from this mess, our Stock Market Crash Survival
Guide can show you how.
Within its 21
pages we outline which investments will perform best during a market meltdown
as well as how to take out “Crash
insurance” on your portfolio (these
instruments returned TRIPLE digit gains during 2008).
We are making
100 copies of this report available to the public.
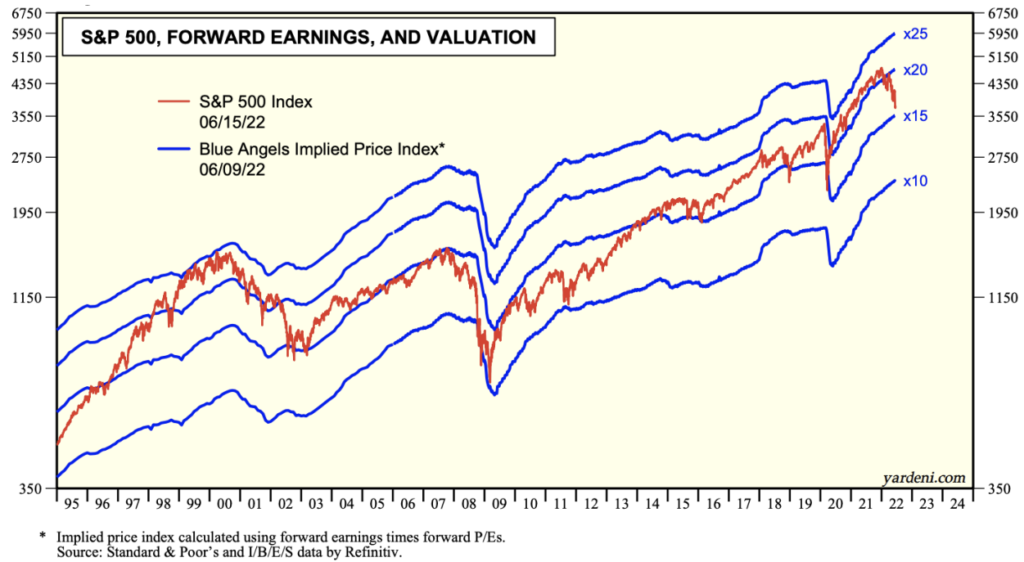
As I noted in yesterday’s article, if you want to make real money from the markets, you need to ignore what the Fed is saying and focus on price.
By quick way of review, the Fed and its awful predictions are the primary reason stocks have collapsed so far in 2022. The Fed screwed up with inflation. And inflation is the reason why Treasury yields spiked, forcing stocks to be repriced from 20-22 times forward earnings down to 15-16 times forward earnings (as Ed Yardeni’s fantastic chart below reveals).
Again, if you are looking to profit from the markets, you’re much better off ignoring the Fed and focusing on price.
So, what is price telling us now?
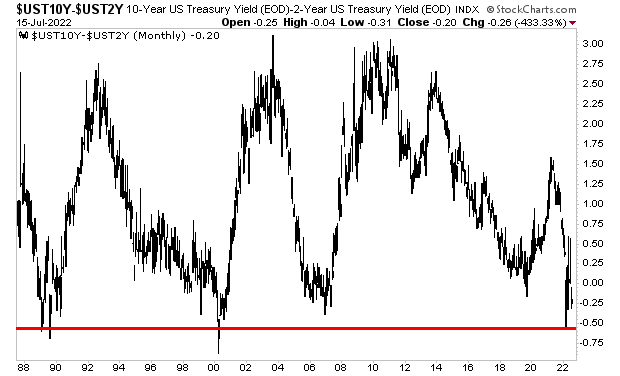
The Treasury yield curve has just inverted. The yield curve is comprised of comparing the yields on various bonds. One of the most common ones used for economic predictions is the 2s10s: what you get when you subtract the yield on the 2-Year Treasury from the yield on the 10-Year Treasury.
Whenever the yield on the 2-Year Treasury exceeds that of the 10-Year Treasury, the yield curve is inverted. This ONLY happens before a recession. And right now, it is more inverted than at any point since the year 2000.
In simple terms, a recession is coming and coming soon.
What does this mean for stocks?
I’ll detail that in tomorrow’s article. In the meantime, if you’re looking to prepare and profit from what’s coming, our Stock Market Crash Survival Guide can show you how.
Within its 21
pages we outline which investments will perform best during a market meltdown
as well as how to take out “Crash
insurance” on your portfolio (these
instruments returned TRIPLE digit gains during 2008).
To pick up
your copy of this report, FREE, swing by:
Stocks soared higher on Friday because a Fed official suggested they might not have to tighten rates as rapidly as before.
Yes, you read that correctly… the Fed will still have to tighten (and tighten a lot), but it might not need to do so as rapidly…
And this ignited a massive rally!
Let’s cut through the BS here.
The Fed is arguably one of the worst forecasters in the world. All throughout 2021, Fed officials repeatedly told us that inflation was either non-existent or “transitory.”
How’d that work out?
Inflation is at 40+ year highs. Americans have never spent more of their paychecks on gas and food. And if not for various gimmicks with the inflation numbers, the official inflation metric would be in the double digits.
And we’re supposed to believe that somehow the Fed is now able to correctly assess this situation?
The below chart tells you all you need to know. And you don’t need to suffer through some Fed official’s nonsense to get a clear picture of what’s coming.
The market is where you get the best information… not some Fed official whose job is verbally intervene whenever stocks are close to breaking down. Ignore the Fed, and focus on the market and you’ll come out of this mess intact.
For more detailed information on how to prepare and profit from this mess, you should check out our Stock Market Crash Survival Guide.
Within its 21
pages we outline which investments will perform best during a market meltdown
as well as how to take out “Crash
insurance” on your portfolio (these
instruments returned TRIPLE digit gains during 2008).
To pick up
your copy of this report, FREE, swing by:
The financial system is now screaming “RECESSION!”
The yield curve is perhaps the single best predictor of recessions in the world. If you’re unfamiliar with how the yield curve works works, in broad terms, there are three categories of U.S. debt: Treasury Bills or T-bills (usually short-term debt), Treasury Notes (long-term debt up to 10 years), and Treasury Bonds (long-term debt for 20 or 30 years).
Treasury Bill Maturation Periods:
4 Weeks
13 Weeks
26 Weeks
52 Weeks
Treasury Note Maturation Periods
2 Years
3 Years
5 Years
7 Years
10 Years
Treasury Bond Maturation Periods
20 Years
30 Years
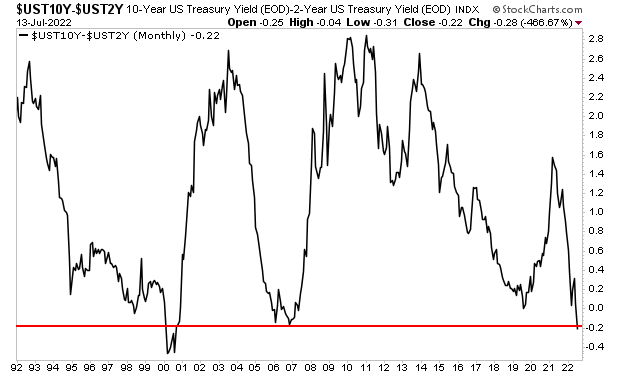
The yield curve is comprised of comparing the yields on these various bonds. One of the most common ones used for economic predictions is the 2s10s: what you get when you subtract the yield on the 2-Year Treasury from the 10-Year Treasury.
Whenever the yield on the 2-Year Treasury exceeds that of the 10-Year Treasury, the yield curve is inverted. This ONLY happens before a recession. And right now, it is more inverted than at any point since the year 2000.
This is effectively the bond market, which is the single best predictor of recessions on the planet, SCREAMING that a recession is coming.
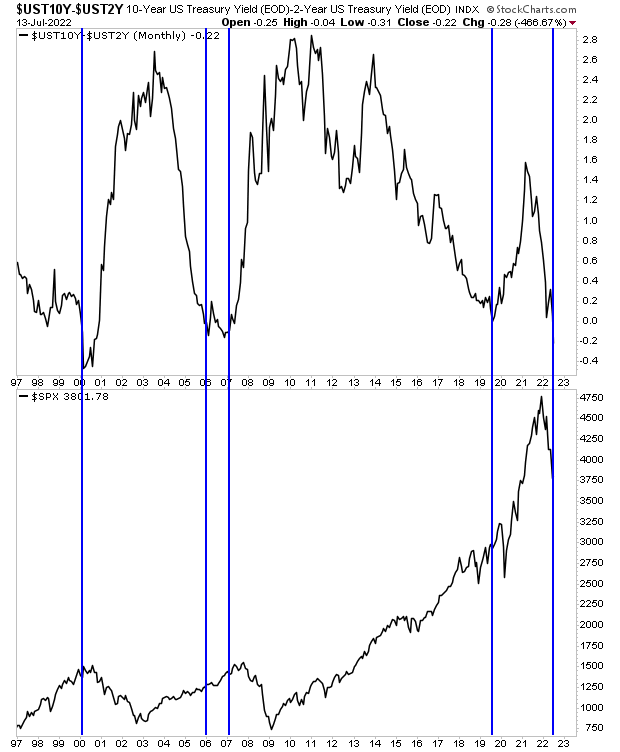
What does this mean for stocks?
I’ve illustrated the last FOUR yield curve inversions on the below chart. You can see what came next for the stock market.
Buckle up… a crash is coming.
If you’re looking for a way to profit from this… while avoiding the major losses that will cripple most investors’ portfolios,
our Stock Market Crash Survival Guide can show you how.
Within its 21
pages we outline which investments will perform best during a market meltdown
as well as how to take out “Crash
insurance” on your portfolio (these
instruments returned TRIPLE digit gains during 2008).
To pick up
your copy of this report, FREE, swing by:
Many investors have been getting crushed by the collapse in the inflation trade.
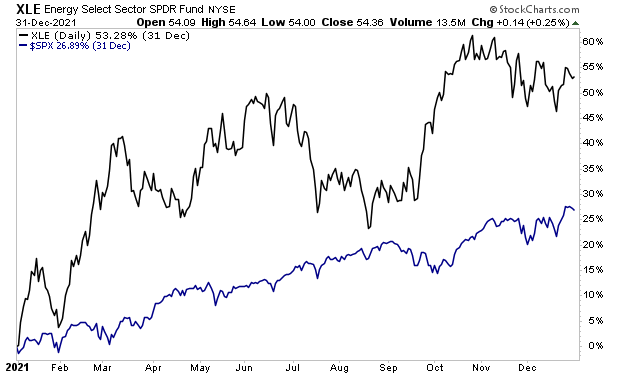
By quick way of review, throughout 2021 and the first quarter of 2022, inflation-based investments dramatically outperformed the broader market. In particular, Energy stocks (XLE) produced outsized gains, more than doubling the performance of the S&P 500 in 2021.
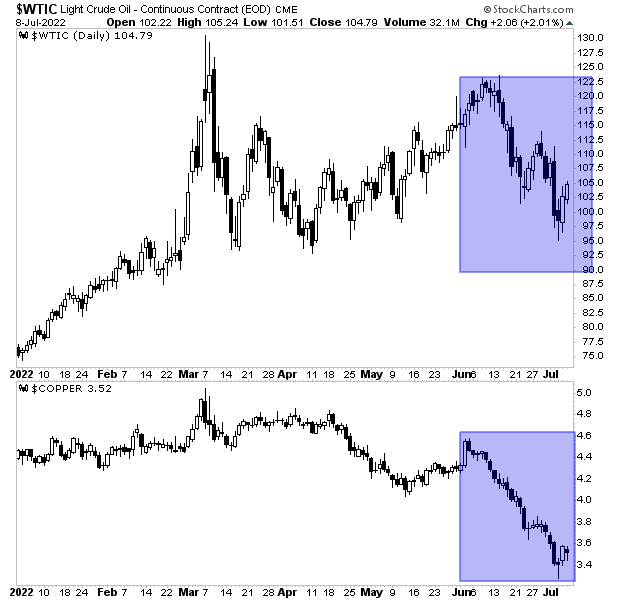
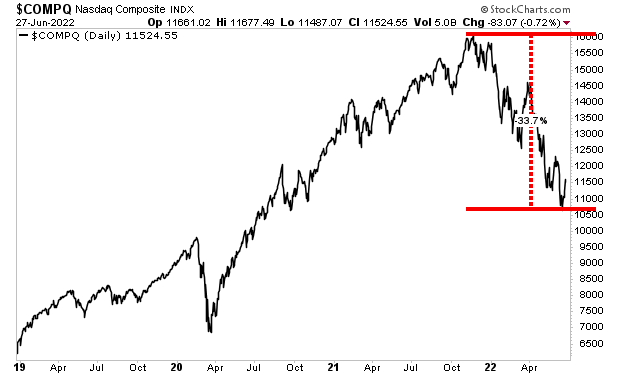
This all changed in June of this year. From that point onward inflation plays like oil, copper and the like have been collapsing. Oil fell 20% peak to trough. Copper is down 30%. Note the blue rectangles in the chart below.
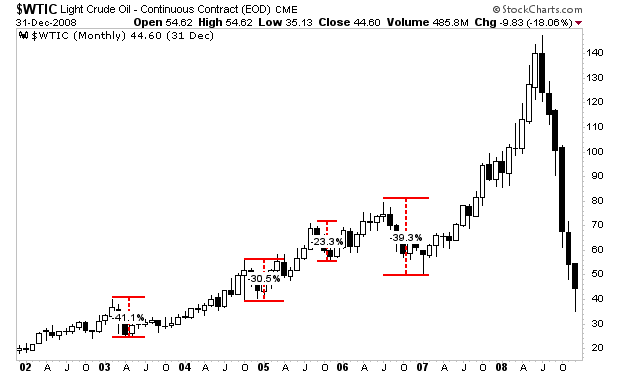
Is the inflation trade over? Not necessarily. Commodities are an extremely volatile asset class: corrections of 20%, 30%, or even 40% are common during major bull markets in commodities.
Case in point, during the last big commodities run from 2002-mid-2008, oil had numerous corrections of 20%-40% before the final blow off top.
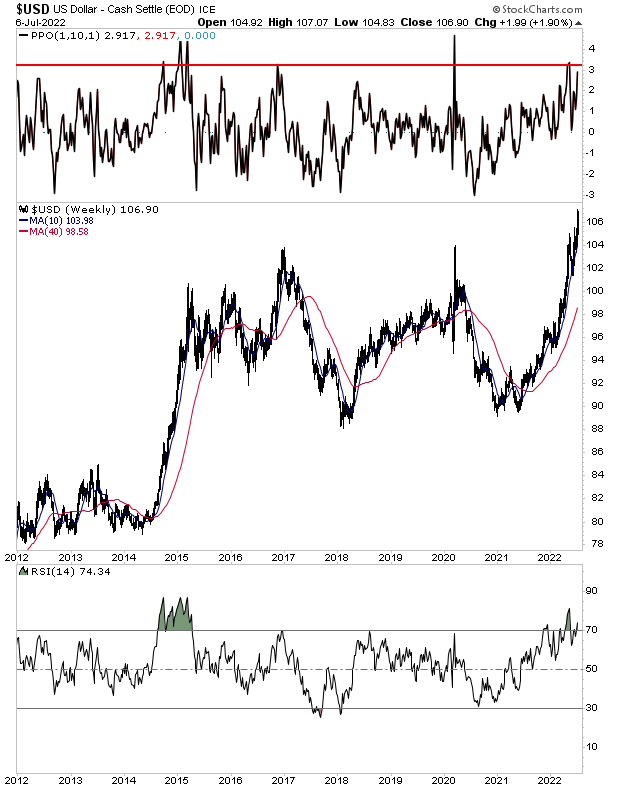
Again, the commodity space is at a critical juncture today. The volatility of the last few weeks is actually quite normal for the space. And the key for determining when the next leg up begins is the $USD.
The $USD has been on a tear as the world is hungry for dollars. Whenever this rally ends and the greenback rolls over again, the commodity space will catch a bid.
As I write this, the greenback’s Relative Strength Index (RSI, located in the bottom box) is overbought. Moreover, the $USD is trading 3% above its 10-week moving average which is also the same as the 50-DMA (see the top box).
On
that note, we just published a Special Investment Report concerning FIVE secret
investments you can use to make inflation pay you as
it rips through the financial system in the months ahead.
The
report is titled Survive the Inflationary Storm. And
it explains in very simply terms how to make inflation PAY YOU.
We
are making just 100 copies available to the public.
That the economy is already in recession. It’s not a matter of a recession arriving soon… a recession is already here.
By quick way of review…
1) Copper, a commodity that is closely aligned with economic growth, has erased HALF of its pandemic gains.
2) Oil, another commodity that is closely aligned with economic growth, has collapsed by 23% in the last four months. And the situation is getting worse: oil dropped over 9% on Tuesday.
In light of all of this, you might be saying, “OK Graham, is a recession is already here, why isn’t it showing up in the data?”
Because the data is backward-looking.
Every piece of data the U.S. reports concerns what has already happened… usually months ago. Case in point, the U.S. only just released its GDP data concerning the first quarter of 2022 eight days ago.
To put that into context, the economy is now in its THIRD quarter of the year. And we’re only just getting the final results for the first quarter now!?!
Again, every piece of data the U.S. is weeks, if not months old.
The market, by way of contrast, is forward-looking: it discounts what is about to happen.
With that in mind, what does the below chart tell you about the true state of the economy today?
And if you think that chart is nasty looking, you better not look at this next one.
It makes perfect sense… the last two recessions saw major bear markets that erased over 50% of the stock market’s value. Why would this one be different?
For those looking to prepare and profit from this mess, our Stock Market Crash Survival Guide can show you how.
Within its 21
pages we outline which investments will perform best during a market meltdown
as well as how to take out “Crash
insurance” on your portfolio (these
instruments returned TRIPLE digit gains during 2008).
To pick up
your copy of this report, FREE, swing by:
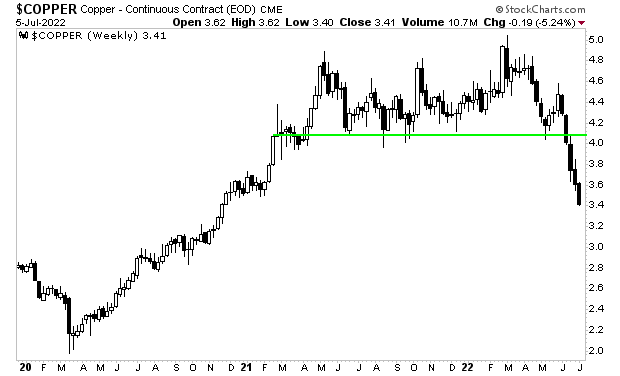
The stock market is finally waking up to fact that a recession is already here.
The first sign was copper.
Copper is commonly referred to as “Dr. Copper, the commodity with a PhD in economics.” The reason for this silly name is that the commodity is extremely economically sensitive due to it having so many industrial uses. When the economy is booming copper rallies and when the economy contracts, copper falls.
Copper has collapsed, wiping out half of its pandemic gains. That is correct, copper erased HALF of the entire move from the 2020 lows… a move that was fueled by over $15 trillion in global stimulus. And it did it in the span of two months.
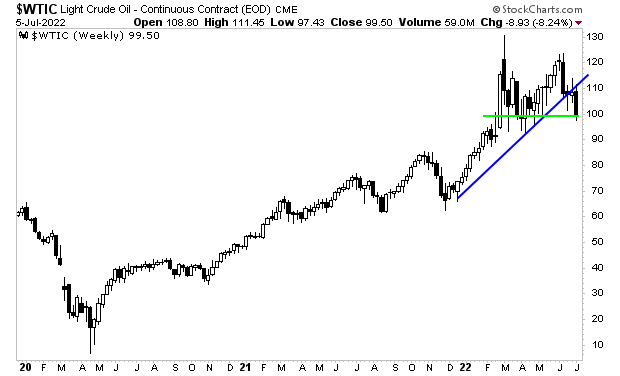
Now it’s oil’s turn.
Oil is used in practically everything you wear, eat, touch, or drive.
Oil or oil derivatives are present in lipstick, Vaseline, solar panels, polyester (stain resistant clothes), chewing gum, crayons, Aspirin, pantyhose, sneakers, detergent, CDs, concrete/cement, plastics of any kind, food additives, fertilizers, pesticides, candles, milk cartons, pen ink, and more.
Put simply, oil is extremely economically sensitive. And yesterday it was annihilated,
dropping over 9% in a single day to below $100 per barrel. The uptrend is broken here and the commodity is barely clinging to support.
Both of these commodities… which are HIGHLY associated with economic growth, are collapsing. What does this tell you about the true state of the economy today?
Worst of all, this spells BIG TROUBLE for the stock market. The last three recessions involved stock market crashes… will this one be any different?
Take a look at the following chart and tell me what you think…
If you’re looking for someone to help you navigate this mess, few analysts have the ability to navigate crises like I do.
For those looking to prepare
and profit from this mess, our Stock Market Crash Survival
Guide can show you how.
Within its 21 pages we outline which investments will perform best during a market meltdown as well as how to take out “Crash insurance” on your portfolio (these instruments returned TRIPLE digit gains during 2008).
We are making just 100 copies available to the general public. And they are going fast.
To pick up
your copy of this report, FREE, swing by:
Yesterday I outlined that the Fed is once again lying to
Americans about the risks they face.
The big lie of 2021 was that inflation was non-existent or
“transitory.” We all know how that turned out. Inflation is at a 40-year high,
gas is over $5 a gallon, and Americans have never spent more of their incomes
on gas and food.
Now the Fed is back with another big lie. It’s the big lie
of 2022: that the U.S. won’t enter a recession. For most Americans, the economy
has been in recession for months.
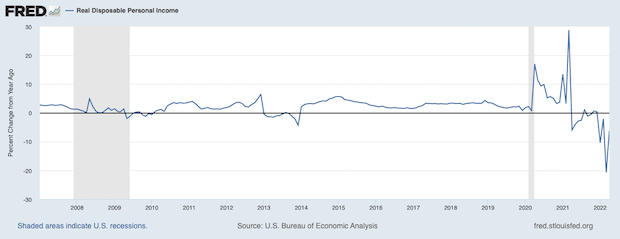
The National Bureau of Economic Research (NBER) released a
trove of data yesterday with its highly massaged GDP results. And BOY did it
have some worrying stuff in it. Most worrying of all was the following:
Real Disposable Personal Income collapsed an incredible 12%
in the first quarter of 2022. Even more incredibly, it has fallen in THREE of
the last four quarters.
Unfortunately, it’s even worse than that. Look at the below
table. Yes, you are reading that correctly, the collapse in Real Disposable
Personal Incomes is larger than that which occurred during the 2008 recession.
This is why inflation is so devastating… because it destroys
Americans’ pocketbooks. It’s also why every time inflation rises above 5%, a
recession hits.
Remember, 75% of GDP is consumer spending. But if consumers
have to cut back on their disposable spending because the basic cost of living
(gas, food, etc.) is through the roof… you get a recession.
Like today.
So again, the Fed is LYING about the recession, just like it
lied about inflation in 2021.
For those looking to prepare
and profit from this mess, our Stock Market Crash Survival
Guide can show you how.
Within its 21
pages we outline which investments will perform best during a market meltdown
as well as how to take out “Crash
insurance” on your portfolio (these
instruments returned TRIPLE digit gains during 2008).
To pick up
your copy of this report, FREE, swing by:
Over the last two
days, I’ve been explaining how inflation has triggered a recession in the U.S.
By quick way of
review:
The Fed
lied about inflation throughout 2021, claiming it was non-existent or “transitory”
meaning it would go away by itself.
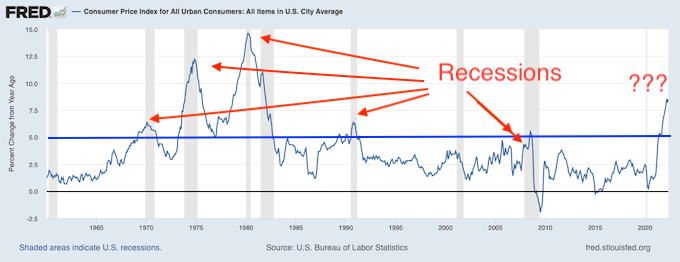
Once inflation,
as measured by the Consumer Price Index (CPI), breaks above 5% a recession has
followed every time in the last 50 years.
CPI
broke above 5% in September 2021.
Inflation
triggers a recession because it means consumers have to cut back spending (75%
of GDP is consumer spending).
All of this is really
bad news for stocks.
As I’ve written
many times before, U.S. bonds, called Treasuries, are the bedrock of our
current financial system. The yields on these bonds represent the “risk free”
rate of return against which all risk assets are valued.
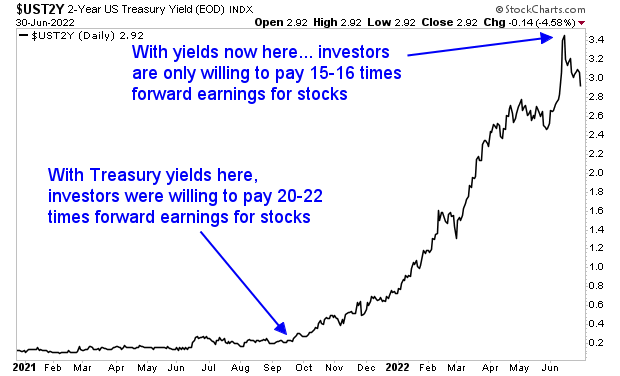
With that in mind,
the ENTIRE drop in stocks thus far has been due to the “Price” in Price to
Earnings, being adjusted to Treasury yields rising. With Treasury yields at
0.25%, investors were willing to pay 20 to 22 times forward earnings for stocks.
But now that Treasury yields have risen to 3%, investors are only willing to
pay 15-16 times forward earnings.
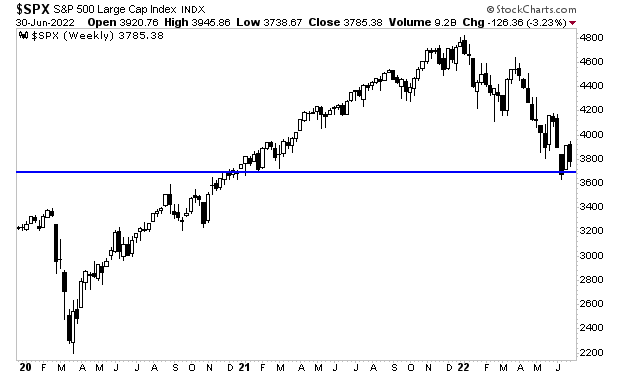
Put simply, the
bear market in stocks thus far was ENTIRELY based on inflation… NOT on a recession.
As I write this, the consensus Wall Street Earnings Per Share (EPS) in 2022 is around
$230. A stock market valuation of 16 times earnings give us a fair value of
3,680 for the S&P 500.
And that’s roughly
where stocks have fallen to thus far in this bear market.
Unfortunately for
Wall Street and its delusional forecasts…The average recession results in EPS
falling 25%. This would mean 2022 EPS is actually $172, NOT $230.
A stock
market valuation of 16 times this new much lower EPS means the S&P 500’s
fair value drops to 2,760.
That’s the blue
line in the chart below.
The Fed lied about
inflation… and it wiped out 30% of the stock market. The Fed is now lying about
a recession… and it’s going to send stocks to levels most investors can’t
imagine.
For those looking to prepare
and profit from this mess, our Stock Market Crash Survival
Guide can show you how.
Within its 21
pages we outline which investments will perform best during a market meltdown
as well as how to take out “Crash
insurance” on your portfolio (these
instruments returned TRIPLE digit gains during 2008).
We are making
100 copies of this report available to the public.
One of the BIGGEST LIES in financial history was the Fed’s claim that there was no inflation or that inflation was transitory in 2021.
How do I know this was a lie?
Because the Fed’s own research contradicted its claim!
If you’re unfamiliar with the Fed’s Beige Book, it’s a report the Fed publishes eight times per year.
In it, the 12 regional banks that comprise the Fed present anecdotal information on the U.S. economy. The Fed retrieves this information via interviews and conversations with business leaders, market experts and other people at the frontlines of the economy.
And throughout 2021, all of these people were SCREAMING that inflation was a major problem. In fact, the complaints about “rising costs” and “needing to raise prices” started as early as March 2021.
Despite this, the Fed argued that inflation was non-existent or would disappear shortly for another six months. We all know how that turned out. The Fed capitulated, inflation is roaring, and we’re all suffering as a result.
And unfortunately for us, the Fed is now pushing another WHOPPER of a lie.
That lie?
That the economy won’t enter recession later this year or the next.
How do I know this is a lie?
You guessed it… because the Fed’s own research contradicts it!
A recession is denoted by a prolonged period of economic contraction. And as everyone knows, the U.S. economy contracted in the first quarter of 2022. So if it contracts again in the second quarter… we’d be in recession.
The Fed runs a service called GDPNow that measures the economy in real time. According to this measure, the economy is flatlining in the second quarter. Sure, the beancounters might be able to massage the data to make it look as if the economy grew by a little bit… but look around you… does the economy feel like it’s booming to you?
It sure doesn’t to me. If anything it feels as if things took a major turn for the worse months ago.
And why wouldn’t they? After all, history has shown us that ANY TIME inflation breaks above 5%, the U.S. economy enters a recession. And inflation cleared 5% in September of last year!
Let’s cut through the BS here. We all know the U.S. is in recession. And we also know that by the time the Fed admits it, the market will have already collapsed to levels most investors don’t even want to imagine.
I’ll detail just how low stocks could go due to the recession in tomorrow’s article. In the meantime we just published a Special Investment Report concerning FIVE secret investments you can use to make inflation pay you as it rips through the financial system in the months ahead.
The report is titled Survive the Inflationary Storm. And it explains in very simply terms how to make inflation PAY YOU.
We made 100 copies to the public… and they are going fast.
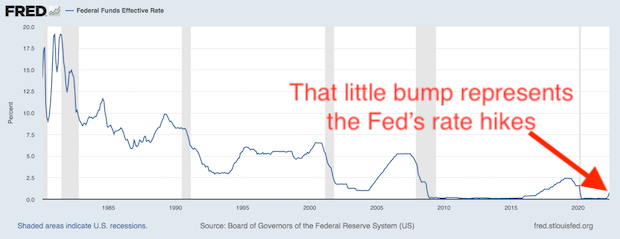
Yesterday I noted that the Fed is completely delusional about engineering a “soft landing.”
The reality is that the Fed has barely raised interest rates. As I write this rates are at 1.5%… while inflation as measured by the CPI is over 8%. And real inflation is likely much higher (CPI doesn’t accurately measure the cost of housing or other items).
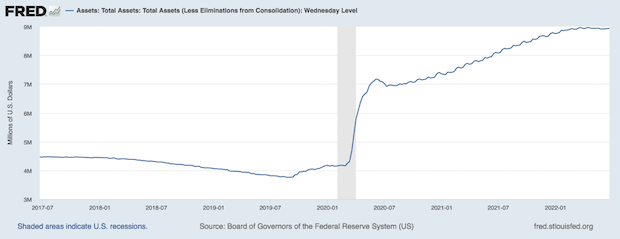
Meanwhile, the Fed has yet to shrink its balance sheet… at all. It claims it can shrink it by over $1 trillion. That’s amusing since the last time the Fed tried to shrink it balance sheet by even $500 billion (2018) the corporate debt market froze and the stock market crashed.
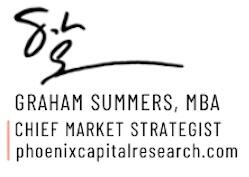
The summate… the Fed has done next to nothing to stop inflation. And already the markets have lost over $25 TRILLION in wealth. The NASDAQ alone has lost 33% of its value in the span of six months.
Moreover… the economy is already in recession. The Fed’s own data shows GDP growth went negative in 1Q22. And it’s barely positive thus far in 2Q22. Even if the Fed massages the data to insure we don’t see two quarters of negative GDP growth, the reality is that the markets are telling us a recession is here now.
Copper is commonly called “Dr. Copper, the commodity with a PhD in economics” because it has so many industrial uses that its price is closely linked to economic growth. When the economy is booming copper rises and when the economy is contracting copper price falls.
What is the below chart telling you?
Add it all up… and the best the Fed can hope for is “stagflation” or a period of high inflation combined with economic weakness. And that’s assuming the Fed knows what it’s doing… which given the fact the Fed claimed inflation was “transitory” for most of 2021, is unlikely.
So what does this mean for investors?
That inflation will continue to run hot MUCH longer than anyone expects. The Fed is bluffing when it states it can get inflation under control easily… it’s going to take a LONG time and involve a LOT of pain for anyone who buys into the Fed’s nonsense.
But you don’t have to suffer during this nightmare.
On that note, we just published a Special Investment Report concerning FIVE secret investments you can use to make inflation pay you as it rips through the financial system in the months ahead.
The report is titled Survive the Inflationary Storm. And it explains in very simply terms how to make inflation PAY YOU.
We made 100 copies to the public… and they are going fast.
The Fed is now telling us that it can avoid a recession… or engineer a “soft landing.”
It’s a pretty stunning argument… and it raises questions as to whether the Fed actually believes this stuff… of if it’s simply saying this for political purposes so people won’t panic.
Consider what the Fed has done so far in this tightening cycle.
The Fed has raises rates three times bringing them to 1.5%-1.7%. Historically, this is where rates would FALL TO during a market crash or economic downturn. Inflation, as measured by the Consumer Price Index or CPI is over 8%. So rates are extraordinarily low.
Meanwhile, the Fed has yet to shrink its balance sheet… at all.
That’s correct, despite all its claims of “taking action” and “moving to stop inflation” the Fed has yet to shrink its balance sheet. It’s literally done NOTHING in terms of draining liquidity from the financial system.
In simple terms, the Fed has done next to nothing to stop inflation. Rates are at levels that you would usually associate them to hit during easing cycles and the Fed’s balance sheet is ~$9 trillion.
Meanwhile, stocks and bonds have wiped out over $25 TRILLION in wealth… more than was wiped out during the Great Financial Crisis of 2008 and the pandemic Crash of 2020.
What does this all mean?
That inflation will continue to run hot MUCH longer than anyone expects. The Fed is bluffing when it states it can get inflation under control easily… it’s going to take a LONG time and involve a LOT of pain for anyone who buys into the Fed’s nonsense.
On that note, we just published a Special Investment Report concerning FIVE secret investments you can use to make inflation pay you as it rips through the financial system in the months ahead.
The report is titled Survive the Inflationary Storm. And it explains in very simply terms how to make inflation PAY YOU.
We made 100 copies to the public… and they are going fast.
The U.S. is in recession. A recession is not coming, it’s already here.
I know it. You know it. Just look around you.
Yes, restaurants and airports are packed… but demand for both dining out and travel are pent up after two years of lockdowns. These parts of the economy don’t represent real demand. They represent people desperate to return to some semblance of normalcy… and burning through their savings/ racking up credit card debt to do so.
Everything else is imploding and has been for months.
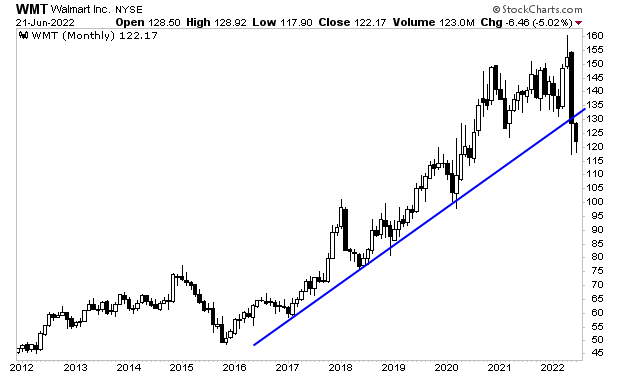
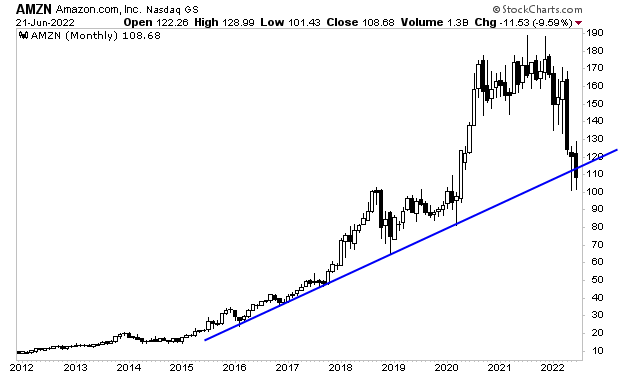
Walmart is the largest retailer in the U.S. In many ways it is the U.S. economy, as it is both the largest private employer and larger retailer. What does this chart tell you?
How about Amazon (AMZN), the largest online retailer, and the company everyone thought was indestructible even during periods of economic weakness? What’s it doing?
Again, the U.S. is already in recession. The people trying to predict it in the future are ignoring the clear and obvious signs right in front of them… that the recession has already arrived and has been here for some time.
What caused this?
Inflation.
Some 75% of GDP is consumer spending. But if consumers can’t even afford basic items like gasoline or food (let alone rent), then NO ONE is going to be buying much of anything else.
These are the TWO big investment themes today… a recession and hot inflation. And those investors who play them correctly stand to make literal fortunes.
On that note, we just published a Special Investment Report concerning FIVE secret investments you can use to make inflation pay you as it rips through the financial system in the months ahead.
The report is titled Survive the Inflationary Storm. And it explains in very simply terms how to make inflation PAY YOU.
We made 100 copies to the public… and they are going fast.
Sometimes understanding how things work can be a bit lonely…especially when it comes to knowledge of our current financial system.
Trust me, I know… if you want to talk about “banks” or“the US Dollar” or “the Federal Reserve” to those around you, they typically look at you as though you’re talking about UFOs or some other crazy subject.
However, these issues affect all of us.
There isn’t a person in the United States (or the world for that matter) who is not affected by the actions of the Central Bank one way or another. A horrible example of this is the inflation we are all experiencing: it is almost entirely the fault of the U.S. central bank, the Federal Reserve, printing over $5 trillion in the span of 24 months.
And yet, how many know about this… or why how the Fed works… and why it does what it does?
This is a big reason why I chose to write my best-selling book The Everything Bubble: TheEndgame For Central Bank Policy: to explain how the financial system was set up and how it truly works…NOT in complicated terms, but in a language that ANYONE, even those with ZERO experience in finance, could understand.
On that note, Amazon is currently running a special on The Everything Bubble…11% off on the paperback and an astonishing 85% off on the Kindle version.
So if you’ve yet to pick up a copy… or would like to gift a copy to family and friends, this is the single best opportunity all year todo so.
To take advantage of these prices… and potentially change someone’s life with the gift of knowledge and understanding of how our financial system truly works…
So if you’ve yet to pick up a copy… or would like to gift a copy to family and friends, this is the single best opportunity all year to do so.
To take advantage of these prices… and potentially change someone’s life with the gift of knowledge and understanding of how our financial system truly works…
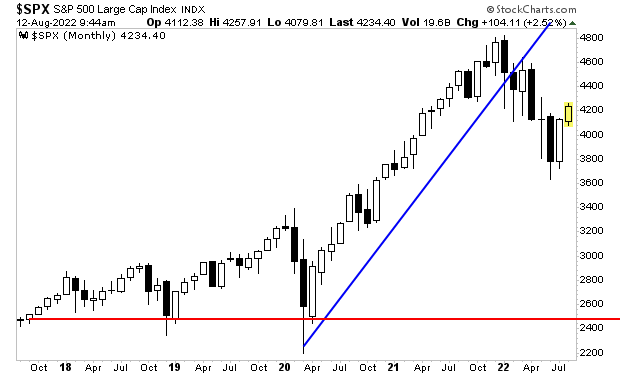
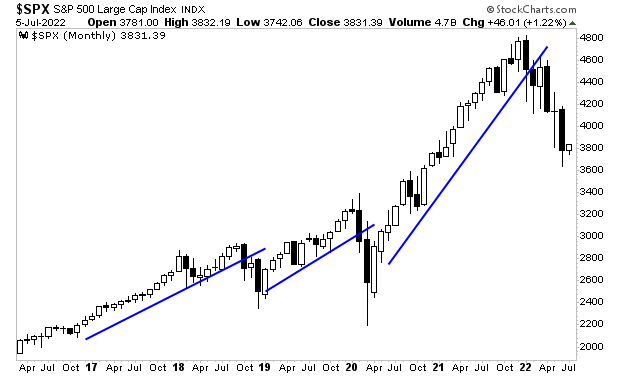
Stocks are currently in a bear market. The average bear market is 9 months long and sees stocks lose 30%.
Thus far this bear market is six months old, and stocks are down just 21%. So, the issue is determining just how much further we have to go.
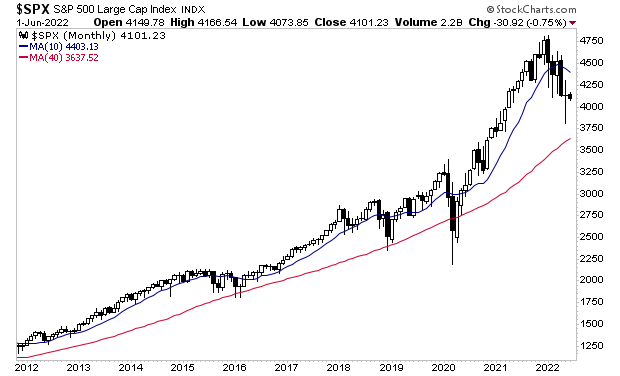
As I’ve mentioned previously, at the very least we can expect this bear market to see the S&P 500 break down to touch its 40-month moving average (this is the same thing as the 200-week moving average). The 40-MMA is illustrated by the red line in the chart below.
The bigger question is what happens there.
During the COVID-19 crash, the Fed moved to support the entire financial system. That is the only thing that stopped stocks from entering a full-scale crisis.
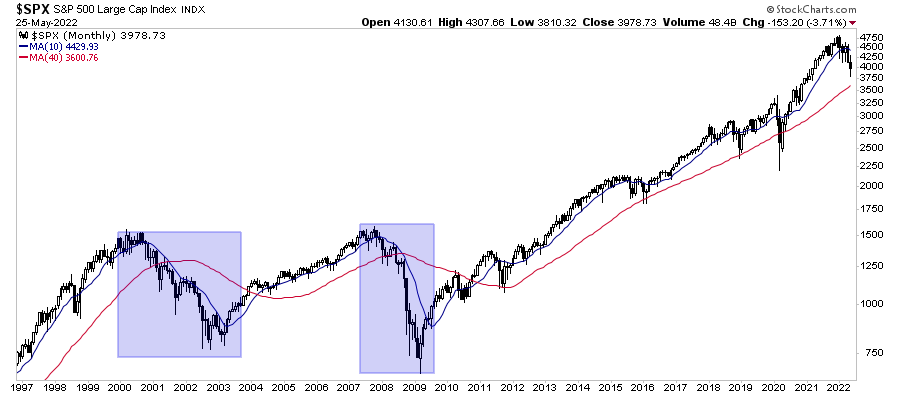
During a full-scale crisis, the S&P 500 usually breaks its 40-MMA and then wipes out almost the entirety of the previous bull market’s gains. I’ve illustrated this with blue rectangles in the chart below.
A similar move this time around would mean the S&P 500 falling to at least 1,750.
Will this happen? It’s certainly possible. As I mentioned a moment ago, the only thing that pulled the market back from the brink in 2020 was the Fed moving to ease monetary conditions in an extraordinary way.
This time around, the Fed is trying to tackle inflation… so easing would only worsen the problem! The Fed has only raised rates to 1% and will begin shrinking its balance sheet on June 15th… and stocks have already lost 20% of their value.
What happens when the Fed is forced to raise rates to FIVE percent or more. What happens when it tries to shrink its nine TRILLION dollar balance sheet by $1+ trillion.
You get the idea.
The Mother of All Collapses is coming!
The time to prepare is NOW before it hits.
For
those looking to prepare and profit from this mess, our Stock Market Crash Survival Guide can show you how.
Today is the last day this report will be available to the public.