Back in September 2022, which now seems so long ago, the global financial system nearly entered a debt crisis.
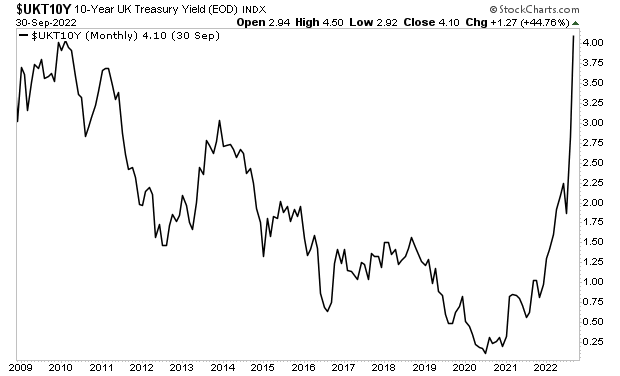
The first country to “get to the brink” was the United Kingdom or U.K. At that time, the U.K.’s new government, led by Prime Minster Liz Truss, introduced a tax cutting program that neither the bond nor the currency markets could stomach.
The yield on the 10-Year U.K. Government bond went vertical signaling default risk.
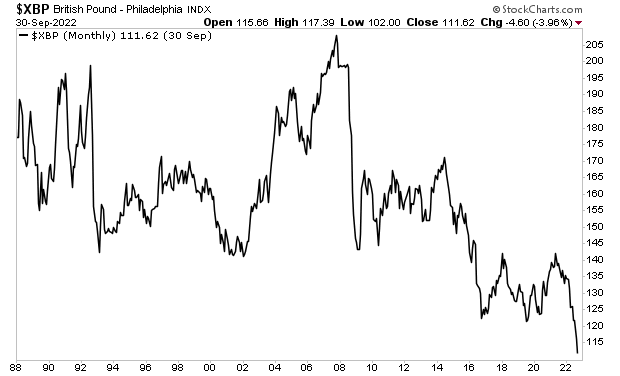
While the British Pound imploded, collapsing to a 30+ year low.
In the simplest of terms, the U.K. appeared to be the first country to enter a sovereign debt crisis. Then, suddenly, in the span of a few weeks, this ENTIRE PROBLEM went away.
The official narrative sold to the public concerning the “solution” to this issue was that Prime Minster Truss resigned and a new government was formed.
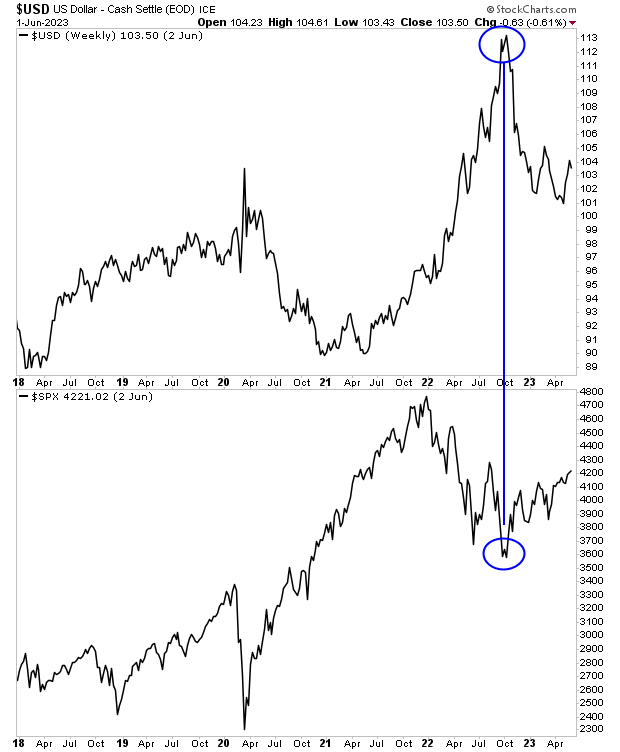
However, it’s rather odd that TWO WEEKS before Ms. Truss resigned, the $USD suddenly rolled over and started to collapse while risk assets like stocks caught a bid. Indeed, the entire global financial system entered one of its most aggressive “risk on” chapters in recent history. And it did this on a dime in mid-October 2022.
Perhaps something or someone else was responsible for this incredible turn of events. Perhaps global central banks coordinated a “behind the scenes” intervention that forced bond yields lower so stocks could catch a bid. We’ll never know the true story, but the global financial system sure as heck wasn’t “saved” by Prime Minister Truss resigning.
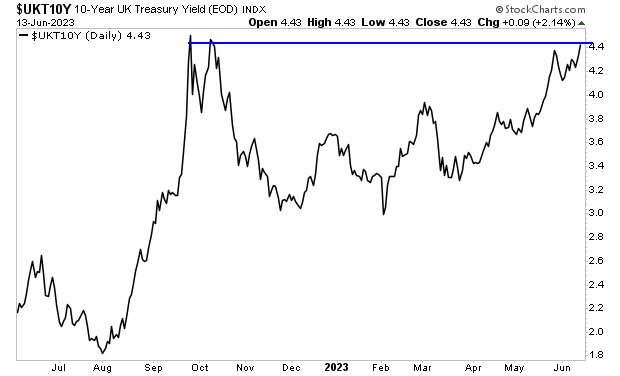
I mention all of this because once again the U.K.’s debt markets are blowing up with yields on the 10-Year U.K. Government bond getting dangerously close to the levels at which things started to break in 2022.
There are many different ways to profit from this situation. We recently outlined one method that smart investors have used to create life changing wealth during a bear market.
Normally this report would be sold for $249. But we are making it FREE to anyone who joins our Daily Market Commentary Gains Pains & Capital.
There are two primary reasons why inflation has remained so persistent despite the Fed raising rates from 0.25% to 5.25% in the span of 14 months.
1) The Fed is using the wrong tools to end inflation.
2) The Federal Government continues COVID-19 emergency levels of spending.
Yesterday we discussed #1. Today we’re going to dissect #2.
Between 2020 and 2022, the Fed printed roughly $5 trillion. The Federal Government spent/ printed another $6 trillion.
Over the last 14 months, Fed has raised rated from 0.25% to 5.25% while draining $500 billion in liquidity from the financial system. In simple terms, the Fed has stopped printing money and is tightening monetary policy.
The Federal Government has not altered its money printing/ spending. In fact, courtesy of the Debt Deal that was just signed into law, the Federal Government has NORMALIZED the emergency levels of stimulus/ spending it introduced during the pandemic.
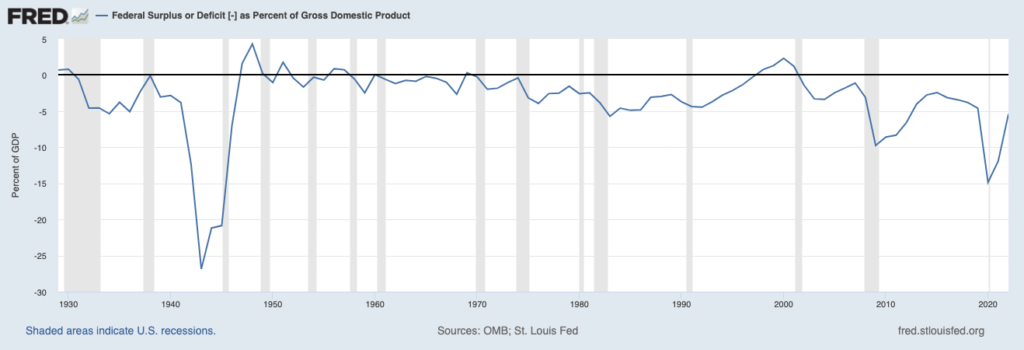
The government is financed via tax revenues. If spending is greater than tax revenues, then the government issues debt to finance its spending. Despite pulling in record taxes in 2021 (and 2022’s tax haul is looking to be ever greater), the U.S. continues to run $1+ trillion deficits.
Relative to GDP, the deficit is greater than that the government ran during the depths of the 2008 crisis. Indeed, you have to go back to World War II to find a period in which the deficit relative to GDP was greater! And bear in mind, the government is currently running this kind of deficit TWO YEARS after the recession associated with the shutdowns ended!
And thanks to the Debt Deal, this level of stimulus/ spending will become normalized.
Section 265 of the bill notes that the OMB (Office of Management and Budget) director has sole waiver authority to spend whatever money the government wishes if said spending is deemed “necessary for program delivery.” (H/T. Rep Nance Mace for catching this).
The OMB is the part of the Executive Branch in charge of “overseeing the implementation” of the President’s “vision” for the economy. The OMB director is appointed by the President. And according to the current version of the debt dealing congress is voting on, this person has “sole waiver” authority on spending caps.
Put simply, she (the current OMB director is Shalanda Young), is permitted to spend as much money as President Biden wants, provided the spending is deemed “necessary” to deliver on programs that meet his vision for the economy.
That single line negates any and all cuts or spending caps laid out elsewhere in the debt deal. It’s akin to someone writing “everything else in this 99-page bill is non-binding.”
In the very simplest of terms, this deal, if it passes, would normalize the government’s COVID-19 level of spending. This would be highly inflationary. And it would make the Fed’s job of tackling inflation that much more difficult.
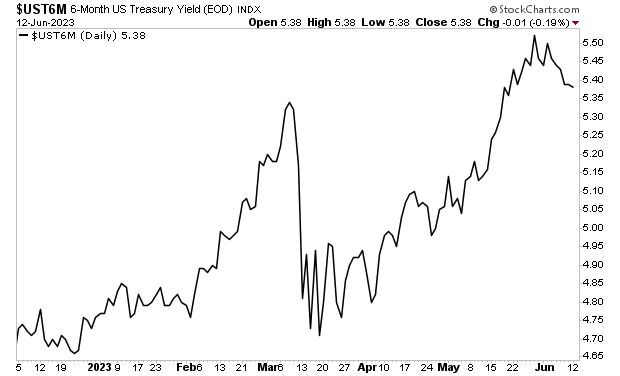
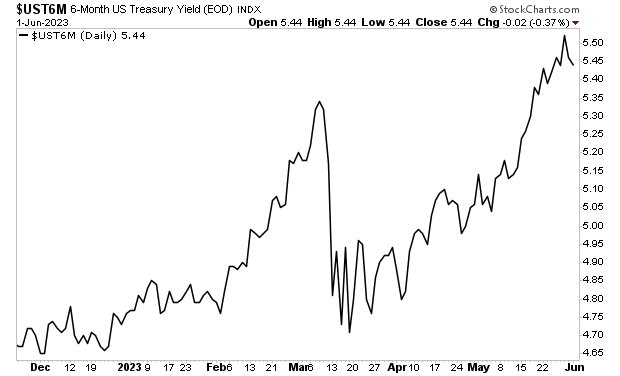
This is why the yield on the 6-month U.S. Treasury bill has soared to new highs…
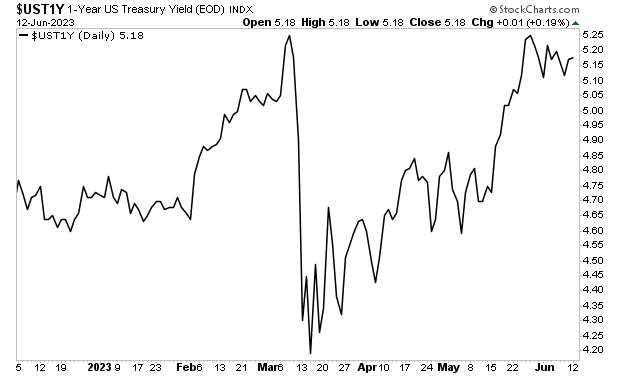
While the yield on the 1-Year U.S. Treasury is back at its former highs.
The above charts tell us the bond market is figuring out the Fed will need to raise rates higher and hold them there for much, MUCH longer. Three months ago, the Treasury market thought rates would be at 3.75% in two years. It is now suggesting rates will be 4.50% two years from now.
Anyone who believes the Fed will be easing monetary policy soon is mistaken. Between the Fed’s refusal to drain excess liquidity from the financial system and the Debt Deal normalizing the federal government’s pandemic levels of spending, inflation is going to become quite sticky, if not permanently embedded in the financial system.
There are many different ways to profit from this situation. We recently outlined a unique “of the radar” one favored by a family of billionaires in an investment report called Billionaire’s “Green Gold.”
Normally this report would be sold for $249. But we are making it FREE to anyone who joins our Daily Market Commentary Gains Pains & Capital.
There are two primary reasons why inflation has remained so persistent despite the Fed raising rates from 0.25% to 5.25% in the span of 14 months.
1) The Fed is using the wrong tools to end inflation.
2) The Federal Government continues COVID-19 emergency levels of spending.
Yesterday we discussed #1. Today we’re going to dissect #2.
Between 2020 and 2022, the Fed printed roughly $5 trillion. The Federal Government spent/ printed another $6 trillion.
Over the last 14 months, Fed has raised rated from 0.25% to 5.25% while draining $500 billion in liquidity from the financial system. In simple terms, the Fed has stopped printing money and is tightening monetary policy.
The Federal Government has not altered its money printing/ spending. In fact, courtesy of the Debt Deal that was just signed into law, the Federal Government has NORMALIZED the emergency levels of stimulus/ spending it introduced during the pandemic.
The government is financed via tax revenues. If spending is greater than tax revenues, then the government issues debt to finance its spending. Despite pulling in record taxes in 2021 (and 2022’s tax haul is looking to be ever greater), the U.S. continues to run $1+ trillion deficits.
Relative to GDP, the deficit is greater than that the government ran during the depths of the 2008 crisis. Indeed, you have to go back to World War II to find a period in which the deficit relative to GDP was greater! And bear in mind, the government is currently running this kind of deficit TWO YEARS after the recession associated with the shutdowns ended!
And thanks to the Debt Deal, this level of stimulus/ spending will become normalized.
Section 265 of the bill notes that the OMB (Office of Management and Budget) director has sole waiver authority to spend whatever money the government wishes if said spending is deemed “necessary for program delivery.” (H/T. Rep Nance Mace for catching this).
The OMB is the part of the Executive Branch in charge of “overseeing the implementation” of the President’s “vision” for the economy. The OMB director is appointed by the President. And according to the current version of the debt dealing congress is voting on, this person has “sole waiver” authority on spending caps.
Put simply, she (the current OMB director is Shalanda Young), is permitted to spend as much money as President Biden wants, provided the spending is deemed “necessary” to deliver on programs that meet his vision for the economy.
That single line negates any and all cuts or spending caps laid out elsewhere in the debt deal. It’s akin to someone writing “everything else in this 99-page bill is non-binding.”
In the very simplest of terms, this deal, if it passes, would normalize the government’s COVID-19 level of spending. This would be highly inflationary. And it would make the Fed’s job of tackling inflation that much more difficult.
This is why the yield on the 6-month U.S. Treasury bill has soared to new highs…
While the yield on the 1-Year U.S. Treasury is back at its former highs.
The above charts tell us the bond market is figuring out the Fed will need to raise rates higher and hold them there for much, MUCH longer. Three months ago, the Treasury market thought rates would be at 3.75% in two years. It is now suggesting rates will be 4.50% two years from now.
Anyone who believes the Fed will be easing monetary policy soon is mistaken. Between the Fed’s refusal to drain excess liquidity from the financial system and the Debt Deal normalizing the federal government’s pandemic levels of spending, inflation is going to become quite sticky, if not permanently embedded in the financial system.
There are many different ways to profit from this situation. We recently outlined a unique “of the radar” one favored by a family of billionaires in an investment report called Billionaire’s “Green Gold.”
Normally this report would be sold for $249. But we are making it FREE to anyone who joins our Daily Market Commentary Gains Pains & Capital.
There are two primary reasons why inflation has remained so persistent despite the Fed raising rates from 0.25% to 5.25% in the span of 14 months.
1) The Fed is using the wrong tools to end inflation.
2) The Federal Government continues COVID-19 emergency levels of spending.
Today we’re going to dissect #1.
The Fed is repeating the same mistake it initially made during the last major inflationary bout in the U.S. in the 1970s: focusing on rate hikes as opposed to draining excess reserves/ liquidity from the financial system.
During the first round of inflation from 1972-1975, the official inflation measure, the Consumer Price Index or CPI, rose from 3.3% to 11.1%. During this period, the Fed, chaired by Arthur Burns, attempted to rein in inflation using rate hikes. This succeeded in triggering a recession, but failed to end inflation: CPI only fell to 5.7% in 1976 before rebounding and eventually peaking at 13% in 1980.
Burns was replaced William Miller as Fed Chair in 1978, but Miller only lasted a year, as his efforts to end inflation proved similarly futile: the Fed raised rates from 6.75% to 10.5% during Miller’s tenure, but inflation continued to rise from 7.6% to 11.3%
It was only when Paul Volcker took the reins as Fed Chair in 1979 that things changed. Volcker shifted the Fed’s focus from rate hikes to draining excess reserves/ liquidity from the financial system. The goal was to remove the froth from the financial system, while letting rates move in a wider range in order to tighten policy to the point that inflation finally disappeared.
The effect was a severe recession (July 1981-November 1972), but CPI also came down, eventually falling to ~3% in 1983.
Fast forward to today, and the Fed repeating the same mistakes it made from 1972-1979. Thus far in its quest to end inflation, the Fed has raised rates from 0.25% to 5.25% in 14 months. It has also attempted to drain ~$500 billion liquidity from the financial system via its Quantitative Tightening (QT) program. CPI has dropped from 8.9% to ~5% where it stands today.
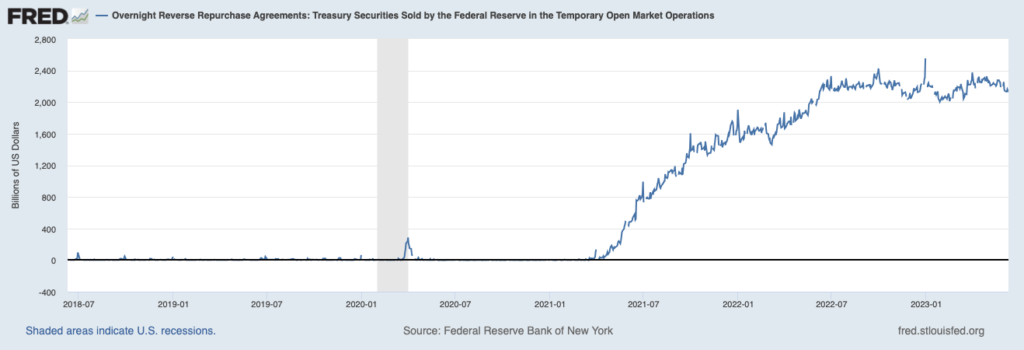
Meanwhile, the evidence is clear that there is still far too much liquidity/ froth in the financial system.
Banks continue to park over $2 TRILLION at the Fed every night via the overnight Reverse Repo Agreements. This is a very technical arrangement that isn’t worth delving into right now, but the primary point is that there is a LOT of excess money in the system.
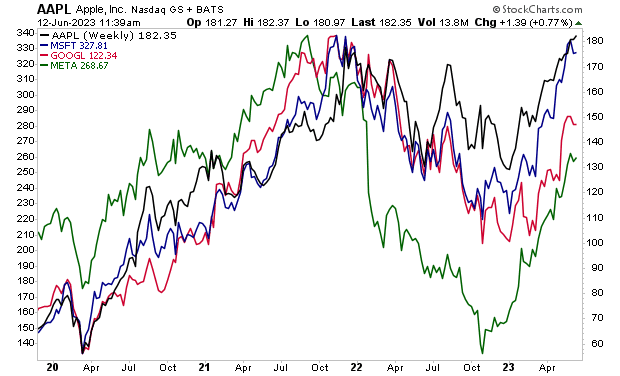
Other signs of excess froth concern the fact that several of the large tech companies are back at their all-time highs, despite the fact their underlying businesses have either gone ex-growth or growing at much slower rates.
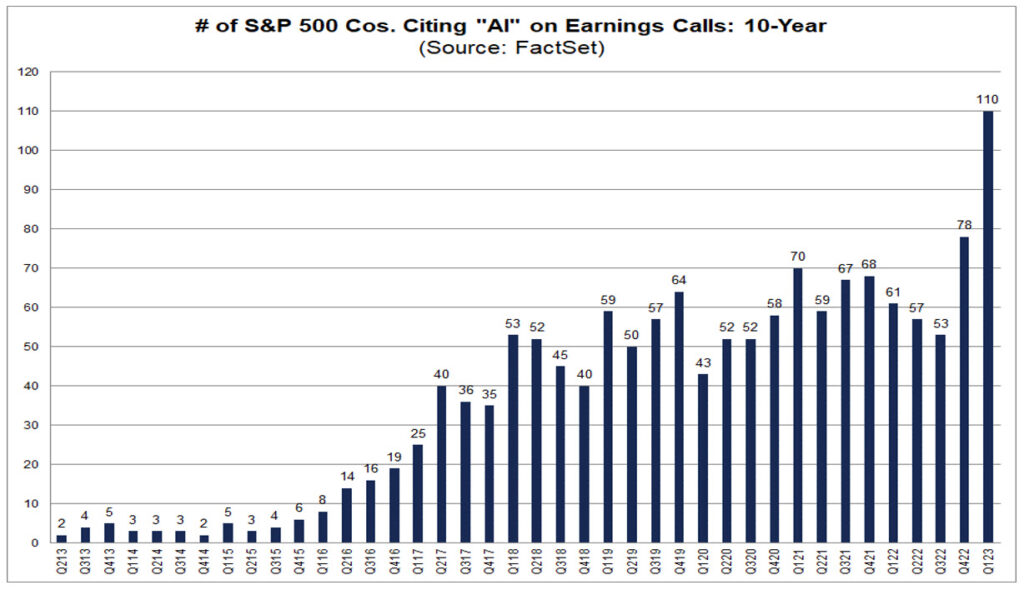
And of course, there is the Artificial Intelligence (AI) bubble.
Nvidia (NVDA), which is seen by the market as the primary beneficiary of A.I., has seen its market cap go from sub-$300 billion to over $1 trillion in six months… on annual revenues of $44 billion (annualized based on the company’s increase 2Q23 outlook). By way of comparison, Cisco (CSCO) which operates in a similar business as NVDA, already has annual revenues of $50+ billion, but trades at a market cap of $200 billion.
Companies are doing everything they can to align themselves with this mania, to the point of mentioning the term “AI” on earnings conference calls even if their businesses has little if any real exposure to the technology.
Source: Factset
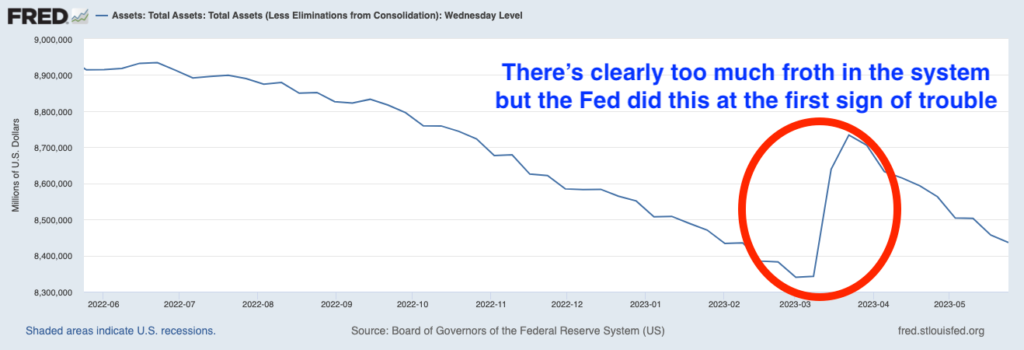
To summate the above examples, there are clear signs that there is much too much froth/ excess liquidity in the financial system today. And the Fed seems unaware of how to fix this. Case in point, during the regional banking issues of March 2023, the Fed pumped $400 billion into the financial system in the span of three weeks, thereby reversing roughly two thirds of its entire nine-month Quantitative Tightening (QT) efforts!
All of the above items indicate to me that the Fed is unlikely to succeed in its attempt to end inflation unless it dramatically increases QT and implements other measures to drain excess reserves/ liquidity.
To summate, the Fed is making the very same mistake it made in the 1970s: focusing on fighting inflation with rate hikes when there is clear evidence that the REAL issue is that there is too much money/ reserves in the financial system.
For more inflationary insights as well as a Special Investment Report that details how to profit from sticky inflation swing by:
The market rally in 2023 has been driven by tech, specifically, Big Tech (Apple, Microsoft, Nvidia, Alphabet, etc.).
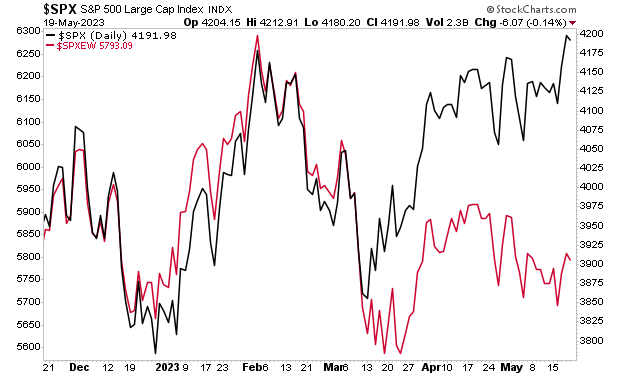
While a handful of large companies have driven the stock market gains, the vast majority of stocks are down. Take out the big tech players, and the S&P 500 would have lost money thus far in 2023, as opposed to rising 8%.
Many gurus are suggesting this divergence will resolve with a collapse for the stock market. But that’s not necessarily true. Yes, the big tech players could correct which would be negative for the overall market. But we could also see some of the lagging sectors and companies play “catch up.”
If that happens, then the market will hold up and possibly even rise to new highs.
So how do we assess this?
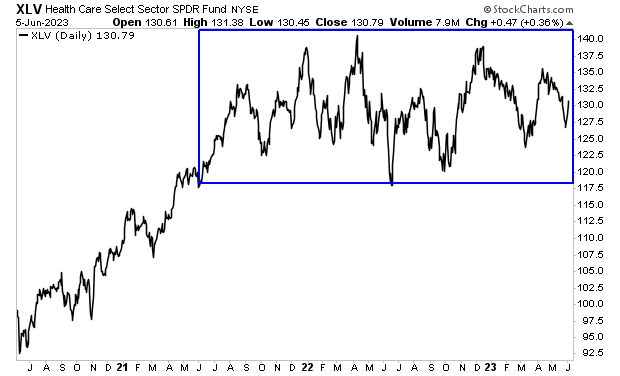
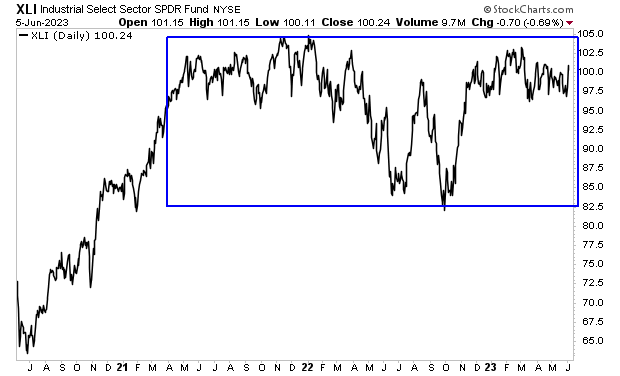
Personally, I’m watching two sectors: Healthcare (XLV) and Industrials (XLI).
Both of these sectors have been lagging big tech, but they’re consolidating or moving sideways as opposed to falling in value. So if they begin to rally, it will dramatically improve market breadth.
Healthcare (XLV) is the second heaviest weighted sector in the market with a weight of 13%. It’s been in a consolidation pattern since mid-2021. Which ever direction this sector finally breaks out will have a significant impact on the overall market.
Industrials (XLI) have a weight of 8% in the S&P 500. This sector, like healthcare, has been in a consolidation pattern for most of the last two years. A breakout to the upside would boost the market and improve the breadth of this rally significantly.
In the simplest of terms, if these sectors begin to participate, then this market rally will have legs and continue longer than most expect.
For more investment insights as well as several special reports outlining how to profit during a bear market, periods of high inflation, and more, swing by:
One of the biggest questions we hear from clients is “why aren’t stocks breaking down?”
The answer is simple: the government.
The Fed is fighting inflation. The government is NOT. The Fed is raising interest rates and engaging in Quantitative Tightening (QT). The government is running a $1+ trillion deficit. And this is in spite of a record tax haul.
In our current socialist version of America, this money is being funneled into the economy. And as a result of this, the economy continues to plod along despite inflation hanging around 5%.
It’s likely going to get worse from here.
Estimated federal outlays for 2023 are slated to be $6.3 TRILLION. That’s 23% of GDP. and the Debt Deal only increases this as it will remove ALL SPENDING CAPS for the Federal Government through 2025.
Uncle Sam isn’t the only one spending like there’s no tomorrow.
State, county and local governments are all spending loads of money. The 50 U.S. states have budgets of $1.2 trillion for FY 2023. That’s a 6.7% increase over that of 2022 which was an 18% increase over 2021. And by the way, that 18% increase in 2021 was the largest in history.
So… if you’re looking for a reason why the economy refuses to roll over… and why stocks continue to hold up… here’s your answer: because the U.S. government from the federal down to the local level is spending trillions and trillions of dollars.
All of this is HIGHLY inflationary. And the bond market knows it.
The yield on the 6-month U.S. Treasury recently hit new highs for this cycle. The impact this is going to have on every asset class will be profound.
On that note, we published a Special Investment Report concerning FIVE secret investments you can use to make inflation pay you as it rips through the financial system in the months ahead.Paragraph
The report is titled Survive the Inflationary Storm. And it explains in very simply terms how to make inflation PAY YOU.
I had initially thought
that the current debt ceiling deal would feature a small amount of spending cuts
in 2024. In reality, it will feature NO
CUTS and will in fact open the door to as much spending as the Biden Whitehouse
desires.
How is this
possible?
A single line in
the fine print from Section 265: The OMB director has sole waiver authority to
spend if it’s “necessary for program delivery.” (H/T. Rep Nance
Mace for catching this).
What does this
mean?
OMB stands for
Office of Management and Budget. This is the part of the Executive Branch in charge
of “overseeing the implementation” of the President’s “vision” for the economy.
The OMB director
is appointed by the President. And according to the current version of the debt
dealing congress is voting on, this person has “sole waiver” authority on spending
caps.
Put simply, she
(the current OMB director is Shalanda Young), is permitted to spend as much
money as President Biden wants, provided the spending is deemed “necessary” to
deliver on programs that meet his vision for the economy.
So much for
spending caps! This is the equivalent of handing a credit card to your 10-year-old
child and saying, “you can only spend $100… unless it’s for something you think
you need.”
We both know how
that would turn out.
The reality is that
this debt deal opens the door to a LOT more spending by the government, a mere 17-18
months before the next Presidential election. I’m sure the government will
become fiscally conservative between now and then. After all, they’ve only grown
the debt by $8 trillion since early 2020.
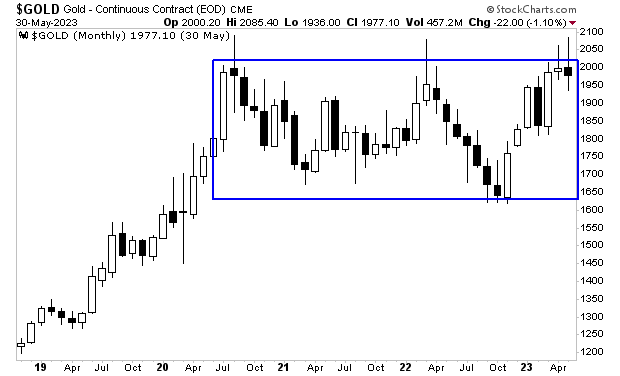
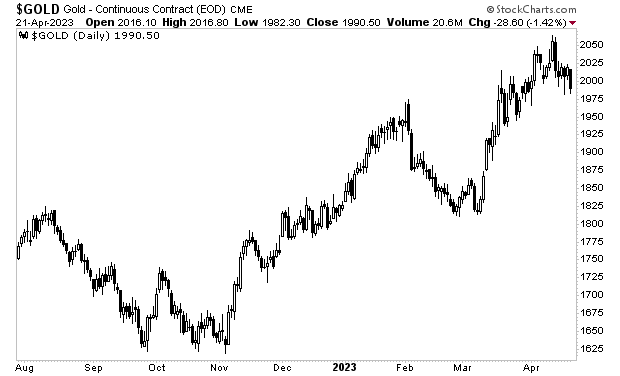
More and more the U.S. is beginning to look like an emerging market economy. Rampant spending, rampant corruption, and rampant inflation. Gold’s figured out what’s coming which is why it’s hanging around $2000 per ounce despite the Fed raising rates aggressively in the last 12 months.
Some investments will make fortunes from all this government spending/ inflation, others will absolutely implode.
On that note, we published a Special Investment Report concerning FIVE secret investments you can use to make inflation pay you as it rips through the financial system in the months ahead.Paragraph
The report is titled Survive the Inflationary Storm. And it explains in very simply terms how to make inflation PAY YOU.
As I first noted in my best-selling book The Everything Bubble: The Endgame For Central Bank Policy, “politicians make promises, but bond markets deliver.”
What I meant by this is that our entire political system is now consists of government overspending which is ultimately financed by the bond markets. As long as the bond markets remain stable, politicians will continue to spend and spend and spend.
And that is precisely what happened with the debt ceiling “resolution.”
We now live in a “one party” system that consists of Democrats, who like to spend trillions and trillions of dollars, and Republicans who like to sign off on 98% of Democrat spending, while arguing that doing so is a “win” for conservatives because the Democrats didn’t get 100% of what they proposed.
The latest Debt Ceiling “deal” is the latest example of this dynamic.
The Debt Ceiling deal features little if any spending cuts. Total federal spending will be reduced by about 0.2% of GDP in 2024. However, total spending then jumps 1% the next year (2025). And the debt ceiling is now suspended until 2025, which means we’ll likely tack on another $4 TRILLION in debt by then.
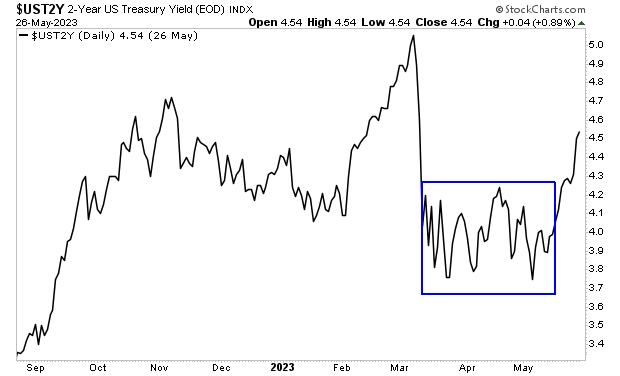
Inflation was already proving extremely sticky in some areas of the economy. We’re 15 months into one of the most aggressive monetary tightening cycles in history and CPI remains at 4.9% while Core PCE (the Fed’s favorite inflation measure) is at 4.7% and has been stuck there for FOUR MONTHS.
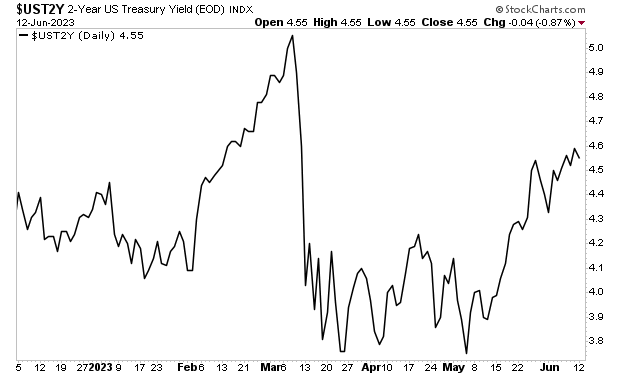
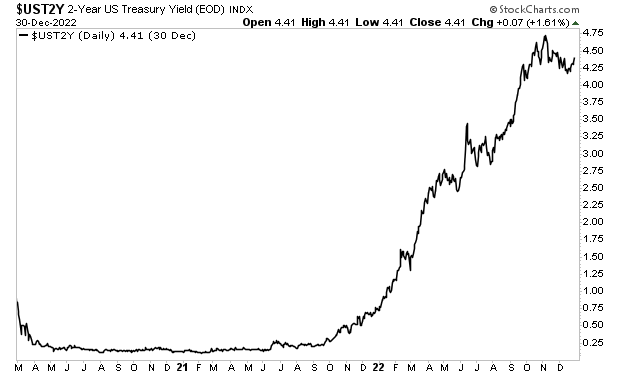
The fact the government will be permitted to continue running $1+ trillion deficits for the next 18 months will only make inflation even more embedded in the economy. The bond market knows this which is why bond yields are rising again.
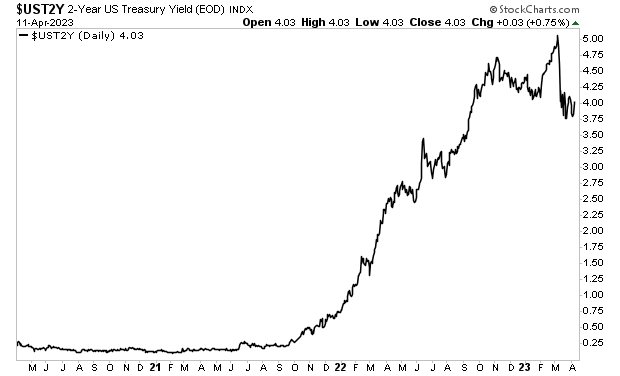
The yield on the 2-Year U.S Treasury has broken out to the upside after a three-month consolidation period. As I write this, it’s rapidly approaching its former highs.
Some investments will make fortunes from this, others will absolutely implode. This is an extremely volatile market and one that could make or break your portfolio.
On that note, we published a Special Investment Report concerning FIVE secret investments you can use to make inflation pay you as it rips through the financial system in the months ahead.Paragraph
The report is titled Survive the Inflationary Storm. And it explains in very simply terms how to make inflation PAY YOU.
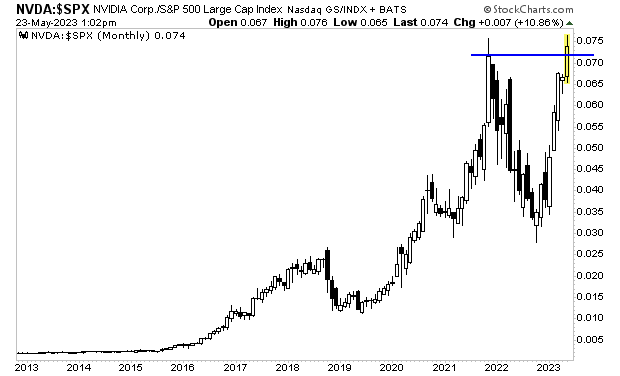
Yesterday I noted that the Artificial Intelligence (AI) bubble was still going strong, but that large players like Nvidia (NVDA) were probably “tapped out.”
At that time, I noted that the ratio between NVDA and the broader market has just hit a new all-time high. Now, regardless of how much AI really changes the world, do you think NVDA should be outperforming the S&P 500 even more than it did during the economic shutdowns when the Fed was pumping trillions of dollars into the financial system?
Seeing this I thought NVDA’s stock was probably close to a top of sorts. I mentioned that I wouldn’t be surprised for this chart to close out the month of May down from current levels, which means NVDA underperforms the broader market in the coming weeks.
NVDA reported results after the bell on Wednesday, and it completely SMASHED expectations to the upside. The stock EXPLODED higher by 27% in the after hours.
Yes, a $750+ billion company is up 27% in a single day,
This is the thing about bubbles, they can last longer and go much further than anyone believes. NVDA stock which was already up over 100% this year is now exploding even higher. How high will it go? To a market cap of $1 trillion? $2 trillion?
I have no idea.
This is why George Soros always argued you should “buy a bubble” as soon as you recognize it. Bubbles, like all manias, can exceed even your wildest expectations.
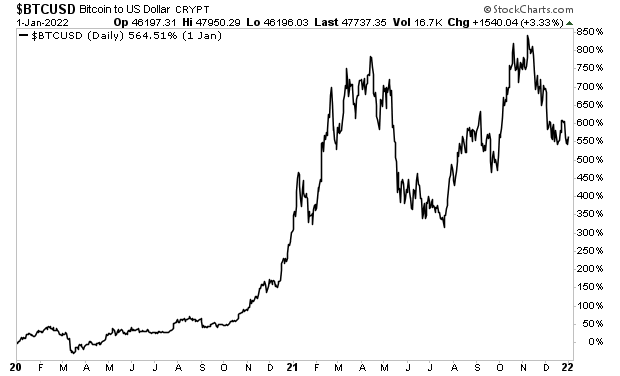
The crypto currency bubble of 2020-2022 lasted between 6 and 12 months depending on how you measure it. It saw Bitcoin (BTC) rise 600%…
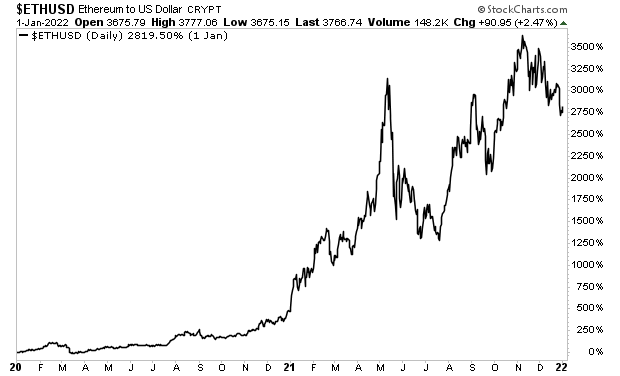
… while smaller crypto currencies like Ethereum rose 3000%!
If the AI bubble began in late 2022/ early 2023, we are probably about halfway through this situation (see NVDA’s results yesterday).
Does this bubble defy reason and logic? Yes. But traders and speculators aren’t looking for reason… they are looking for profits!
And right now, AI is where the biggest profits lie.
Societe General has noted that AI-associated stocks account for ALL of the gains in the broader stock market this year. Put another way, without the influence of AI as an investment theme, the S&P 500 would be DOWN this year.
So if you feel like you’ve “missed the boat” in AI, do not be alarmed. These things take much longer and go much farther than anyone ever believes!
On that note, we are putting together an Executive Summary outlining the real impact of AI as well as which companies are best positioned to profit from this major trend when the froth is taken out of the market.
It will be available exclusively to our clients. If you’d like to have a copy delivered to your inbox when it’s completed next week, you can join the wait-list here.
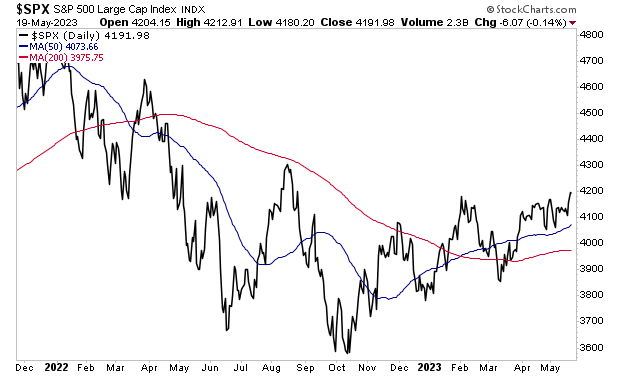
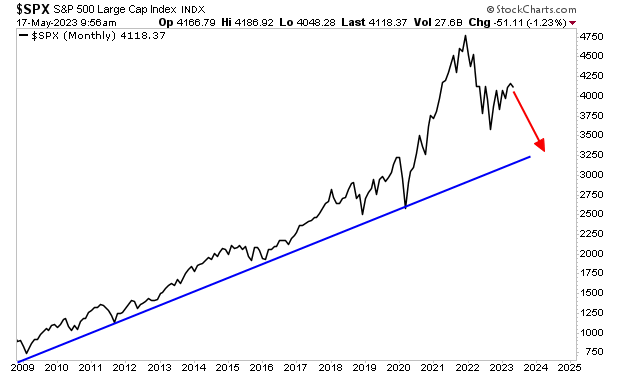
The S&P 500 has managed to start turning its 200-day moving average (DMA) upwards. This is a significant development is at it indicates that the intermediate to long-term trend is on the verge of becoming “up.”
As positive as this seems, beneath the surface of the markets there are a lot of glaring divergences developing.
Divergences occur when two assets that typically trade in line with each other start to diverge. These kinds of developments tell us that something unusual is happening in the market. Sometimes it’s not a bit deal. Other times, like in late 2007 or just before the shut-downs in 2020, these divergences serve as a warning that a crash or black swan event is about to hit.
On that note, let’s consider some of the more glaring divergences taking place today.
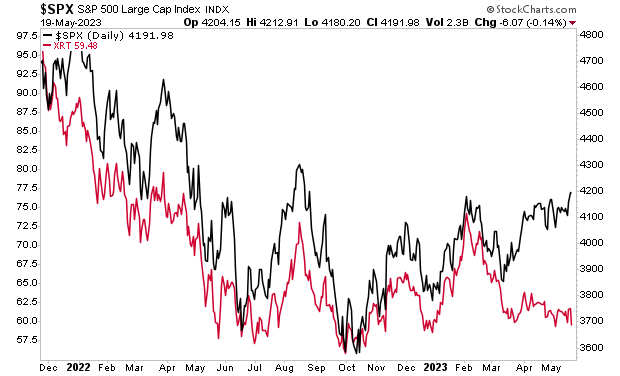
The Retail ETF (XRT) tracks the performance of 90 retailers in the U.S. As such it serves as a decent proxy for the consumer. And XRT has NOT participated in this rally at all. In fact, it’s rapidly approaching its October 2022 lows.
There are other, similar divergences all over the markets.
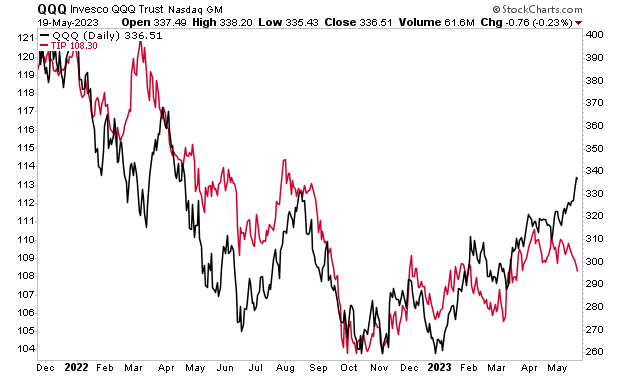
Tech stocks usually trade in line with inflation-adjusted Treasuries. The reason for this is that Tech is priced based on where “real,” or inflation adjusted, Treasury yields are trading. When yields are relatively low, investors pile into tech because it is a high growth sector.
With that in mind, there is a large divergence between tech stocks and inflation-adjusted Treasuries today. Someone is “wrong” here.
These are just two examples of major divergences, but there are literally over a dozen happening in the stock market right now. Something is very, very “off” about this market rally in stocks.
And I think I know what it is.
What’s happening is that the overall market is being pushed higher by a handful of large tech companies. Because these companies account for nearly 25% of the S&P 500’s overall weight, their outperformance is forcing the overall market to move higher despite all these divergences.
Indeed, when we strip out the effect of these companies with an “equal weight” stock market index, this dynamic becomes clear. MOST of the companies in the S&P 500 are down. Only a small handful are up. They just happen to be the largest companies both in terms of size and in terms of index weighting.
How will this play out?
Sometimes divergences resolve with the trailing assets playing “catch up.” However, when there are so many divergences occurring across so many different areas of the market, this is unlikely.
What’s far more likely is that the markets nose-dive in the near future. Many analysts will tell you “ no one saw this coming!” but now you know better.
For those looking to prepare
and profit from this mess, our Stock Market Crash Survival
Guide can show you how.
Within its 21
pages we outline which investments will perform best during a market meltdown
as well as how to take out “Crash
insurance” on your portfolio (these
instruments returned TRIPLE digit gains during 2008).
To pick up
your copy of this report, FREE, swing by:
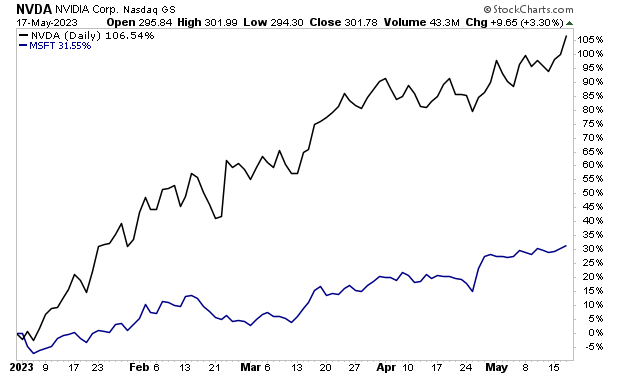
Artificial Intelligence (A)I is the current major them for the markets. With economically related companies (TGT, X, etc) showing lower returns, investors are piling into AI as the next major source of growth for corporate top lines (revenues) and profit margins (presumably AI will replace many employees which will lower operating costs).
As far as market price action is concerned, anything associated with AI is in a strong uptrend. The most notable example is Nvidia (NVDA) which has more than doubled year to date. Even the multi-trillion dollar market cap giant Microsoft (MSFT) has caught a bid due to its exposure to AI. MSFT is up 30% year to date.
AI is THE market mover for 2023. Societe General has noted that AI-associated stocks account for ALL of the gains in the broader stock market this year. Put another way, without the influence of AI as an investment theme, the S&P 500 would be DOWN this year.
Indeed, things are becoming so frothy as far as AI is concerned that executives are mentioning AI as frequently as possible during earnings calls… even if their company has little if any exposure to the new technology!
What does this all mean?
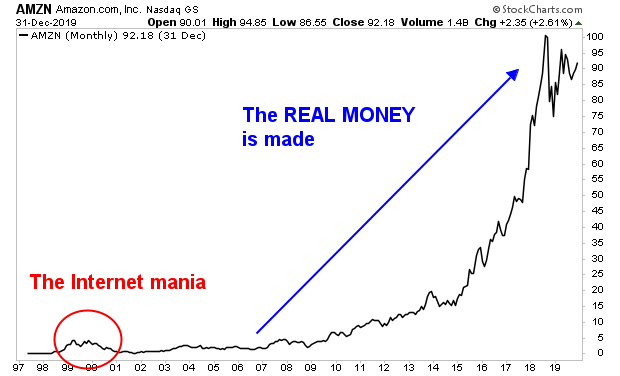
AI is yet another “game changer” technology being touted by Wall Street. It, like the internet in the ‘90s, the “cloud” in the mid 2010s, and even crypto in the last five years is a novel item, the impact of which is difficult to quantify. We are currently in the “froth” stage in which everyone is manic about this idea. The REAL money will appear when the key players who will go on to dominate this trend emerge.
Consider what happened with the internet bubble in the 1990s.
At that time, anything associated with e-commerce or internet exposure exploded higher. However, the REAL money came in the years AFTER the bubble burst as Amazon (AMZN), and other internet market leaders emerged.
See for yourself.
So if you feel like you’ve “missed the boat” in AI, do not be alarmed. This is the mania phase: the phase in which everyone is trying to align themselves with a trend in order to score some easy price appreciation.
The REAL money will appear when this passes and the true market leaders in AI emerge. And we are currently positioning our clients to profit from it.
On that note, we are putting together an Executive Summary outlining the real impact of AI as well as which companies are best positioned to profit from this major trend when the froth is taken out of the market.
It will be
available exclusively
to our clients. If you’d like to have a copy delivered to your inbox when it’s
completed, you can join the wait-list here.
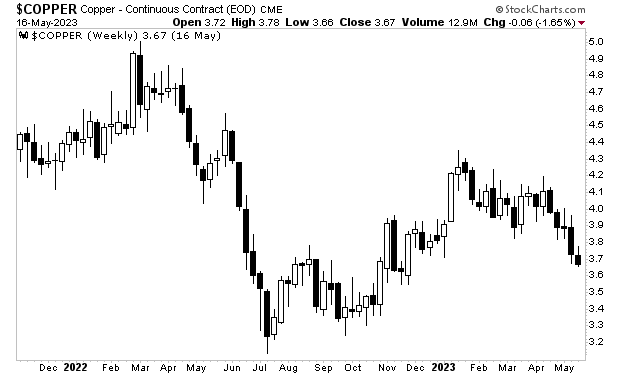
Copper, the commodity
with a PhD in economics, has erased all of its year to date gains. It’s
currently about 10% off its 2022 lows which marked the low for risk assets
before this current bear market rally began.
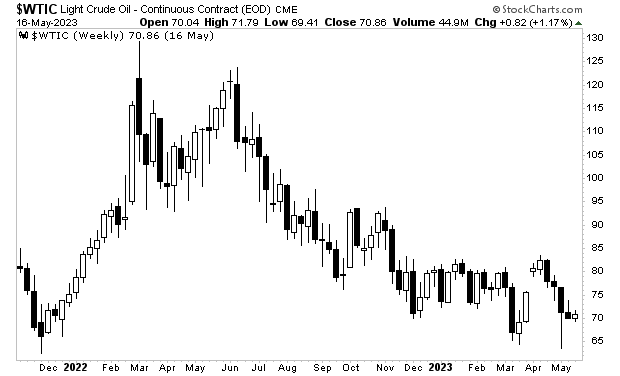
It’s a similar story
for oil, which is just slightly off its 2023 lows and down 46% from its 2022
highs.
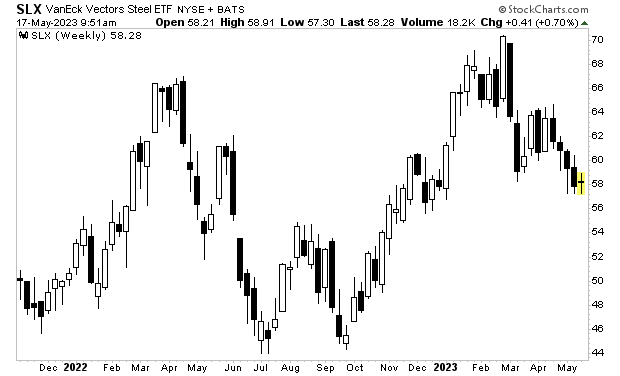
Steel doesn’t look good trading at new lows for 2023.
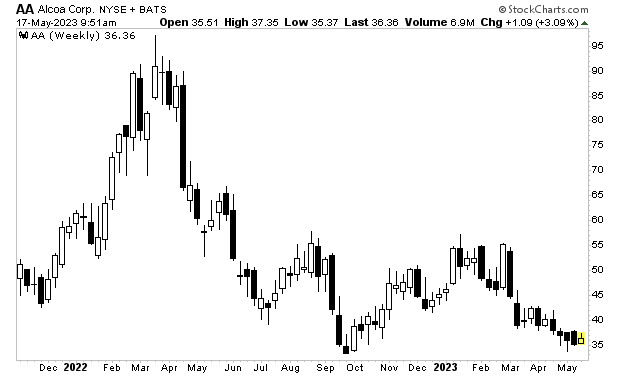
Ditto for aluminum.
As well as lumber.
Is this demand
destruction? Or is it the result of the Fed tightening monetary policy and
taking out some of the froth from the financial system?
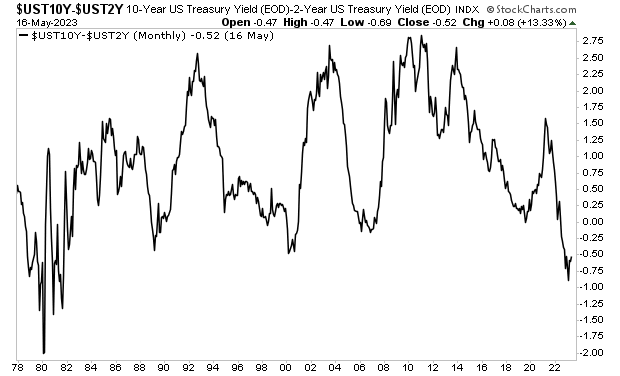
The bond market
suggests its demand destruction. The 2s10s, which has predicted every recession
since 1955 is suggesting a severe recession is coming.
What do you think this
will do to stocks?
If you’ve yet to take steps to prepare
for what’s coming courtesy of the banking crisis, we have published an
exclusive special report How to Invest During This Bear Market.
It details the #1 investment to own
during the bear market as well as how to invest to potentially generate life
changing wealth.
This report is usually $250, but we’re
giving away 100 copies for FREE to those who sign up for our free daily market
commentary.
Today is the last day this report is
available to the general public.
To pick up one of the remaining copies,
use the link below…
You no doubt have some concerns about the bank at which you keep your deposits.
I mean, why wouldn’t you? Three of the largest bank failures in U.S. history have already taken place this year. And by the look of things, there are even more to come.
So today we’re going to do a quick break down of how to analyze a bank to see if it’s in trouble. This is NOT meant to be an exhaustive lesson on accounting, but simply a decent rule of thumb to help you figure out if a bank is in serious trouble as far as its bond portfolio is concerned.
As I’ve already outlined earlier this week, 2022 was the worst year on record for long-term Treasury bonds. This has been a huge problem for banks which own hundreds of billions, if not trillions of dollars’ worth of long-duration bonds and loans that move based on what happened with Treasuries. Unless the banks hedged this risk, they are likely sitting on substantial losses in their long-duration portfolios.
Now, by law, every bank has to report the losses or gains on many of the assets it owns. These are recorded as “unrealized” gains or losses in the case of the assets that the bank still owns/ has yet to sell.
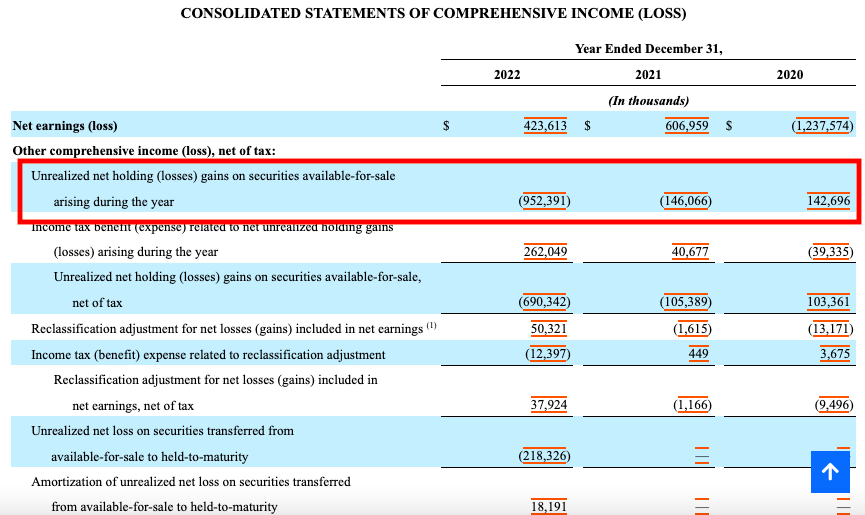
See for yourself.
Below is a screenshot from the income statement of a bank. As you can see, the total amount of unrealized losses ballooned in 2022, likely as a result of these assets dropping in value when the bond market collapsed. As of year-end 2022, this bank is sitting on $952 million worth of unrealized losses.
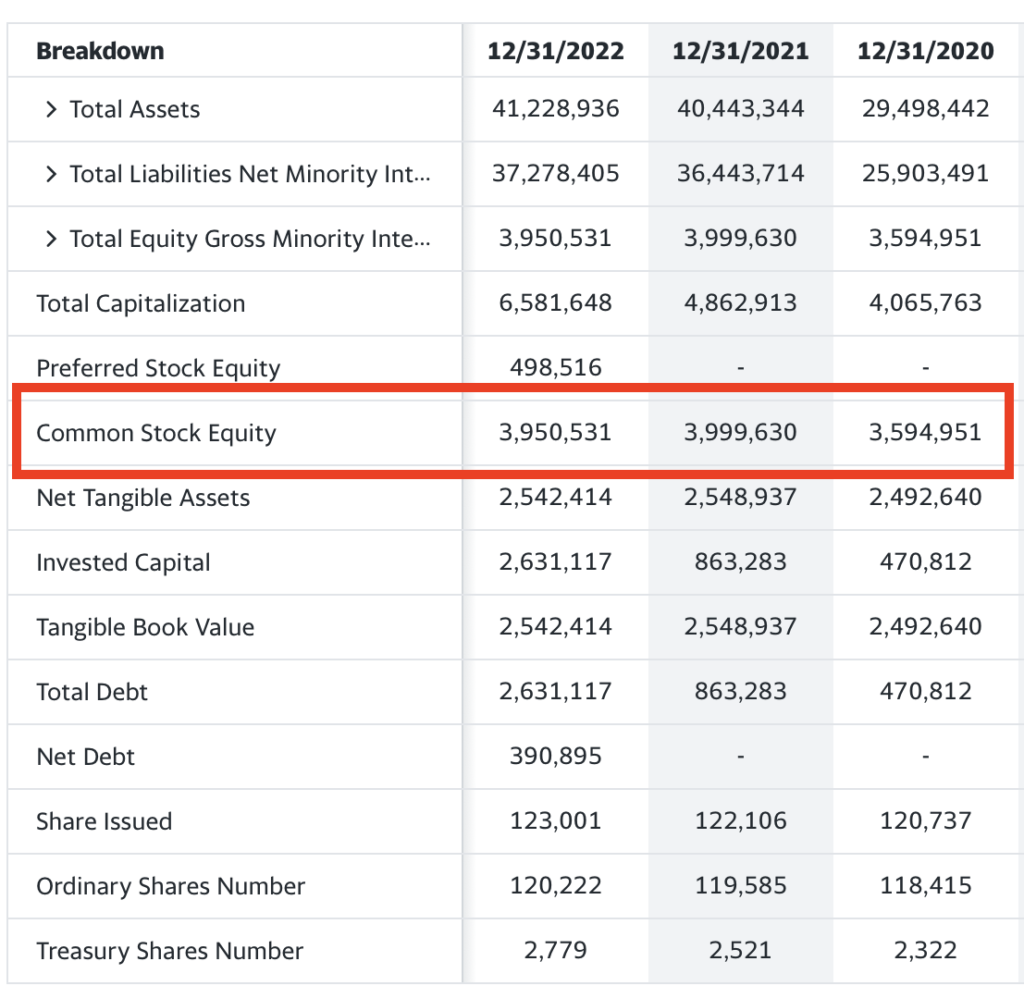
Now, that sounds like a lot of money in “unrealized losses,” but everything is relative. So to see if this is a major issue we need to assess that number against the bank’s shareholder equity (the stock owners).
In this particular instance, the bank in question has shareholder equity of $3.9 billion. So put another way, this bank is sitting on unrealized losses equal to 25% of shareholder equity. That’s a pretty big deal, which would suggest this bank could find itself in trouble.
All of this information can be found on the SEC’s website. Simply go there, type in the symbol for your bank, then go to its annual or quarterly financial statements (the 10-K or 10-Q). You can even do a “search” function in those files for the terms “unrealized losses” or “shareholder equity” to find the specific parts you need to see.
I hope this helps!
If you’ve yet to take steps to prepare for what’s coming courtesy of the banking crisis, we have published an exclusive special report How to Invest During This Bear Market.
It details the #1 investment to own during the bear market as well as how to invest to potentially generate life changing wealth.
This report is usually $250, but we’re giving away 100 copies for FREE to those who sign up for our free daily market commentary.
Today is the last day this report is available to the general public.
To pick up one of the remaining copies, use the link below…
Thus far in 2023, there have been three major bank failures. And I do mean MAJOR: all told the three banks had $532 billion in assets. That amount is actually greater in size that the combined assets of the 25 banks that failed in 2008.
What is going on here?
What is going on is that the Fed created this mess… and bad risk management at the banks has exacerbated it.
Let me explain.
Traditionally, banks make money as follows:
1) You deposit your money at the bank.
2) The bank pays you a low interest rate on this deposit.
3) The bank turns around and loans out $5, $7, even $10 in loans for every $1 you deposited. The bank charges a much higher rate of interest on these loans than the interest rate it pays you on your deposit.
4) Alternatively, the bank buys $5, $7, or even $10 in long-duration assets (Treasuries, or other long-term bonds) for every $1 you deposited.
5) The bank pockets the spread between the interest it earns on its loans/ bonds and the interest rate is pays you on your deposits.
This situation works well provided the Fed keeps interest rates low. Unfortunately for the banks, the Fed unleashed inflation by printing ~$5 TRILLION between 2020 and 2022.
Bond yields trade based on many things… including inflation. And once inflation entered the financial system, Treasury yields ripped higher.
When Treasury yields rise, bond prices FALL. And who was sitting on trillions of dollars’ worth of long-term Treasuries and loans that traded based on long-term Treasuries?
You guessed it… the regional banks.
Courtesy of the Fed’s idiocy, the banks were destined to be sitting on hundreds of billions of dollars worth of losses on these assets.
But it gets worse.
Once the Fed finally decided to get off its rear and do something about inflation, it embarked on its most aggressive rate hike cycle in history, raising rates from 0.25% to 5% in the span of a single year.
Why does this matter?
Remember how banks pay you a low interest rate on your deposit? Well who is going to want to keep his or her money in a bank that pays 0.3% at best… when he or she can earn 4% or even 5% in a money market fund or short-term Treasury bond, courtesy of the Fed raising rates so high so fast ?
And so, depositors began pulling their money from banks… and not by a little: 2022 was the first year since 1945 in which money on a NET BASIS left the banking system in the U.S.
But hang on… remember how the bank loaned out or bought $5, $7, or even $10 worth of loans or long-term assets based on every $1 you deposited in the bank? Well when you pull your money out of the bank, the bank has to unload all that stuff to maintain its capital requirements.
And so, the Fed delivered the ultimate 1-2 punch to the U.S. regional banking system.
The first punch was it ignored inflation to the point that the banks were sitting on hundreds of billions of dollars’ worth of losses.
However, the KO punch was the Fed raised rates aggressively, which resulted in depositors pulling money out of the banks in search of higher returns on their cash.
Now, don’t get me wrong. The banks are partially to blame for the fact that didn’t act once the Fed announced it would be raising rates to end inflation. With proper risk management (bond hedges for instance) these banks would have been better prepared for the bond market massacre of 2022.
However, even careful risk management would have done nothing to help these banks once depositors started pulling their money out. And no bank could raise its deposit rates to 4% or 5% to compete with money market funds or short-term Treasuries while staying in business.
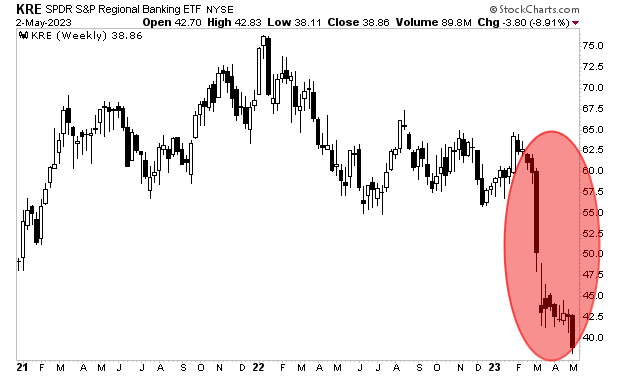
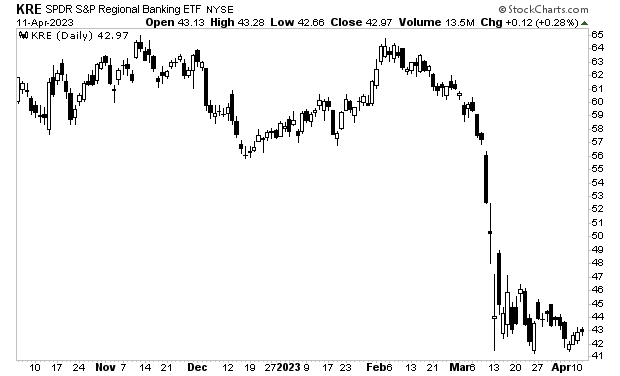
And so we get this: a situation in which MAJOR regional banks are going bust and the regional bank ETF has lost a third of its value in the span of six weeks.
This situation is nowhere near over. According to some analysis, HALF of the U.S.’s banks are currently insolvent.
The clock is ticking here. Ignore trader games, something BAD is coming to the markets.
If you’ve yet to take steps to prepare for what’s coming, we have published an exclusive special report How to Invest During This Bear Market.
It details the #1 investment to own during the bear market as well as how to invest to potentially generate life changing wealth.
This report is usually $250, but we’re giving away 100 copies for FREE to those who sign up for our free daily market commentary.
As I write this, there are less than 19 left.
To pick up one of the remaining copies, use the link below…
First and foremost, it’s significantly higher than expectations: 3.5% vs 3.2%.
Secondly, it shows that inflation is turning back upwards in Japan. Last month’s inflation data was 3.2% which was down from the prior month’s 3.3% which was down from the prior month’s 4.3%.
Put simply, after trending down for three months, inflation is turning back upwards in Japan.
And finally… Japan remains the last central bank that is still easing monetary conditions.
The Fed is aggressively tightening monetary conditions. So is the European Central Bank as well as the Bank of England. Only the Bank of Japan remains engaged in Quantitative Easing.
With inflation coming in hot in Japan, the Bank of Japan will soon be forced to end its money printing. Which means the financial system would lose its last and final source of excess liquidity.
Put another way, the great monetary easing from 2020-2023 would completely over. Every major central bank would be tightening. Liquidity would be exiting the system at an even more rapid clip.
What do you think this would do to stocks?
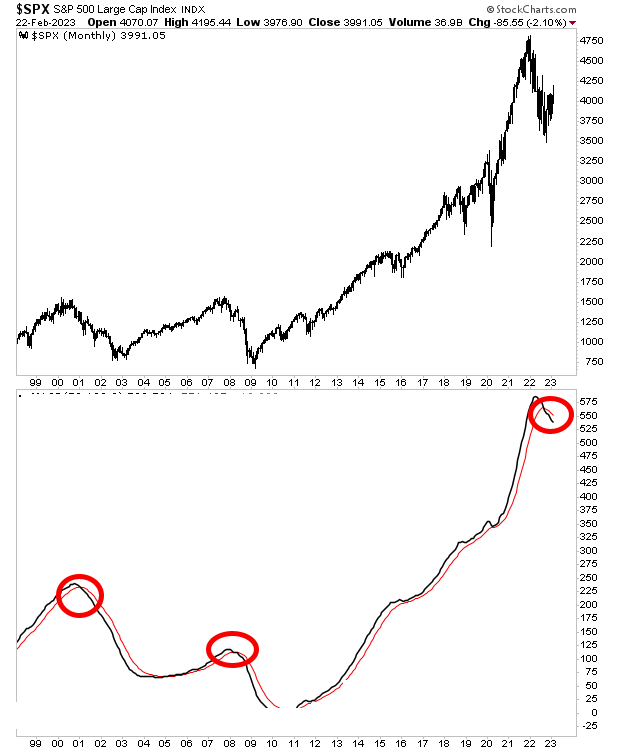
My proprietary crash trigger knows. It just triggered its 3rd confirmed “SELL” signal in 25 years.
The last two time sit signaled?
2000 and 2008.
If you’ve yet to take steps to prepare for what’s coming, we have published an exclusive special report How to Invest During This Bear Market.
It details the #1 investment to own during the bear market as well as how to invest to potentially generate life changing wealth.
This report is usually $250, but we’re giving away 100 copies for FREE to those who sign up for our free daily market commentary.
As I write this, there are less than 30 left.
To pick up one of the remaining copies, use the link below…
Warren Buffett is arguably the greatest investor of all time.
Unlike many of the super wealthy that existed before him (Rockefeller, Morgan, Vanderbilt, Dupont) Buffett wasn’t an entrepreneur who built an oil, steel, banking, or railroad empire. Instead, Buffett was an investor, who allocated capital in such a way that his holding company Berkshire Hathaway, grew to be one of the 10 largest companies on the S&P 500.
Buffett himself grew to be worth over $100 billion in the process.
Put simply, this is a man who got unbelievably rich from the markets. So when Warren Buffet speaks on the subject of stocks, it’s a good idea to listen.
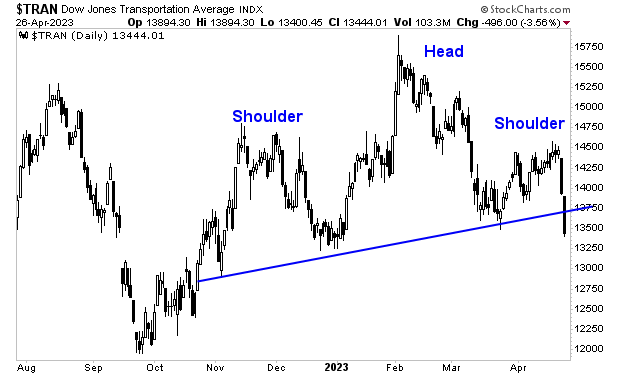
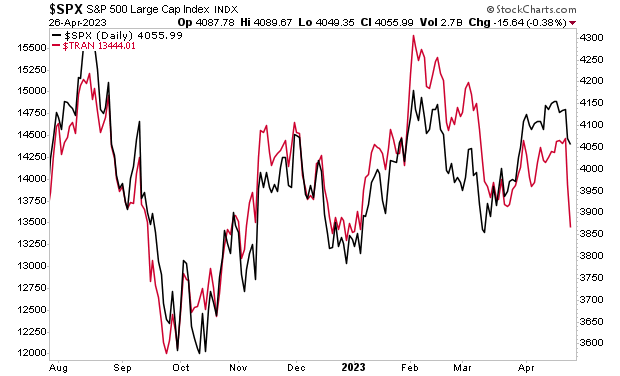
One of Buffett’s best known quotes concerning the markets is that “trannies don’t lie,” meaning that the Dow Jones Transportation Index, which is comprised of companies associated with transportation in the real economy is one of the most accurate economic bellwethers out there.
Put simply, whatever the Dow Jones Transportation Index does, is a solid indicator of what’s happening in the economy.
I mention this because the Transportation index has just broken down from a clear Head and Shoulders topping pattern. This suggests the economy is rolling over in a significant manner.
Now take a look at the Transportation index (red line) overlaid with the broader market as represented by the S&P 500 (black line) in the chart below. The implication concerning the economy is clear. But the S&P 500 has yet to “get it.”
Indeed, in the Big Picture, my proprietary Crash Trigger is now on the first confirmed “Sell” signal since 2008.
This signal has only registered THREE times in the last 25 years: in 2000, 2008 and today.
If you’ve yet to take steps to prepare for what’s coming, we have published an exclusive special report How to Invest During This Bear Market.
It details the #1 investment to own during the bear market as well as how to invest to potentially generate life changing wealth.
This report is usually $250, but we’re giving away 100 copies for FREE to those who sign up for our free daily market commentary.
As I write this, there are less than 40 left.
To pick up one of the remaining copies, use the link below…
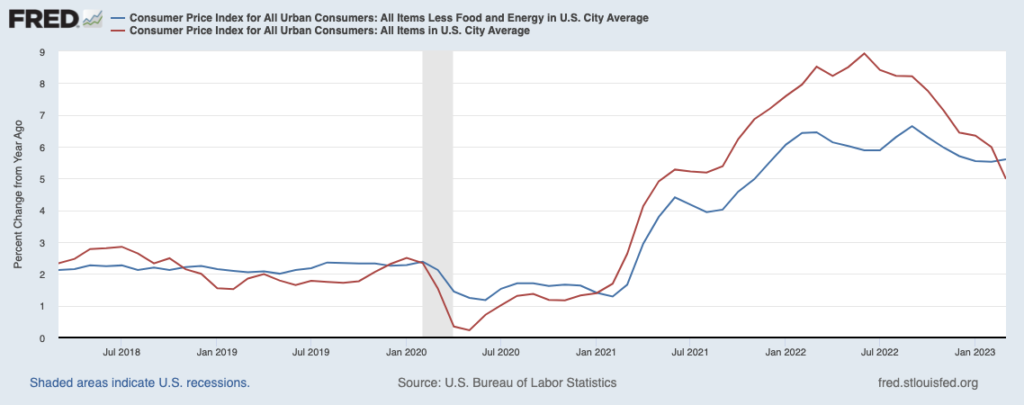
You can forget about what the media is telling you…because REAL inflation has come down much at all.
The media likes to trumpet that headline inflation has dropped in the U.S. from a peak of ~9% down to ~6%. However, as I’ve noted time and again, the ONLY reason headline inflation has dropped this much is due to energy prices falling. And the primary reason energy prices have fallen is because the Biden Administration has dumped over 150 MILLION barrels of oil in the last 12 months pushing oil down from $130 a barrel to $70 a barrel.
Core inflation, which removes the effect of energy and food, presents a much clearer picture of underlying inflation without the impact of these political shenanigans. And the situation for core inflation (blue line) doesn’t look NEARLY as promising as headline inflation (red line) as the below chart illustrates.
As you can see, core inflation has barely dropped much if at all. And it’s now in the process of turning back up!
And bear in mind, this is after the Fed performed its most aggressive 12 month monetary tightening in history, raising rates from 0.25% to 5%!
So what do you think will happen to inflation now that the Fed is beginning to talk about pausing its rate hikes?
Gold has figured it out. The rest of the market will soon as well!
On that note, we published a Special Investment Report concerning FIVE secret investments you can use to make inflation pay you as it rips through the financial system in the months ahead.
The
report is titled Survive the Inflationary Storm. And it
explains in very simply terms how to make inflation PAY YOU.
We are making just 100 copies available to the public.
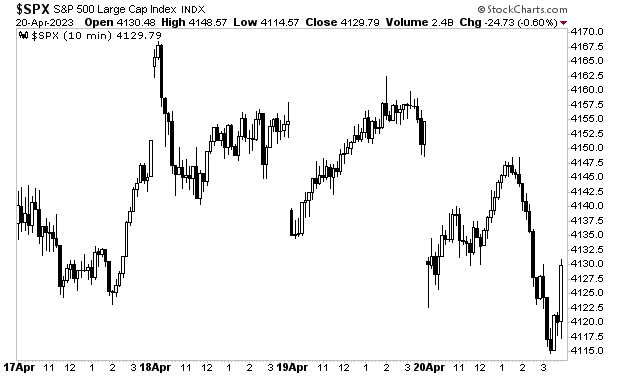
It’s earnings season and options expiration week for the month of April.
Both of those items have historically been extremely bullish: stocks almost always rally into earnings and options expiration week is the week of for Wall Street to gun the markets higher.
And yet… the stock market is doing this.
When a pattern that has a lot of historical precedent stops working… it can indicate a serious shift is taking place under the surface of the markets.
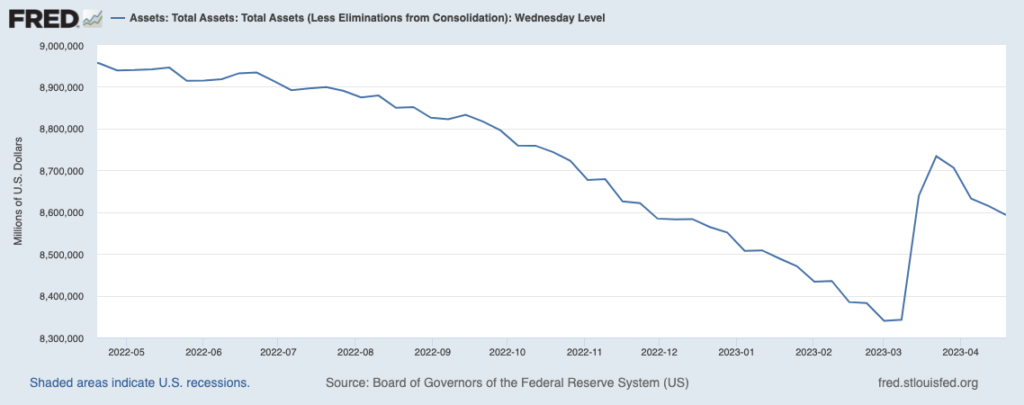
I would also note that the Fed’s balance sheet has rolled over, indicating that the Fed is withdrawing liquidity from the system again.
While Bitcoin and other liquidity plays are beginning to roll over as well.
All of this suggests the next leg down for the markets is just around the corner.
If you’ve yet to take steps to prepare for what’s coming, we just published a new exclusive special report How to Invest During This Bear Market.
It details the #1 investment to own during the bear market as well as how to invest to potentially generate life changing wealth when it ends.
We made just 100 copies available to the general public.
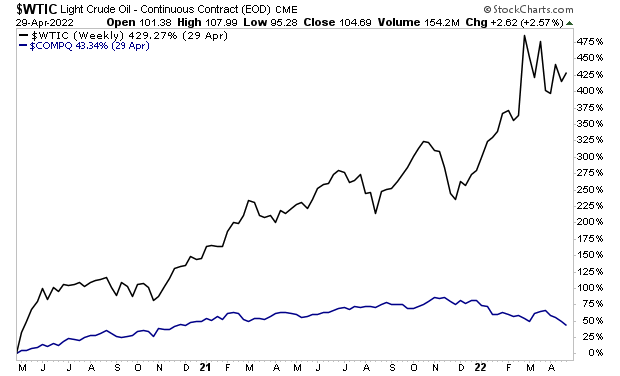
The first round focused on energy prices. Oil rose from $10 a barrel at the 2020 lows to $130 per barrel at the 2022 highs. You may find this hard to believe, but oil (black line) actually outperformed tech stocks by such a wide margin that the NASDAQ ‘s (blue line) performance looks pathetic in comparison!
During major bull markets in commodities, the sector that leads during the first leg up rarely leads during subsequent moves higher. Which is why this leg up for the inflation trade looks to be lead by precious metals.
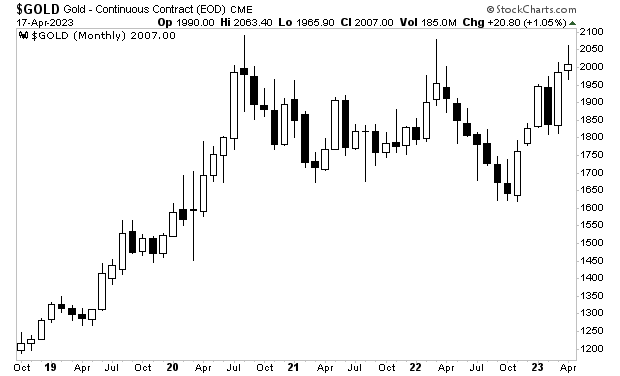
As I write this, gold is closing in on its ALL TIME highs. Yes, ALL TIME highs. And practically no one has noticed or cares.
In the simplest of terms, we are getting multiple signals that the inflation trade is about to hit again. Smart investors are already taking steps to profit from it.
On that note, we published a Special Investment Report concerning FIVE secret investments you can use to make inflation pay you as it rips through the financial system in the months ahead.
The
report is titled Survive the Inflationary Storm. And it
explains in very simply terms how to make inflation PAY YOU.
We are making just 100 copies available to the public.
The commercial real estate market in the U.S. is about $20 trillion in size. This is not a small asset class. And thanks to the pandemic changing work habits, the Fed creating a massive credit bubble, and many cities going soft on crime, the collapse of commercial real estate may very well be the next black swan event.
In its simplest rendering, the problems facing commercial real estate are as follows:
1) People do NOT want to return to the office, even if the pandemic is over.
2) Valuations/ prices in the market have been badly distorted by the Fed, both indirectly via the massive credit bubble the Fed created in 2020-2022, and directly by the Fed offering to buy commercial mortgage backed securities (the last point put a floor beneath this market).
3) Many large cities have decided to go soft on crime, resulting in criminal activity skyrocketing. As a result of this and heavy tax burdens, large businesses are moving out of places like Chicago, New York and the like.
It’s literally a perfect storm for the commercial real estate sector.
Oh… and lest we forget, much of this asset class is financed by trillions of dollars worth of debt. And that debt is now coming due.
The New York Post notes that $1.5 trillion worth of commercial real estate debt comes due by the end of 2025. Bear in mind, rates have done this since much of this debt was issued:
So commercial real estate firms will either need to pay this back (hard to imagine given office vacancies) or roll the debt over at much higher interest rates.
And last but not least… guess who loaned out all this debt to commercial real estate developers and landlords?
REGIONAL BANKS.
Perhaps this is why the regional banking sector can’t rally despite the Fed gifting them hundreds of billions of dollars worth of cheap credit over the last month.
What does this mean?
A $20 trillion asset class is fast approaching its “2008” moment.
Indeed, our proprietary Crash signal has just triggered its 3rd confirmed signal in the last 25 years. The last two times it signalled?
2000 and 2008.
If you’ve yet to take steps to prepare for what’s coming, we just published a new exclusive special report How to Invest During This Bear Market.
It details the #1 investment to own during the bear market as well as how to invest to potentially generate life changing wealth when it ends.