Anyone who continues to claim the Consumer Price Index (CPI) actually measures REAL inflation is in abject denial.
In May of this year, the BLS managed to claim that CPI only rose a measly 0.2% due to the fact that used car prices and airfares dropped. Yes, the BLS used the drop in those two items to negate the sharp rise in healthcare expenses, energy prices, housing prices, and even food prices.
The BLS was at it again in the most recent CPI, this time using a RECORD drop in HOTEL COSTS to insure that inflation rose only 0.1% in June.
What makes this spectacularly ludicrous is the fact that the Fed’s “in-house” inflation measure, the Underlying Inflation Gauge (UIG), shows REAL inflation is well over 3%.
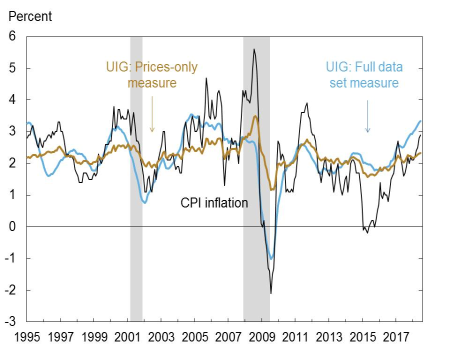
The UIG now has inflation at 3.3%.
Why does this matter?
Because bond yields trade based on inflation. If inflation is soaring higher, bond yields will also rise to accommodate this.
If bond yields RISE, bond prices DROP.
And if bond prices DROP enough, the Debt Bubble bursts.
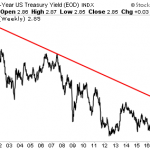
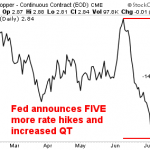
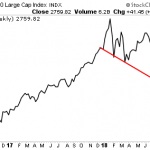
With that in mind, consider that yields on Treasuries have broken their long-term 20-year trendline.
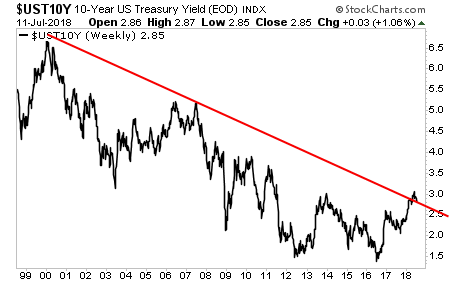
This is a MAJOR problem. The entire debt bubble requires interest rates to remain LOW in order for it to be maintained.
Inflation is screwing this up for the Fed… which now faces a NASTY choice… continue to support stocks or defend bonds… and unfortunately for stock investors, it’s going to have to choose bonds.
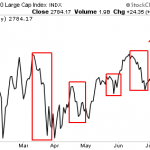
Put another way, I believe there is a significant chance the Fed will let the stock market collapse in order to drive capital BACK into the bond market to force bond yields down.
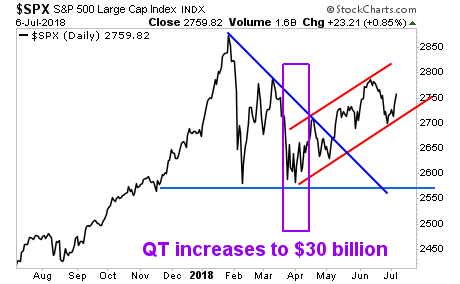
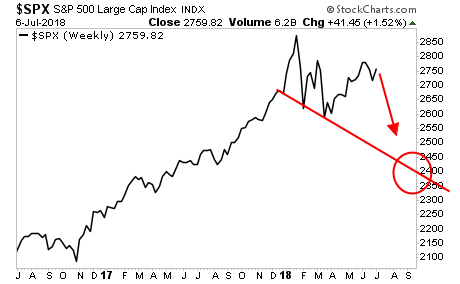
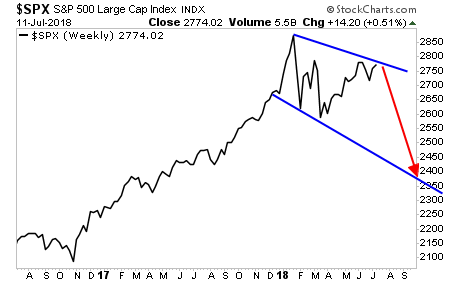
Yes, the Fed has screwed up with monetary policy. And it is doing so intentionally to try to sustain the Debt Bubble. Currently the downside target for the collapse is in the 2,300-2,450 range.
The time to prepare for this is NOW before the bloodbath hits.
On that note, we are already preparing our clients with a 21-page investment report that shows them FOUR investment strategies that will protect their capital when and if a stock market crash hits.
It’s called The Stock Market Crash Survival Guide… and it is available exclusively to our clients.
To pick up one of the 100 copies…use the link below.
https://www.phoenixcapitalmarketing.com/stockmarketcrash.html
Best Regards
Graham Summers
Chief Market Strategist
Phoenix Capital Research