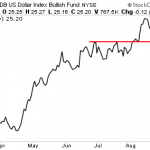
The inflationary move we predicted is now well underway.
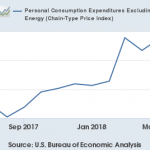
There are numerous inflation measures but the one the Fed primarily focuses on is the Personal Consumption Expenditures Deflator, or PCE Deflator. That metric hit 2.3% year over year in July. Well above the Fed’s 2% inflation target.
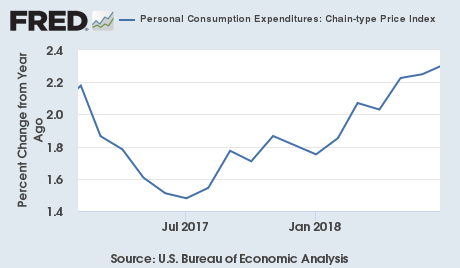
That chart is in a STRONG uptrend.
The other inflation measure the Fed focuses on is the Core Personal Consumption Expenditures or Core PCE. That metric hit 2% year over year in July… right smack on the Fed’s target rate of 2%.
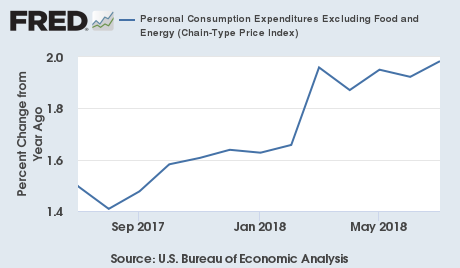
Here again, we see a VERY strong uptrend underway.
Put simply, the financial system has shifted into an inflationary framework. And those who allocate capital in targeted investments to profit from this shift will see truly MASSIVE gains!
On that note, today is the last day that our Special Investment Report on how to profit from this trend will be available to the public.
We extended the deadline by 24 hours based on this latest inflationary reading… but this is it, no more extensions.
To pick up yours, swing by:
https://www.phoenixcapitalmarketing.com/inflationstorm.html
Best Regards
Graham Summers
Chief Market Strategist
Phoenix Capital Research