

Today is the final day of October.
It has been a brutal month for fund managers. So expect them to do anything and everything in their power to ramp stocks higher so they can end the month with the best possible returns.
After that, it’s game over.
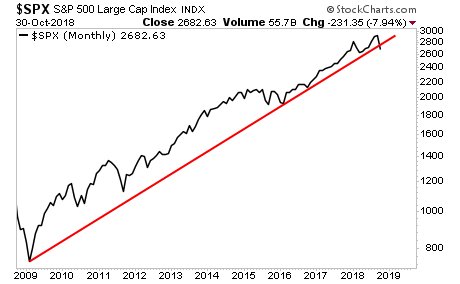
The monthly S&P 500 chart has violated its bull market trendline for the first time since the 2009 low. This STRONGLY suggests the bull market is OVER.
We also have NEGATIVE divergence on the monthly chart for the S&P 500’s RSI. And its monthly MACD is on a Sell signal.
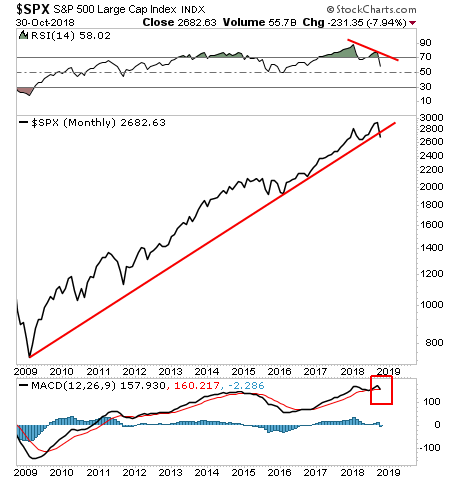
Just one of these signals would be trouble, but all three taken together (broken trendline, negative divergence on RSI, MACD “sell” signal), this is as close as you can get to “ringing the bell” at the top.
Will we get bounces and rallies? Yes. But unless you’re a nimble day trader, they’re going to be VERY hard to catch.
Bottomline: we are officially in a bear market, and stocks are going to collapse in a BIG way.
On that note we just published a 21-page investment report titled Stock Market Crash Survival Guide.
In it, we outline precisely how the crash will unfold as well as which investments will perform best during a stock market crash.
We are giving away just 100 copies for FREE to the public.
Today there are just a handful left.
To pick up yours, swing by:
https://www.phoenixcapitalmarketing.com/stockmarketcrash.html
Best Regards
Graham Summers
Chief Market Strategist
Phoenix Capital Research


