The biggest black swan facing the financial system is China.
China has been the primary driver of growth for the global economy since the 2008 Crisis. Despite only accounting for 15% of global GDP, China accounts for 25%-30% of GDP growth.
Put simply, from an economic perspective, if China catches cold, the world gets sick… and if China goes into a coma…
Which is why anyone paying attention should be truly horrified by the latest round of data from China’s economy.
In December, China’s Manufacturing PMI came in below 50, signaling a contraction is underway.
This is a massive deal because this was an OFFICIAL data point, meaning one that China had heavily massaged to look better than reality.
Let me explain…
Over the last 30 years China’s economic data has ALWAYS overstated growth. The reason for this is very simple: if you are an economic minister/ government employee who lives in a regime in which leadership will have you jailed or executed for missing your numbers, the numbers are ALWAYS great.
Indeed, this is an open secret in China, to the degree that former First Vice Premiere of China, Li Keqiang, admitted to the US ambassador to China that ALL Chinese data, outside of electricity consumption, railroad cargo, and bank lending is for “reference only.”
With that in mind, we have to ask… how horrific is the situation in China’s financial system that even the heavily massaged data is showing a contraction is underway?
Think “systemic risk” bad.
I’ve already outlined how China is sitting atop 15% of all junk debt in the global financial system, resulting in the country’s “bad debt” to GDP ratio exceeding 80% (a first in history).
However, it now appears that even that assessment was too rosy.
Last Friday, China’s Central Bank, called the People’s Bank of China, or PBOC, released its Financial Stability Report for 2018. Nestled amidst the various accounting gimmicks was the following:
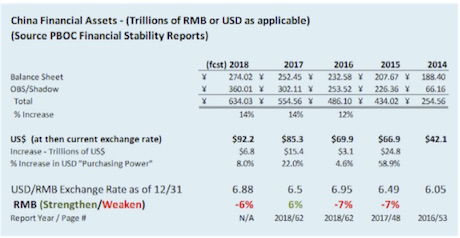
H/T Deep Throat IPO
What you are looking at is a table in which China’s Central Bank admits that China has added $50 TRILLION in new financial assets to its financial system in the last FOUR years.
Bear in mind, China’s entire economy is only $12 trillion… so you are talking about it adding over 400% of its GDP in financial assets… in less than FIVE years. From 2013-2017, China added $25 in new financial assets for every $1 in GDP.
Never in history has a country done this. NEVER.
Oh and nearly all of this (78%) was in SHADOW financial assets… or assets that are completely unregulated with the WORST underwriting standards.
To put this into perspective, imagine if the US Federal Reserve revealed in 2007 that the banking industry had created $56 TRILLION in subprime mortgages from 2003-2007.
THAT is the equivalent of what China has done.
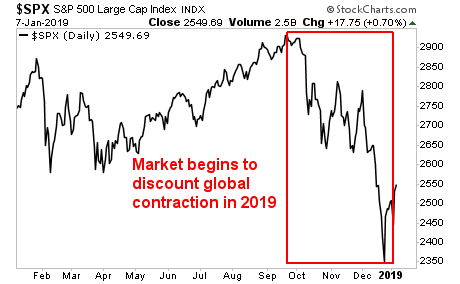
As I have maintained time and again, China is one gigantic financial fraud fueled by garbage debt. It is the #1 risk to the global financial system today. And by the look of things it’s about to Collapse.
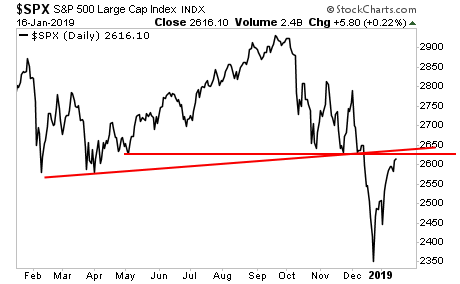
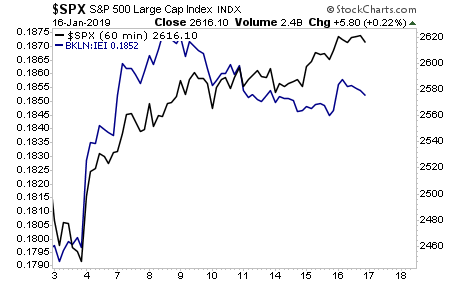
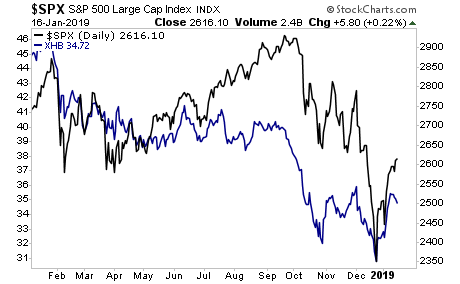
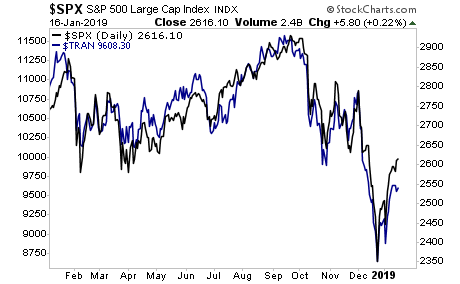
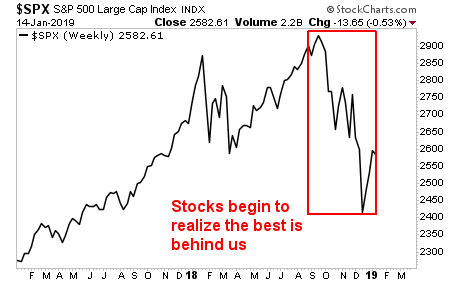
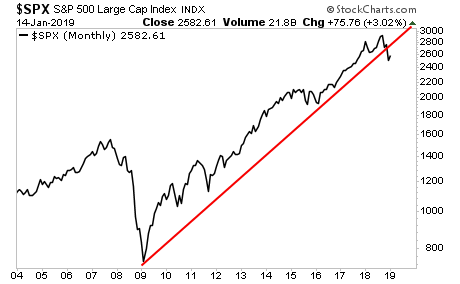
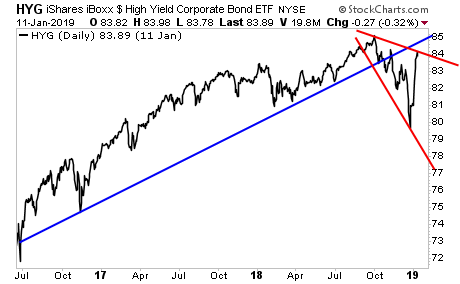
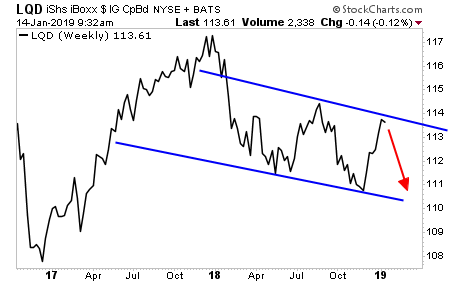
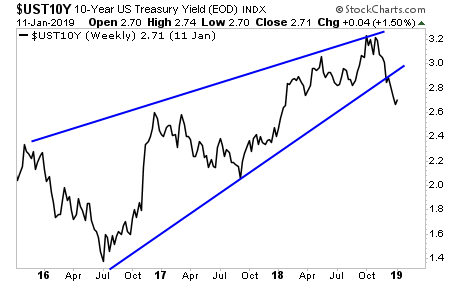
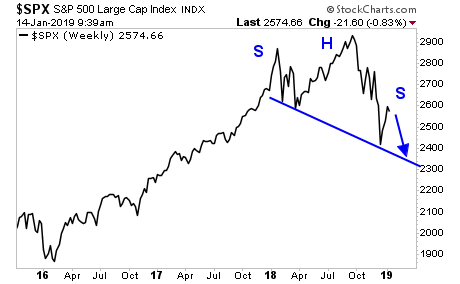
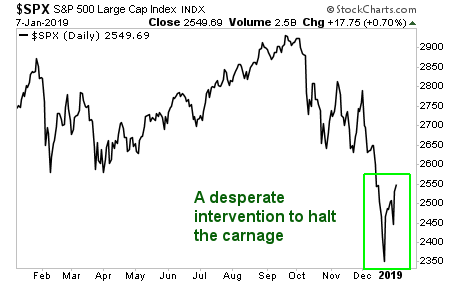
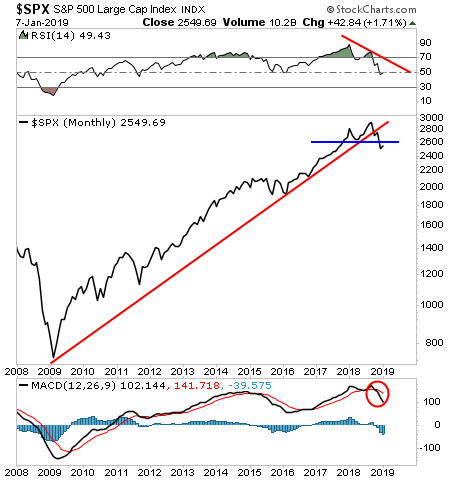
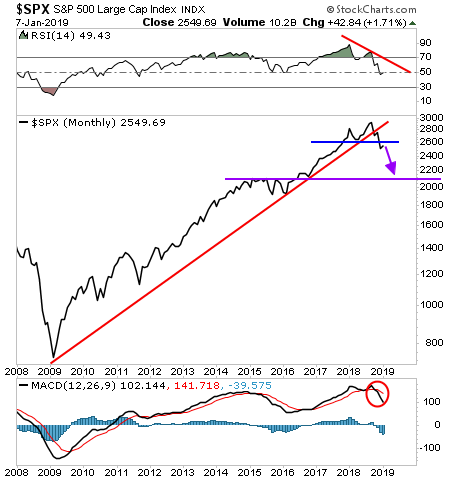
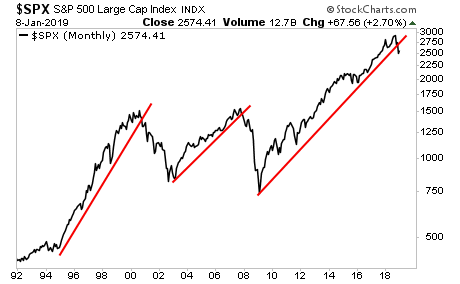
The market knows it too. Take a look at the below chart:
A Crash is coming… and 99% of investors will panic when it hits… but not those who have downloaded our 21-page investment report titled Stock Market Crash Survival Guide.
In it, we outline precisely how the crash will unfold as well as which investments will perform best during a stock market crash.
Today is the last day this report will be available to the public. We extended the deadline based on yesterday’s sucker rally, but this it IT… no more extensions.
To pick up yours, swing by:
https://www.phoenixcapitalmarketing.com/stockmarketcrash.html
Best Regards
Graham Summers
Chief Market Strategist
Phoenix Capital Research