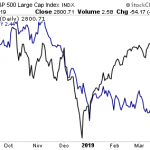
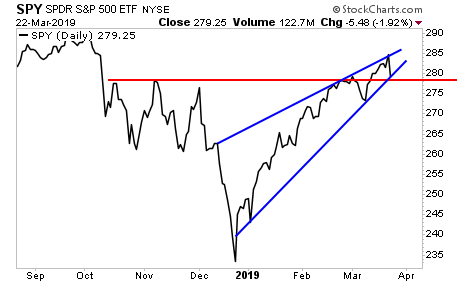
Stocks are now at THE line.
The Friday meltdown brought the S&P 500 to critical support (red line). It was only through abject manipulation that the PPT was able to keep stocks there. The bearish rising wedge formation (blue lines) that was guided price action since the December lows remains intact… for now.
Unfortunately that’s where the good news ends. If we look for leading risk indicators in the market, then it looks as though stocks are going to soon collapse.
————————————————-
A BIG Profit Trading System That EXPLODES During Market Crises
I’ve spent the last four years developing a trading system to profit from market volatility. Since that time, this trading system has produced average annual gains of 41%… and we’re not even in a crisis yet!
By the way, I’m not talking about a single trade… I’m talking gains of 41% per year on the ENTIRE portfolio.
We’re on another winning streak, having closed out a 9%, 17% and another 20% gain in the two weeks alone.
With this kind of track record, we’re closing the doors to new subscribers soon.
There are currently fewer than 5 slots left for potential subscribers.
To lock in one of the last slots…
————————————————-
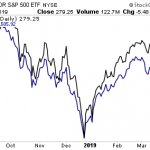
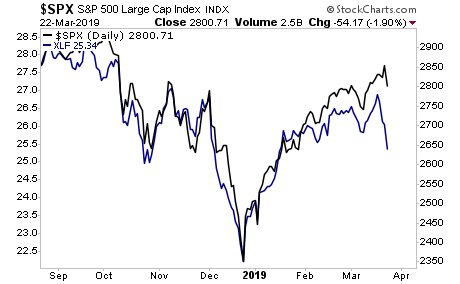
The financial sector (blue line) tends to lead the S&P 500 both to the upside and the downside. Right now it’s telling us that the S&P 500 should be at 2,600 or so.
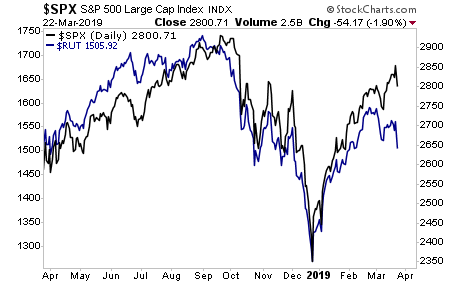
Russell 2000 (blue line) is another leading risk indicator. It too now it’s telling us the S&P 500 should be at 2,600 or so.
And then there’s the bond market, where the yield on the 10-Year US Treasury (blue line) is telling us that stocks will take out the December lows.
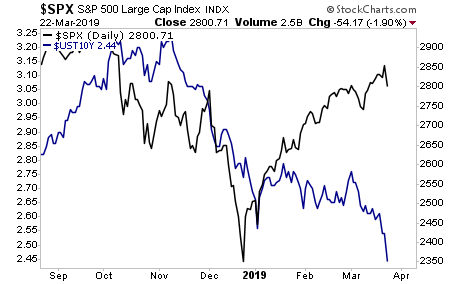
Unfortunately… bonds are the smart money here. A Crash is coming and smart investors are already taking steps to prepare for it.
On that note we just published a 21-page investment report titled Stock Market Crash Survival Guide.
In it, we outline precisely how the crash will unfold as well as which investments will perform best during a stock market crash.
Today is the last day this report will be available to the public. We extended the deadline based on yesterday’s sucker rally, but this it IT… no more extensions.
To pick up yours, swing by:
https://www.phoenixcapitalmarketing.com/stockmarketcrash.html
Best Regards
Graham Summers
Chief Market Strategist
Phoenix Capital Research