

Over the last three days, I’ve been outlining how the Fed “spooked” the bond markets into believing it will move to crush inflation sometime in the next 18 months.
Yesterday we detailed why the Fed would do this, namely because long-term bond yields represent the “growth expectations” against which stocks are priced. So provided these yields are falling to new lows, stocks can continue to rise to new highs.
Put another way, the primary means through which the Fed can keep the “music playing” for the bull market is by manipulating the markets into buying ever cheaper and cheaper debt.
This will allow stocks to go to truly spectacular bubble territory. Yesterday I posited that we could even see the S&P 500 rise to 5,000.
However, it’s important to note the risks associated with this monetary policy. And those risks are clearly illustrated in the below chart.
This is a long-term chart of the S&P 500 along with its 50-month and 200-month moving averages (MMAs).
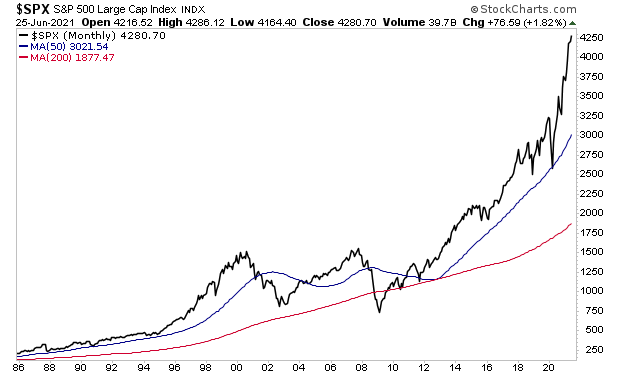
As you can see, the 50-MMA is of extreme importance to the stock market. During bull markets, the S&P 500 usually bounces hard off this line. And at the start of bear markets, a breakdown below this line is usually the first sign that a bull market is over.
The key item I want to draw your attention to is just how stretched the S&P 500 is above its 50-MMA. The below chart has an added lower box that shows stocks are currently 38% above this level. It’s also worth noting that the market has only been more stretched above this level two times: during the Tech Bubble of the late ‘90s and right before the 1987 Crash.
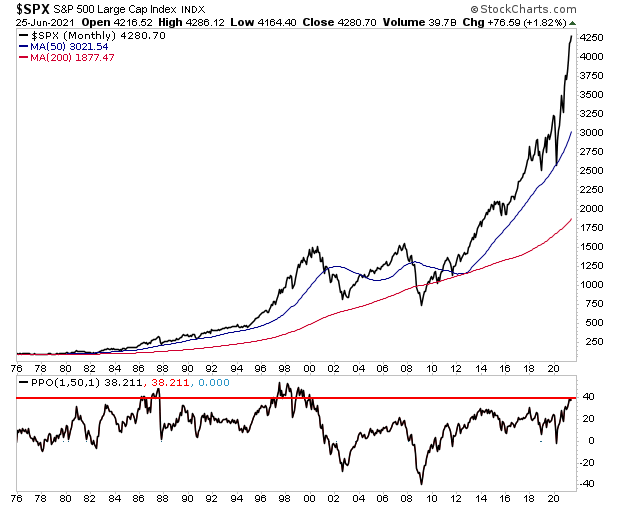
Suffice to say, both of those instances resulted in pretty dramatic drops.
It’s important to note that the fact stocks are this stretched above the 50-MMA doesn’t necessarily mean that stocks will crash right here and now. As I’ve just detailed, stocks have in fact been even more stretched than this before during other bubbles.
Moreover, with the Fed making it clear it wants stocks to roar even higher, we could indeed see stocks become even MORE stretched above their 50-MMA. It’s never smart to fight the Fed. And until stocks do “something wrong” I wouldn’t sell the farm just yet.
But for certain, when this bubble bursts, we’re in for a spectacular collapse to at least the 50-MMA, which would mean a drop to 3,000. And if stocks enter a new bear market, then we’re talking about a drop to the 200-MMA which would mean stocks falling by more than 50% to 2,000.
A crash is coming. Maybe not this week or next, but it’s coming… which is why we’ve reopened our Stock Market Crash Survival Guide to the general public.
Within its 21 pages we outline which investments will perform best during a market meltdown as well as how to take out “Crash insurance” on your portfolio (these instruments returned TRIPLE digit gains during 2008).
We are making just 100 copies available to the general public.
To pick up your copy of this report, FREE, swing by:
http://phoenixcapitalmarketing.com/stockmarketcrash.html
Best Regards
Graham Summers
Chief Market Strategist
Phoenix Capital Research


