

Yesterday I noted that Friday’s action was very troubling. By quick way of review:
- It is unusual for stocks to close down on Friday.
- It’s even more unusual for stocks to finish the week down.
- Not only did stocks finish the day and week down but they did so near the lows. This too is highly irregular as typically the markets bounce hard off the lows even if they finish the session or week down.
Today I’d like to delve into the specifics of what the market is telling us.
The market is telling us that something BAD is brewing in the economy. While it’s true that stocks no longer have a close relationship with the economy (stocks will often rally on both bad and good economic news), certain sectors are HIGHLY correlated to economic activity. And they all are flashing major warnings.
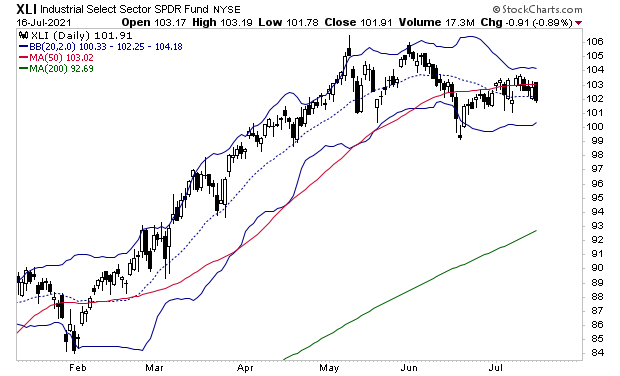
First and foremost are Industrials (XLI). These are companies that either produce actual things like tractors, cranes, HVAC systems, etc. or that are involved in real economic activity (mail/shipping). As such, they represent a good gauge of how strong the real economy is doing: during economic expansions these businesses receive more orders.
The chart is downright awful. Industrials have rolled over and broken below their 50-day moving average (DMA).
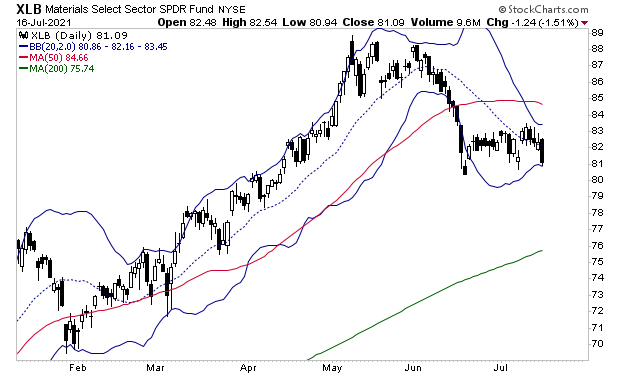
Next up are Materials (XLB). These are companies involved in producing things like concrete, copper, steel and the like. During economic expansions these companies receive more orders as they are the primary suppliers of commodities needed for construction, manufacturing and the like.
Here again the chart is awful. The breakdown is more severe than that of industrials. Not only is XLB further below its 50-DMA but the down days are powerful, wiping out weeks’ worth of gains in a single session.
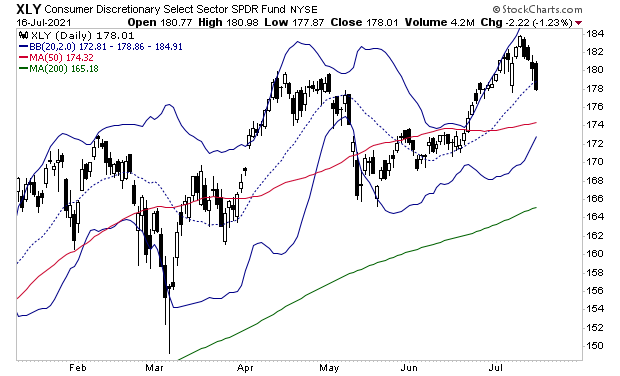
Finally, we have the Consumer Discretionary (XLY). The consumer accounts for 75% of the U.S. economy. The chart is not nearly as bearish as that of Industrials or Materials, but it is still awful.
XLY has effectively gone nowhere since April. The rally in June/ early July failed miserably and now it looks as though we’ll see a test of the 50-DMA. By itself this is an ugly chart, but in the context of what’s happening in Industrials and Materials it is very worrisome.
Add these charts up and they are telling us something BAD is happening in the economy right now. With that in mind, we’ve reopened our Stock Market Crash Survival Guide to the general public.
Within its 21 pages we outline which investments will perform best during a market meltdown as well as how to take out “Crash insurance” on your portfolio (these instruments returned TRIPLE digit gains during 2008).
We are making just 100 copies available to the general public.
To pick up your copy of this report, FREE, swing by:
http://phoenixcapitalmarketing.com/stockmarketcrash.html
Best Regards
Graham Summers
Chief Market Strategist


