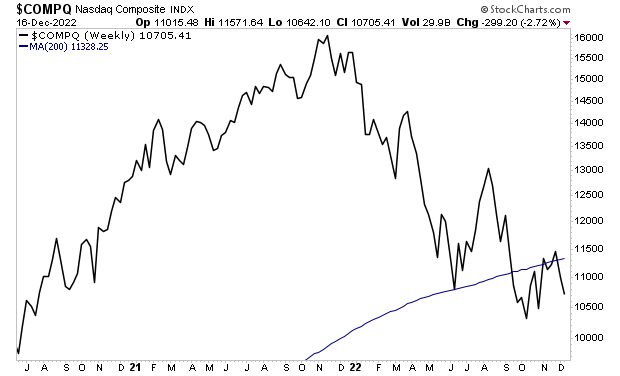
Something MAJOR happened last week for Tech Stocks.
That something?
The NASDAQ failed to reclaim its 200-week moving average (WMA).
See for yourself.
Why does this matter?
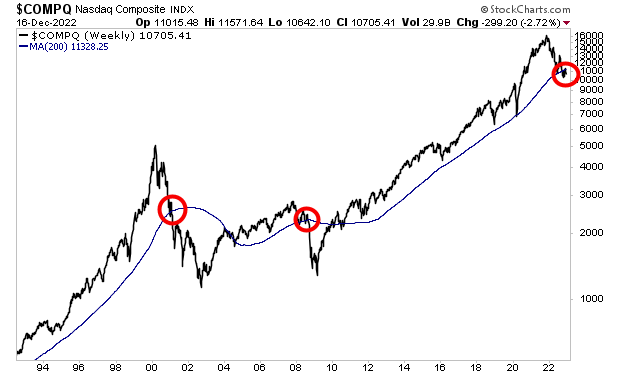
The NASDAQ has only lost its 200-WMA two other times in the last 30 years. Both of these instances (2001 and 2008) were during major bear markets that saw stocks lose an additional 44%-55% of their total value.
I’ve illustrated them in the chart below with red circles. Note that even during the 2020 crash, stocks managed to hold this line.
Not this time.
There is a small chance the bulls might be able to rally here and stop a full-scale collapse. But the clock is ticking.
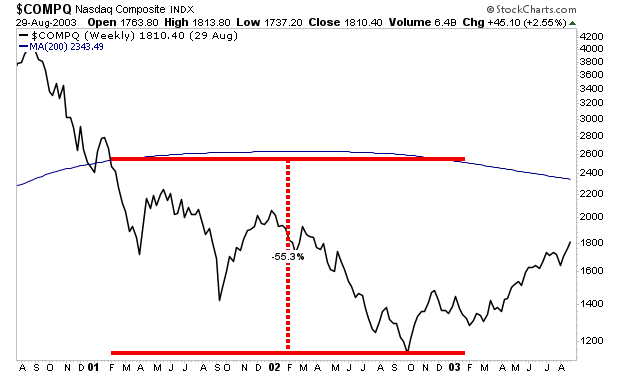
If they don’t, consider that after the NASDAQ lost its 200-WMA in 2001, stocks lost another 55% in value.
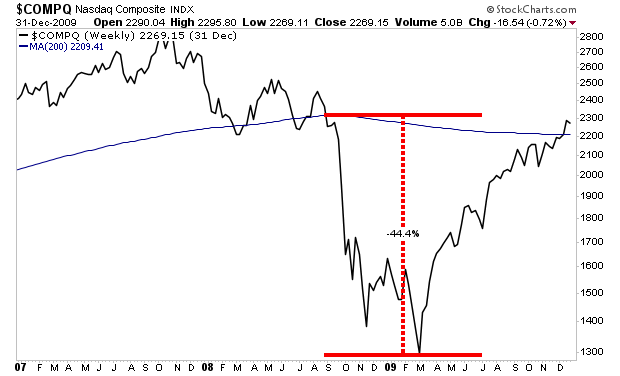
In 2008, when they lost this line, stocks lost another 44%.
Suffice to say, a lot is at stake here. And as I said before… the clock is ticking.
If you’ve yet to take steps to prepare for the next leg down in the markets, we just published a new exclusive special report How to Invest During This Bear Market.
It details the #1 investment to own during the bear market as well as how to invest to potentially generate life changing wealth when it ends.
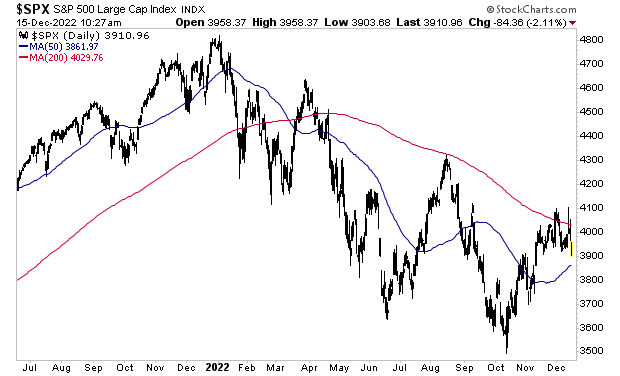
The big news this week is that stocks lost their 200-Day Moving Average (DMA) again.
Historically, November and December are two of the most bullish months for stocks. Only April is better from a single month perspective. So, the fact the market was unable to reclaim its 200-DMA and remain there is EXTREMELY bearish.
The price action was feeble to say the least.
The bulls have everything going for them: the Fed has reduced the pace of its interest rate hikes, the economy is not yet in recession, and we are in one of the best months for stock market returns: the famed Santa Rally of December.
So the fact that the bulls were unable to get stocks above their 200-DMA indicates that this recent market rally was nothing more than a Bear Market Rally, NOT the start of a new Bull Market.
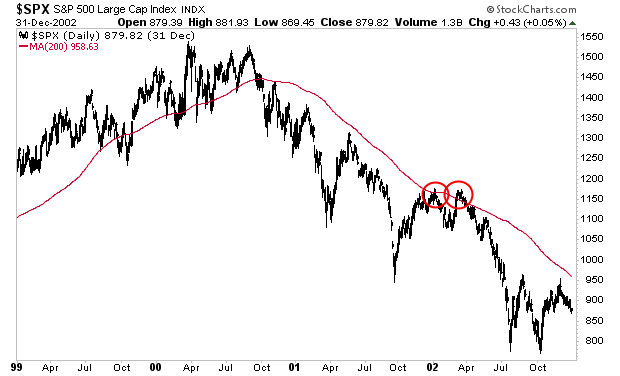
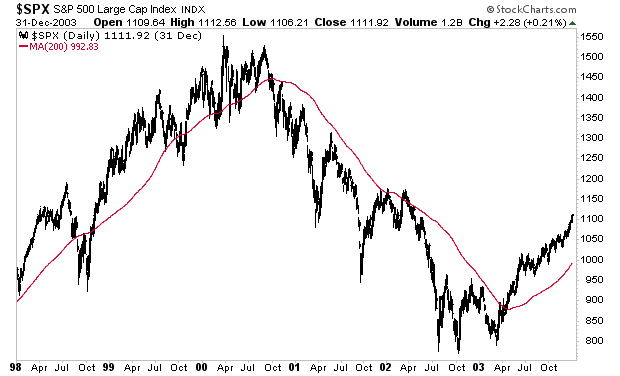
Below is a chart of what happened to stocks when they failed to maintain their 200-DMA during the Bear Market of 2000-2003. I’ve highlighted this in red circles. Stocks dropped another 30%.
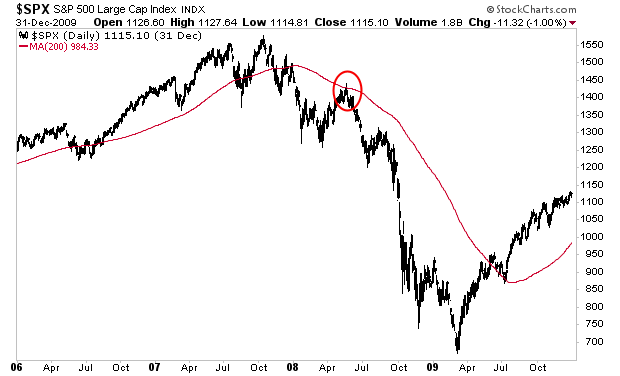
Here’s the same item during the bear market of 2007-2009. This time around stocks lost 50%.
Unfortunately for anyone who is buying into this narrative that stocks are in a new bull market, the bear market is NOT over. With a recession just around the corner, stocks will soon collapse to new lows.
If you’ve yet to take steps to prepare for this, we just published a new exclusive special report How to Invest During This Bear Market.Paragraph
It details the #1 investment to own during the bear market as well as how to invest to potentially generate life changing wealth when it ends.
The Fed will end its two-day Federal Open Market Committee (FOMC) meeting today at 2PM East Standard Time.
The known universe expects the Fed to raise rates by 0.5%. And the current consensus is that by this time next year, inflation will be down near 2%.
It’d be hilarious if it didn’t involve so much suffering.
To understand what I mean by this, let’s wind the clocks back a year to the Fed’s December 15th 2021, FOMC meeting. At that time, the Fed had only just decided that inflation was NOT “transitory.”
Bear in mind, inflation has measured by the Consumer Price Index (CPI) had cleared 5% in June of 2021. It had since increased to over 7% as of December 2021.
Despite this, the Fed had yet to raise rates or end its Quantitative Easing (QE) program: the Fed Funds Rate was at 0.25% and QE was around $105 billion per month.
Again, inflation was over 7%, the Fed Funds rate was 0.25% and QE was still over $100 billion per month. So, what did the Fed, with its army of economics PhDs and analysts predict would happen once the Fed started tightening monetary conditions in 2022?
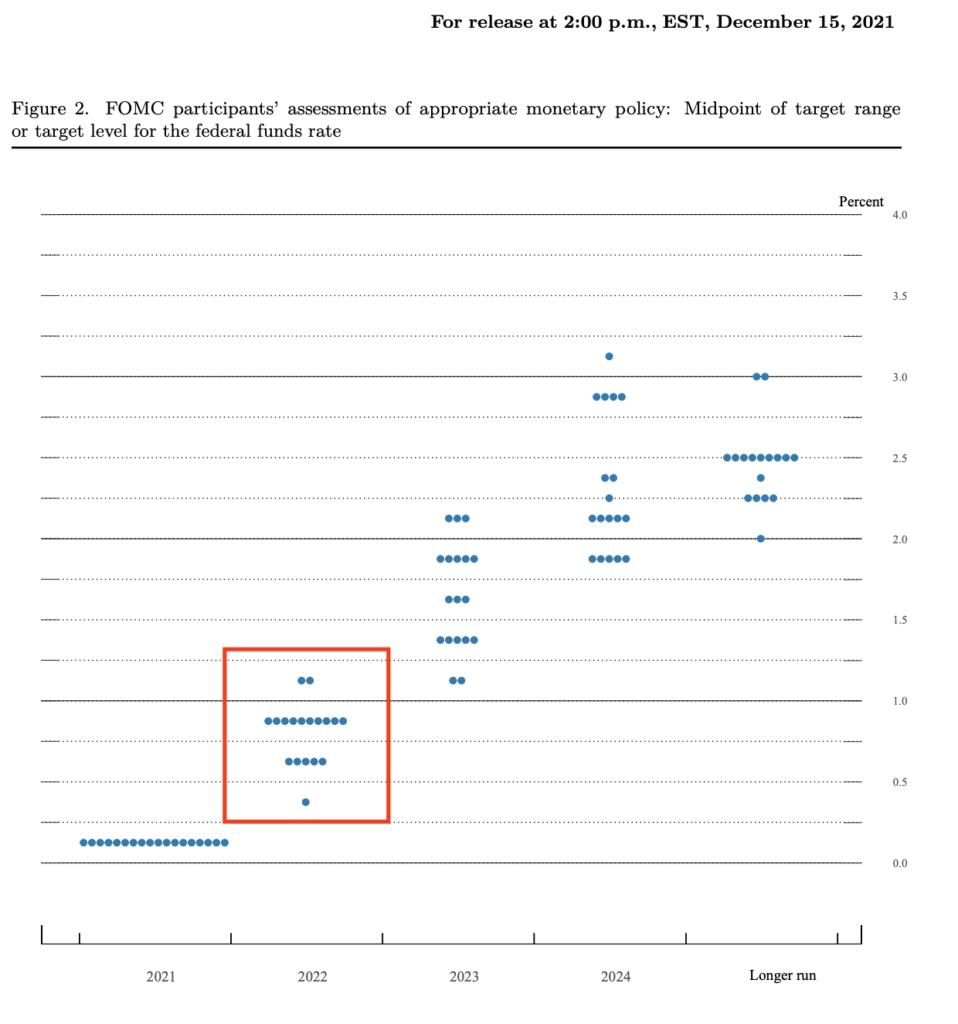
The Fed’s official forecast for 2022 was that rates would be somewhere between 0.5% and 1%.
That is correct. With inflation over 7% and rates at 0.25% in December 2021, Fed officials predicted that one year later rates would be somewhere around 0.5%-1%. In fact, even the most HAWKISH Fed officials only saw rates around 1.25% in December 2022.
Don’t believe me? Here’s the dot plot from the December 2021 meeting.
Fast forward to today… and rates are at 4.5%. The Fed was not even in the ballpark.
But wait… it gets better.
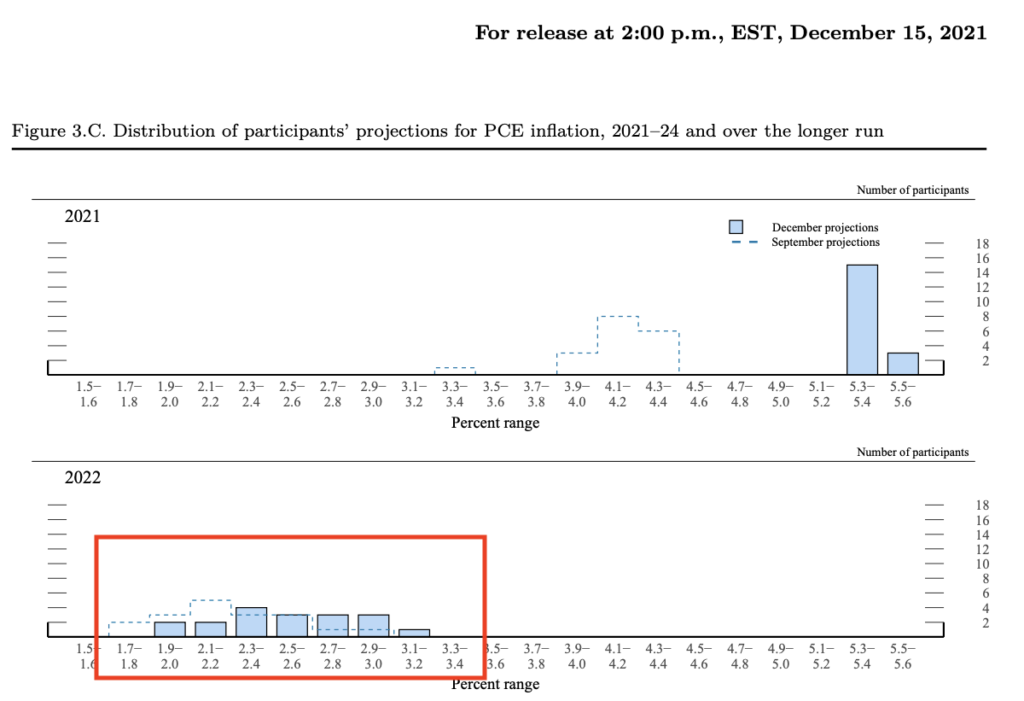
Back in December 2021, the Fed also predicted where inflation, as measured by the Personal Consumption Expenditures (PCE) index would be a year later.
That prediction?
That PCE would be somewhere between 1.9% and 3% in 2022. In fact, the absolute worst case scenario Fed officials forecast for inflation in 2022 was 3.1%-3.2%.
See for yourself.
Fast forward to today and Personal Consumption Expenditures (PCE) inflation is 6%… or roughly DOUBLE the Fed’s WORST prediction.
I bring all of this up because the current consensus is that inflation has peaked, the Fed won’t need to be much more aggressive going forward, and that this time next year, inflation will have fallen back to the Fed’s target of 2%.
Good luck with that!
Unfortunately for anyone who is buying into this narrative today, the bear market is NOT over. With a recession just around the corner, stocks will soon collapse to new lows. And that’s even assuming that inflation DOES drop to 2% next year (it won’t).
If you’ve yet to take steps to prepare for this, we just published a new exclusive special report How to Invest During This Bear Market.Paragraph
It details the #1 investment to own during the bear market as well as how to invest to potentially generate life changing wealth when it ends.
The markets have reached a new level of stupidity.
Stocks are exploding higher based on inflation coming in at 7.1% Year over Year. This is apparently great news because Wall Street expected the number to be somewhere between 7.2% and 7.6%.
So, according to those buying stocks today, a 0.1% “beat” on an inflation number that is still north of 7% despite the Fed implementing its most aggressive rate hike cycle in 40 years in is a reason to panic bid stocks higher.
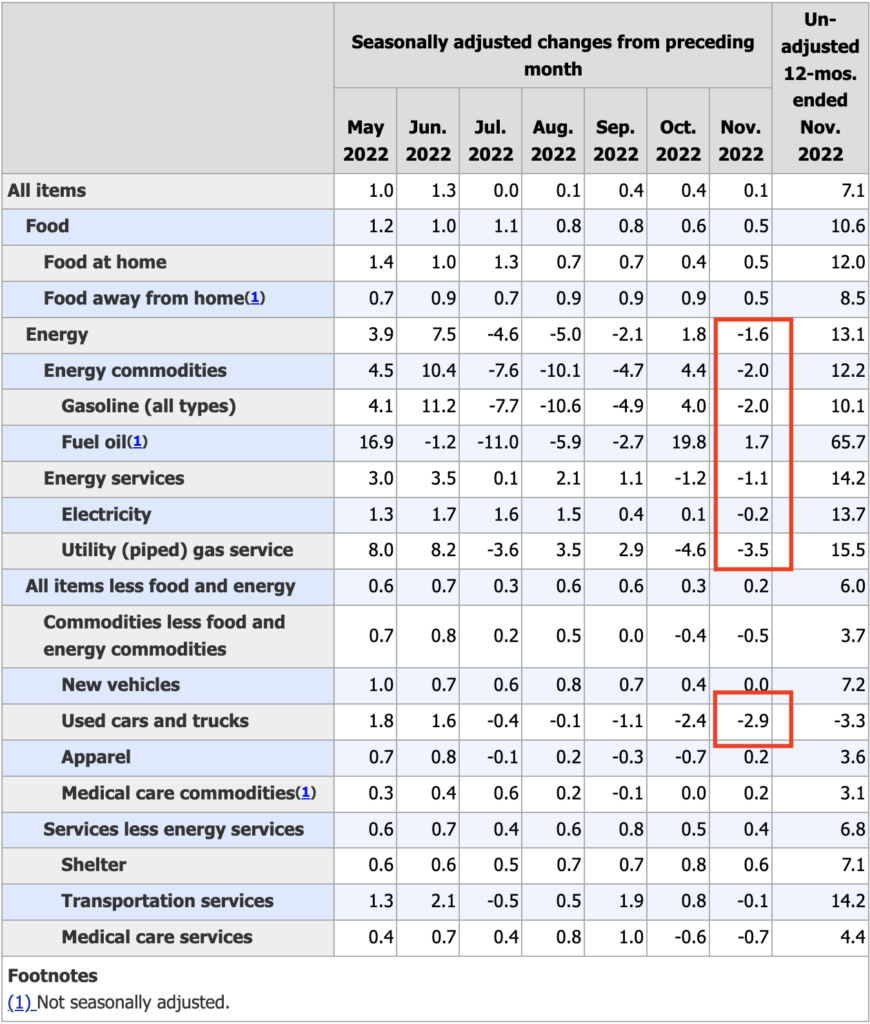
Looking through the numbers, almost the entire drop came courtesy of falling energy prices and used cars. I might add that the drop in energy is not surprising given that the Biden administration drained the Strategic Petroleum Reserve (SPR) by ~180 million barrels of oil. Practically everything outside of energy and used car prices is still rising.
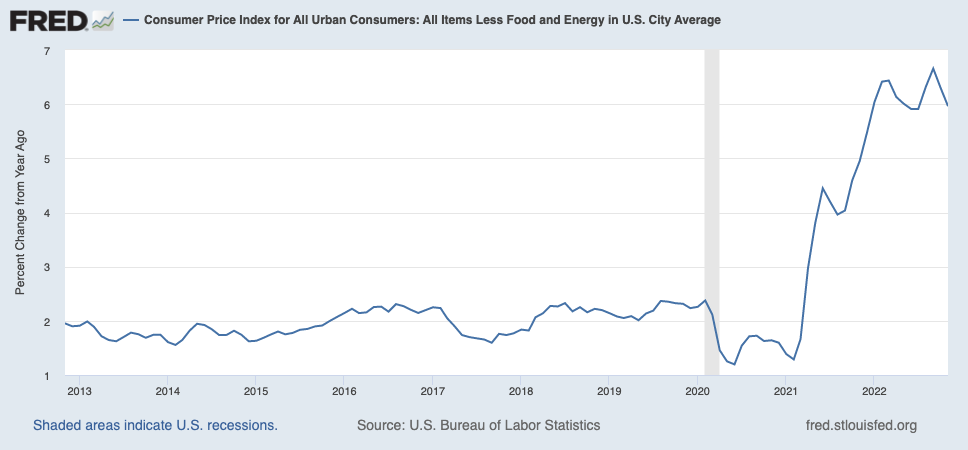
Elsewhere in the report, core inflation, which the Fed looks at closely is still at 6%. Sure, it’s not spiking any higher, but this it’s not coming down much either. Again, this is good in a way, but is it a reason to panic buy stocks like inflation is gone? I don’t think so.
Unfortunately for those who are panic buying stocks today, the bear market is NOT over. With a recession just around the corner, stocks will soon collapse to new lows.
If you’ve yet to take
steps to prepare for this, we just published a new exclusive special
report How to Invest During This Bear Market.
It details the #1
investment to own during the bear market as well as how to invest to potentially
generate life changing wealth when
it ends.
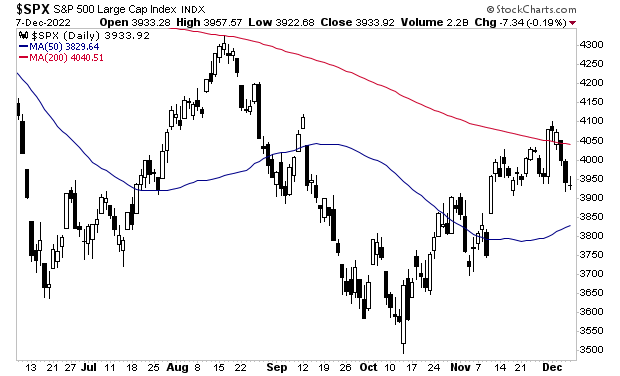
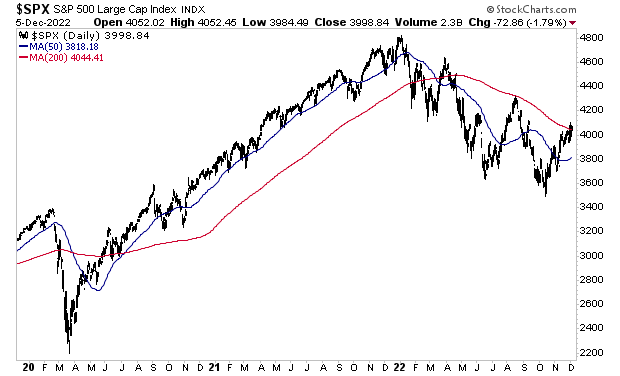
As I warned earlier this week, stocks have lost their 200-day moving average (DMA).
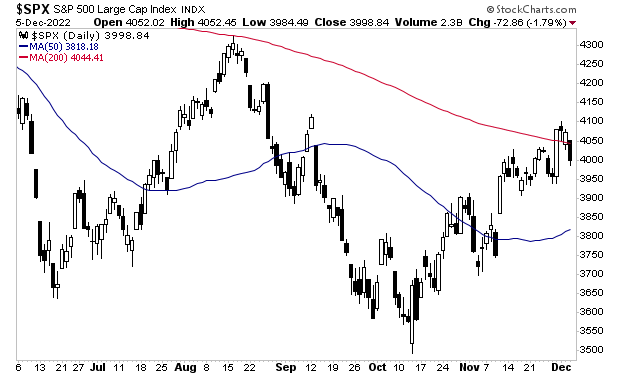
This is a MAJOR development. In terms of seasonality, things are usually quite bullish this time of year (the famed “Santa rally”). The fact the bulls failed to keep the S&P 500 above its 200-DMA despite this is VERY bearish.
Remember, the 200-DMA is like a “line in the sand” for long term trends in the market. During bull markets, stocks rarely break below it. And during bear markets, stocks rarely break above it. You can see this relationship clearly in the below chart. The 200-DMA is the red line.
Put simply, the failure to maintain the 200-DMA indicates that this recent market rally was nothing more than a Bear Market Rally, NOT the start of a new Bull Market.
Below is a chart of what happened to stocks when they failed to maintain their 200-DMA during the Bear Market of 2000-2003. I’ve highlighted this in red circles. Stocks dropped another 30%.
Here’s the same development during the bear market of 2007-2009. This time around stocks lost 50%.
So again, the bear market is not over. The trend remains down. And stocks could lose another 30%-50% in the next 12 months.
If you’ve yet to take
steps to prepare for this, we just published a new exclusive special
report How to Invest During This Bear Market.
It details the #1
investment to own during the bear market as well as how to invest to potentially
generate life changing wealth when
it ends.
The following is an excerpt from my weekly investment advisory Private Wealth Advisory. To learn more about Private Wealth Advisory and how it can help you and your investments, Click Here!
This week I have
good news and bad news.
The good news is
that bonds are finally starting to stabilize.
The bad news is
that they are doing this right as the economy collapses into a severe recession.
As I’ve outlined throughout this year, the
ENTIRE stock market collapse thus far has been due to bond yields rising.
When Treasuries were yielding 0.25%-0.4%
throughout most of 2020 and 2021, investors were willing to pay 20-22 times
forward earnings for stocks. However, once Treasury yields rose over 4% stocks
were repriced down to 16-18 times forward earnings. This makes sense. When the
“risk free” rate of return is close to zero, you’ll pay a premium for growth.
But once you can earn 4+% “risk free” suddenly stocks look a lot riskier!
Indeed, stocks were priced at 20-22 times forward earnings for most of 2020 and 2021. However, once Treasury yields began to rise in late 2021, stocks peaked in terms of multiples. They were eventually repriced down to 16-18 times earnings.
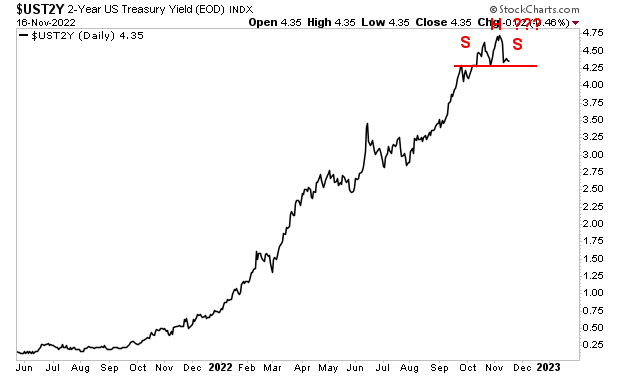
As I noted since this repricing began, the ONLY thing that would stop stocks from being repriced lower would be if bond yields stabilized. With that in mind, I want to point out that the yield on the 2-Year U.S. Treasury appears to have peaked. In fact, it now looks to be forming a kind of “Head and Shoulders” topping pattern. We only need the right shoulder to complete that pattern.
Regardless of
whether that Head and Shoulders pattern is actually confirmed, the key item
here is that Treasury yields finally appear to be
stabilizing. Obviously, stocks would LOVE for Treasury yields to fall,
as that would open the door to a higher forward multiple (assuming the economy
is strong). But for now, the price action in the Treasury market suggests that
stocks will remain priced at a forward multiple of 16-18 at least for now.
That is the good
news.
The bad news is
that earnings are now collapsing, as the economy collapses into a severe
recession. This means the denominator in the P/E ratio (Price/ Earnings) is now
shrinking. Earnings for the third quarter of 2022 are DOWN 8% Year over Year.
As Charlie Bilello notes, this is the second consecutive quarter of
negative earnings growth on a Year over Year basis.
Unfortunately, earnings will be dropping even more going forward. To understand why, we need to first understand the Treasury market. The Treasury is comprised of numerous bonds with different maturation periods ranging from 4 weeks to 30 years.
When you plot the
yield on all of these bonds, you get the “yield curve.” And the
difference in yield between various bonds on this curve is one of the most
accurate predictors of recession.
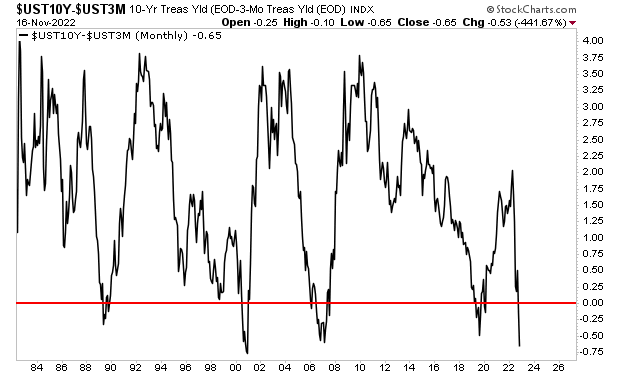
Specifically, the
difference between the yield on the 10-Year U.S. Treasury and the yield on the
3-month U.S. Treasury. Anytime this difference becomes negative (meaning the
3-month yield is actually higher than the 10-year yield) this indicates a
recession is about to hit.
I’ve illustrated
this in the chart below. Anytime the
black line falls below the red line, the 10-year 3-month yield curve is
“inverted.” This was the case in 1989, 2001, 2007, and 2019: all of those
preceded recessions.
It is happening again now. And as you can see, this metric is MORE negative today than it was before the COVID-19 crash as well as the Great Financial Crisis.
Put simply, the
yield curve of the Treasury market is predicting a severe recession in
the near future, likely the start of 2023.
This is going to
force stocks to new lows.
During the typical recession, Earnings Per Share
(EPS) usually fall 25%. As I write this, Wall Street’s current consensus for
2023 EPS is $230. And Wall Street expects this to GROW by 5%!!!
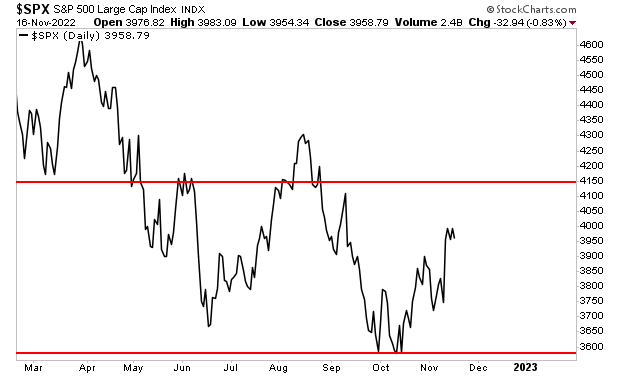
This means the anticipated fair value for the S&P 500 is somewhere between 3,680 and 4,140. Incidentally, that is the EXACT trading range the S&P 500 has been moving in for the last six months.
Put simply, the market is trading based on what Wall Street
expects is coming down the pike. But as I just noted, Wall Street expects
earnings growth of 5% next year. However, the reality is that bonds are telling
us a recession is coming… and a recession would mean a DECLINE in
earnings of at least 25% (remember, the yield curve is predicting a
SEVERE recession).
This would mean the actual 2023 EPS would be closer to $172.
Assuming Treasury yields no longer rise, this means the fair
value for the S&P 500 at 16 to 18 times this much lower EPS would be
2,752-3,096. I’ve illustrated that range in the chart below. Suffice to say,
the stock market has a LONG ways to go to the downside.
“But wait a minute, Graham” some of you are probably
thinking… “the Fed is about to pivot sometime next year, and that would STOP
the bear market!”
I wish that was
the case…
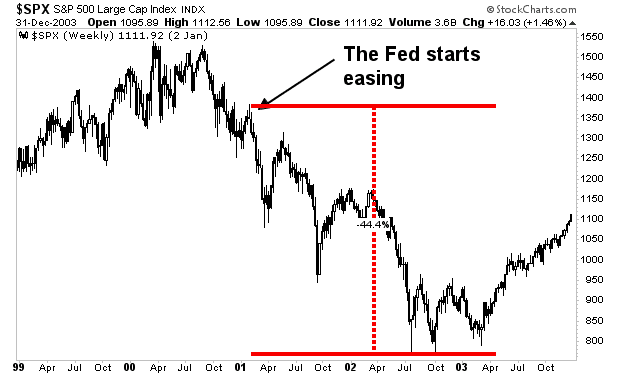
Historically, anytime the Fed stops
tightening and begins easing, the markets don’t actually bottom for
another 14 months.
During the Tech Crash, the Fed started cutting rates in January of 2001. However, by that point, a recession had hit and stocks lost another 44% eventually bottoming in October 2003.
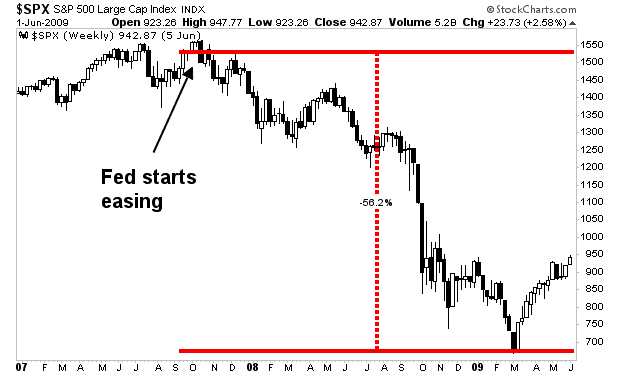
Similarly, during the Housing Crash, the
Fed started easing in August of 2007. There again, a recession hit and stocks lost
another 56% before eventually bottoming in March 2009.
Simply put, even
if the Fed were to surprise everyone and start easing as soon as next month (December) the coming recession
would STILL result in EPS collapsing and stocks cratering another 30% or so.
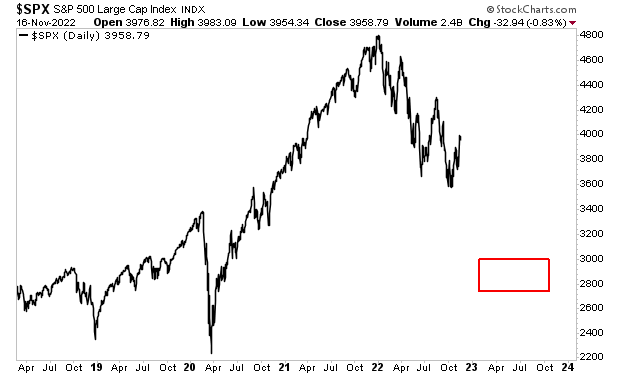
With stocks at
4,000 or so on the S&P 500, a 30% decline would bring them right to… 2,800,
or around the lower end of the implied fair value for the market at a 16- times
my expected EPS for 2023: $172.
Low Multiple Recessionary EPS Fair Value in 2023
16 X $172 = 2,752
or ~2.800
So again, this
week we have both good news and bad news. The good news is that bonds are
stabilizing. The bad news is that a recession is coming, and earnings are about
to crater.
That will trigger
a stock market collapse to new lows… possibly down to the mid-2000s on the
S&P 500.
If you’ve yet to take steps
to prepare for this, we just published a new exclusive special report How to Invest During This Bear Market.
It details the #1 investment
to own during the bear market as well as how to invest to potentially
generate life changing wealth when
it ends.
Stocks lost their 200-day moving average (DMA) yesterday.
This is a major development, because it indicates that the bulls could not get the S&P 500 to break above its 200-DMA and stay there, despite numerous interventions, manipulations, and performance gaming.
Why does this matter?
The 200-DMA is like a “line in the sand” for long term trends in the market. During bull markets, stocks rarely break below it. And during bear markets, stocks rarely break above it. You can see this relationship clearly in the below chart. The 200-DMA is the red line.
With this latest failure, it’s a clear sign that the bear market is nowhere near over. Take a look at the bear market of 2000-2003 to see what I mean.
Here’s the bear market of 2007-2009.
So again, the bear market is not over. The trend remains down. And it likely won’t end anytime soon (think months, possibly years). Many investors will lose another 50% of their portfoios… if not more as it unfolds.
You don’t need to be one of them!
If you’ve yet to take steps to prepare for this, we just published a new exclusive special report How to Invest During This Bear Market.
It details the #1 investment to own during the bear market as well as how to invest to potentially generate life changing wealth when it ends.