The China Crisis You Haven’t Heard About

There are two “clear cut” roads to long-term economic disaster.

1)   Spending too much relative to GDP (see European social welfare states).

2)   Reproducing too little.

Today we’re focusing on #2.

Analyzing demographics can lay the groundwork for future investment success in a big way. Population growth plus productivity improvement are what drive long-term changes in GDP. Long-term changes in GDP drive investment success (or failures).

Unfortunately for investors, demographically much of the developed world is in trouble. Japan, Europe and even the United States have seen declining fertility rates in recent decades. Today, all three regions are well below the 2.05 children per woman needed to sustain, let alone grow population.

This same issue affects the developing world too. And China is the clear leader for a potential demographic crisis in the coming years.

Today China produces only 1.6 children per woman across the board. If you want to focus on the wealthier segments of the Chinese population, using Hong Kong as a proxy, the numbers are even worse.

It is not coincidence that the country China intends to further loosen its “one child” policy and is also considering the closing of labor camps.  Both are welcome developments even if the latter may not be a “done deal.” And both are designed to help boost China’s population.

China needs to produce, on average, 2.05 children per woman to maintain its population and support its ageing citizens. Anything lower then this means a slowdown economically in the future (no matter how much China improves productivity).

This issue also comes with geopolitical consequences.

China is surrounded by large regional competitors with much higher fertility rates (India, Pakistan, etc.). China has had conflict with one in the past (India). The other (Pakistan) is currently an economic and military ally of China owing to proximity and a common rival (India). But Pakistan’s government is hardly in control of its population which is growing rapidly.

Throw Indonesia (also growing rapidly) into the mix and there are going to be a LOT MORE people competing for limited resources in and around China.

China must turn its fertility rate around soon.  An ageing population shifts the ratio of worker to retiree and pushes social costs upward.   China’s GDP per capita is only 15% of the U.S., which means the burden per worker is much worse than in the Unites States (each worker in China must provide for a much larger number of aging retirees as opposed to their counterparts in the US).

Productivity can boost an economy, but in the end you need new people and a new child today takes at least 20 years to become a productive worker and form a new household.

What does this mean for investors?

Two things:

1)   In the near-term, China will engage in capital investment (the substitution of capital, technology and information for labor) to drive economic growth. This means the Chinese Government throwing money at the manufacturing, information technology and healthcare sectors in its economy.

2)   Long-term, China will face geopolitical challenges from its neighbors most of whom are experiencing rapid population growth. Simply put there will be a lot more people competing for a very limited number of resources (China already imports much of its agriculture and natural resources).

Respectfully submitted,

Tom Langdon


Posted by Phoenix Capital Research in It's a Bull Market

The Single Biggest Reason Most Investors LOSE Money

It’s almost never openly admitted in public, but the reality is that few if any investors actually beat the market in the long-term.

The reason for this is that most of the investment strategies employed by investors (professional or amateur) simply do not make money.

I know this runs counter to the claims of the entire financial services industry. But it is factually correct.

In 2012, the S&P 500 roared up 16% including dividends. During that period, less than 40% of fund managers beat the market. Most investors could have simply invested in an index fund, paid less in fees, and done better.

If you spread out performance over the last two years (2011 and 2012) the results are even worsen with only 10% of funds beating the market.

If we stretch back even further, the results are even more dismal. For the ten years ended 1Q 2013, a mere 0.4% of mutual funds have beaten the market.

0.4%, as in less than half of one percent of funds.

These are investment “professionals,” folks whose jobs depend on producing gains, who cannot beat the market for any significant period.

The reason this fact is not better known is because the mutual fund industry usually closes its losing funds or merges them with other, better performing funds.

As a result, the mutual fund industry in general experiences a tremendous survivor bias. But the cold hard fact what I told you earlier: less than half of one percent of fund managers outperform the market over a ten-year period.

So how does one beat the market?

Cigar Butts and Moats.

“Cigar butts” was a term used by the father of value investing, Benjamin Graham, to describe investing in companies that trade at significant discounts to their underlying values. Graham likened these companies to old, used cigar butts that had been discarded, but which had just one more puff left in them.

Like discarded cigar butts, these investments were essentially “free”: investors had discarded them based on the perception that they had no value.

However, many of these cigar butts do in fact have on last puff in them. And for a shrewd investor like Benjamin Graham, that last puff was the profit potential obtained by acquiring these companies at prices below their intrinsic value (below the value of the companies assets plus cash, minus its liabilities).

Graham used a lot of diversification, investing in hundreds of “cigar butts” to produce average annual gains of 20%, far outpacing the S&P 500’s 12.2% per year over the same time period.

So when I say that you can amass a fortune by investing in Cigar Butts, I’m not being facetious. For this reason, cigar butts, or deeply undervalued companies, will be a focus of this newsletter. And like Benjamin Graham, we’ll only be holding these companies in the short-term: until they reach their intrinsic value.

The other term, “moats” is in reference to the investments Warren Buffett, a student of Ben Graham and arguably the greatest living investor, seeks out…

Buffett amassed his enormous fortune through a systematic investment philosophy consisting of a few key ideas. However, the single most important one was buying companies with “moats” around them meaning that they have a competitive advantage that stops competitors from breaking into their market share.

Our new newsletter Cigar Butts & Moats focuses exclusively on these two types of investments. We only invest in deeply undervalued “cigar butts” or companies with economic “moats” around them.

So far in 2013, we’ve invested in three “Cigar Butts” and three “Moats.”

As far as the “Moats” are concerned, we closed out one for a 28% gain in less than a month. Another one is up over 15%. And the third is down just 9% (which honestly has only made it that much more attractive as we believe the upside is easily 50%+).

Of our Cigar Butts, two are break even (we only opened them last week). And the other one is down 19% (due to it issuing shares, not a change in its fundamental business).

By the way, that 19% loser is now trading at over 35% below its book value and yields 12%.

This is the beauty of investing in Cigar Butts and Moats: you have such a wide margin of safety that if a company temporarily trades down, you actually end up wanting to buy MORE.

To find out what these companies are all you need to do is take out an annual subscription to Cigar Butts & Moats.

The price of an annual subscription is just $79.99.

For that price you get:

* 12 monthly issues of Cigar Butts & Moats

* All of our Special Investment Reports outlining special investment opportunities you won’t hear about anywhere else.

* Real time investment updates as needed

All of this for just $79.99

To take out an annual subscription to Cigar Butts & Moats…

Click Here Now!

Yours in Profits,

Graham Summers

Editor

Cigar Butts and Moats


Posted by Phoenix Capital Research in It's a Bull Market

The Fed Has Juiced the System in 55.5 of the Last 60 Months

The markets have been extremely quiet the last few days. With the exception of the hard selling that occurred on Thursday it’s been a snooze fest.

The reason for this is that no one wants to commit heavily to a position at the moment. We’re all well aware of the negatives the market is facing, namely declining earnings, a weakening economy, the decreasingly marginal effect of Fed intervention, etc.

However, no one wants to commit heavily to shorting the markets because they’re all too afraid that the Fed or “someone” will step in to prop up the markets should any significant drop occur.

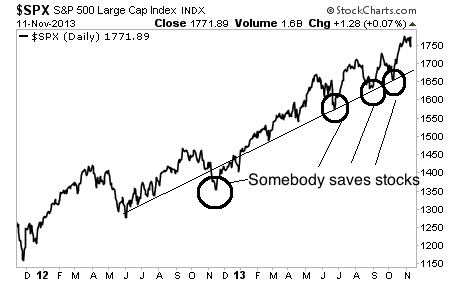
This has happened repeatedly in the last year: every time the market began to crumble and take out support, “someone” stepped in a started buying. And soon stocks were back off to the races.

At this point we all know that the “someone” is the Fed. Numerous Fed officials have pointed to the rising stock market as a sign that Fed intervention has been “successful.”

Moreover, the Fed has barely left the markets alone since 2008.

If you go back to the first announcement of QE 1 in November 2008, there have only been two periods in which the Fed wasn’t engaging in direct monetary interventions its balance sheet between the end of QE 1 and the launch of QE 2 (June 2010-November 2010) and from the end of QE 2 until the launch of Operation Twist (June 2011-September 2011).

A total of 60 months have passed since the Fed announced QE 1. The Fed was not engaged in major monetary interventions in only six months out of these 60. Put another way, the Fed has been actively intervening to the tune of billions of dollars in 90% of ALL months since it began QE 1.

Even during the brief periods in which the Fed wasn’t officially engaging in a major monetary program, it still routinely expanded its balance sheet during options expiration week every month.

If you remove those weeks from the periods in which the Fed wasn’t officially engaging in a program, you’re left with a total of just 4.5 months in which the Fed wasn’t actively pumping the markets.

That’s 4.5 months out of 60, or less than 8%.

However, this is not to say that this Fed intervention is not creating tremendous opportunities for stock pickers. After all with the Fed juicing stocks to this degree, there is no shortage of mis-pricings in high quality companies.

Indeed, recently, subscribers of our value stock picking newsletter Cigar Butts & Moats  locked in a 28% gain on our latest stock pick in less than one month.

We did this by buying a deeply undervalued business. Based on its market valuation, this company could easily take itself private, using the cash generated from operations to pay the loan required to buyback all of its shares on the open market.

In fact, this business was so cheap that it could do this even if its earnings fell in HALF.

That’s one heck of a margin of safety. We bought on October 3 2013. And we closed out on October 23 2013 for a 28% gain.

Over the same time period, the S&P 500 rose just 4%.

This is how to make a killing in the market today: by focusing on value stock picking. It’s the very reason we launched Cigar Butts & Moats.

The price of an annual subscription to Cigar Butts & Moats is just $79.99.

For that price you get:

  • 12 monthly issues of Cigar Butts & Moats
  • Our proprietary deep value Investment Special Report How to Make a Fortune With Value Investing (a $199 value) which outlines specifically how Warren Buffett made his fortune investing in stocks.
  • All of our other Special Investment Reports outlining special investment opportunities.
  • Real time investment updates as needed (like the one that told investors to lock in a 28% gain).

All of this for just $79.99.

To take out an annual subscription to Cigar Butts & Moats…

Click Here Now!

Best Regards

Phoenix Capital Research


Posted by Phoenix Capital Research in It's a Bull Market

How We’re Finding Value In the Markets Today

The following is an excerpt from our most recent Cigar Butts & Moats newsletter.

One of the primary themes of our articles over the last few months has been the potential of a major market top forming. We now have what I can only call “numerous bells” ringing.

First and foremost, I want to alert you to a disturbing trend in stock mania. That trend pertains to money inflows to stock mutual funds.

One of the best means of gauging investor sentiment for individual investors pertains to how they move their money in and out of mutual funds.

For example, from 2007 until the end of 2012, investors pulled over $405 billion out of stock based mutual funds. Over $90 billion of this was pulled in 2012 alone: the largest withdrawal since 2008.

In contrast, over the same time period, investors put over $1.14 trillion into bond funds. They brought in $317 billion in 2012: again, this was the most since 2008.

This marks quite a reversal of asset class fund flows: before 2008, stock funds usually took in $2 for every $1 investors allocated to bond funds.

However, this trend reversed back to normal in 2013. The Fed finally succeeded in inducing investors to move into stocks again. And they have done so in a big way. Thus far in 2013, investors have put $277 billion into stock mutual funds.

This is the single largest allocation of investor capital to stock based mutual funds since 2000: at the height of the Tech bubble. That year, investors put $324 billion into stocks. We might actually match that inflow this year as we still have two months left in 2013.

Indeed, investors are reaching a type of mania for stocks. They put $45.5 billion into stock based mutual funds in the first five weeks of October. If they maintain even half of that pace ($22.75 billion) for November and December, we’ll virtually tie the all-time record for stock fund inflows in a single year.

That record, again, occurred in 2000. At that time the NASDAQ had just staged a massive bubble rally.

What followed was one of the worst market collapses of all time:

However, this is not to say that there are not tremendous opportunities for stock pickers in this environment.

Indeed, recently, subscribers of our value stock picking newsletter Cigar Butts & Moats  locked in a 28% gain on our latest stock pick in less than one month.

We did this by buying a deeply undervalued business. Based on its market valuation, this company could easily take itself private, using the cash generated from operations to pay the loan required to buyback all of its shares on the open market.

In fact, this business was so cheap that it could do this even if its earnings fell in HALF.

That’s one heck of a margin of safety. We bought on October 3 2013. And we closed out on October 23 2013 for a 28% gain.

Over the same time period, the S&P 500 rose just 4%.

This is how to make a killing in the market today: by focusing on value stock picking. It’s the very reason we launched Cigar Butts & Moats.

The price of an annual subscription to Cigar Butts & Moats is just $79.99.

For that price you get:

  • 12 monthly issues of Cigar Butts & Moats
  • Our proprietary deep value Investment Special Report How to Make a Fortune With Value Investing (a $199 value) which outlines specifically how Warren Buffett made his fortune investing in stocks.
  • All of our other Special Investment Reports outlining special investment opportunities.
  • Real time investment updates as needed (like the one that told investors to lock in a 28% gain).

All of this for just $79.99.

To take out an annual subscription to Cigar Butts & Moats…

Click Here Now!

Best Regards

Phoenix Capital Research


Posted by Phoenix Capital Research in It's a Bull Market

The Definitive Proof That QE is Not Effective At Creating Jobs

For over four years now, the mainstream media continues to parrot the Federal Reserve’s assertion that QE is in fact a monetary tool that will create jobs.

This assertion overlooks Japan, where QE efforts equal to over 25% of GDP have failed to improve the unemployment situation significantly, as well as the UK where QE efforts equal to over 20% of GDP have proven similarly ineffective.

We now can definitively add the US to the list of QE failures.

It’s been 14 months since the Fed announced QE 3 and nearly 12 months since it announced QE 4: both open ended programs that have run continuously since they were announced.

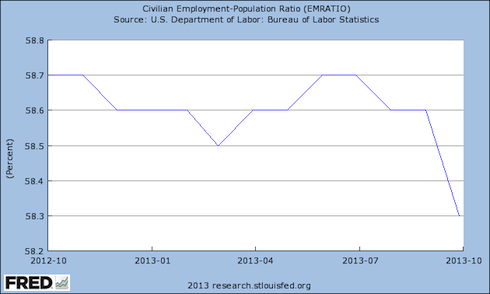
And yet through this period the employment population ratio (which measures the percentage of working age adults who are in fact employed) has in fact FALLEN.

The above graph shows in clear terms that the US is not creating jobs at a rate that can account for population growth. QE 3 and QE 4 have failed to have any significant effect. In fact, if you consider that the chart has dropped dramatically in the last quarter (giving QE 3 and QE 4 a year to have an effect) one can definitively say that QE has been a total failure as far as jobs growth is concerned.

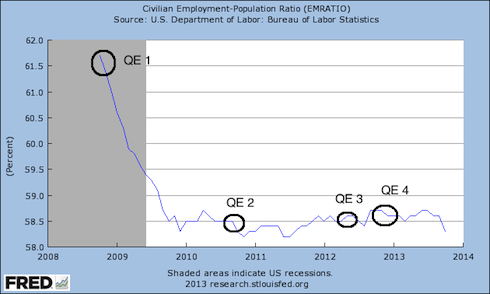
This is nothing new. If you look at the five-year chart you cannot with a straight face say QE has succeeded in any meaningful way.

QE does not create jobs. It has been a total failure. And yet, five years after the Fed embarked on this policy we continue to hear people talk about how the real problem is that we need MORE QE.

QE failed for Japan. It has failed for the UK. It ha failed for the US. Collectively, countries comprising over a third of the world’s GDP have proven QE doesn’t work.

However, this is not to say that there are not tremendous opportunities for stock pickers in this environment.

Indeed, recently, subscribers of our value stock picking newsletter Cigar Butts & Moats  locked in a 28% gain on our latest stock pick in less than one month.

We did this by buying a deeply undervalued business. Based on its market valuation, this company could easily take itself private, using the cash generated from operations to pay the loan required to buyback all of its shares on the open market.

In fact, this business was so cheap that it could do this even if its earnings fell in HALF.

That’s one heck of a margin of safety. We bought on October 3 2013. And we closed out on October 23 2013 for a 28% gain.

Over the same time period, the S&P 500 rose just 4%.

This is how to make a killing in the market today: by focusing on value stock picking. It’s the very reason we launched Cigar Butts & Moats.

The price of an annual subscription to Cigar Butts & Moats is just $79.99.

For that price you get:

  • 12 monthly issues of Cigar Butts & Moats
  • Our proprietary deep value Investment Special Report How to Make a Fortune With Value Investing (a $199 value) which outlines specifically how Warren Buffett made his fortune investing in stocks.
  • All of our other Special Investment Reports outlining special investment opportunities.
  • Real time investment updates as needed (like the one that told investors to lock in a 28% gain).

All of this for just $79.99.

To take out an annual subscription to Cigar Butts & Moats…

Click Here Now!

Best Regards

Phoenix Capital Research


Posted by Phoenix Capital Research in It's a Bull Market

What Japan’s Game Plan Means For Investors Going Forward

Editor’s Note: Tom Langdon (a pseudonym) is a former intelligence officer and Wall Street trader with over 25 years of experience advising institutional clients, government officials and business executives. Previously selected by the Wall Street Journal for its “Best of the Street” stock pickers and singled out multiple times by the Institutional Investor All America Research Team, Tom has a lengthy track record of making major calls and showing investors (both institutional and private) how to outperform the markets with minimal risk.

Governments are on a short leash – globally.

Five plus years after the Great Recession few populations are satisfied with their governments and new parties and movements continue to emerge, whether the Tea Party (US), AfD (Germany), Aam Aadmi Party (India), and unfortunately violent groups like Golden Dawn (Greece).

We see major issues in most political arenas primarily as a result of the political instability. Whether we consider the US, the EU, India, or China, all major regimes are finding themselves more accountable to populations that are growing increasingly dissatisfied with the status quo.

Japan is the exception

Prime Minister Shinzo Abe actually has a mandate and a game plan. The world can squabble about this plan, but at the end of the day, everybody else has used their paper currency as a weapon, or tried to, and Japan is taking its turn.

For investors, the question is whether you think the move in the Yen and the Nikkei is sustainable.  Our answer is unequivocally yes.  Prime Minister Abe learned some lessons from his first run as PM – which ended after one year in 2007 – and is riding high in popularity at 60% – an almost unheard of level for a Japanese politician.

Challenges will come – he will likely seek to leverage control of both houses of Japanese Parliament into reforms in labor, agriculture, healthcare and women in the workplace – all sorely needed in a country with a low birth rate and no desire to assimilate immigrants.

We like to swim downstream.  Investors do well when nations put sound long-term economic policies in place, and likewise profitable trades can be realized when governments or ministries make moves that can help the short term.

Japan’s export industries managed to survive a currency that appreciated by 30% over a decade while others depreciated – which means their cost structures are lean as hell – and you can expect them to compete more effectively with the currency wind going the other way.

Indeed, a Japanese process control manufacturer, which we track closely because of our management access and information quality, recently reported a 20% sales increase, largely because of currency.

Because nearly all its cost structure is denominated in Yen, the cost of goods sold and SG&A only rose 15-16% and allowed operating profit to increase by over 80%!  Needless to say, no Western industrial executive we speak to had a similar result to report.  That sort of thing makes Japanese stocks rise and boosting the savings and happiness of Japanese investors/voters.

Abe-nomics is not without its problems, but it is greatly boosting corporate profits in Japan. This remains a dominant theme for us going forward as we look for investment opportunities.

Sincerely,

Tom Langdon


Posted by Phoenix Capital Research in It's a Bull Market

How to Stockpick in an Overvalued Market

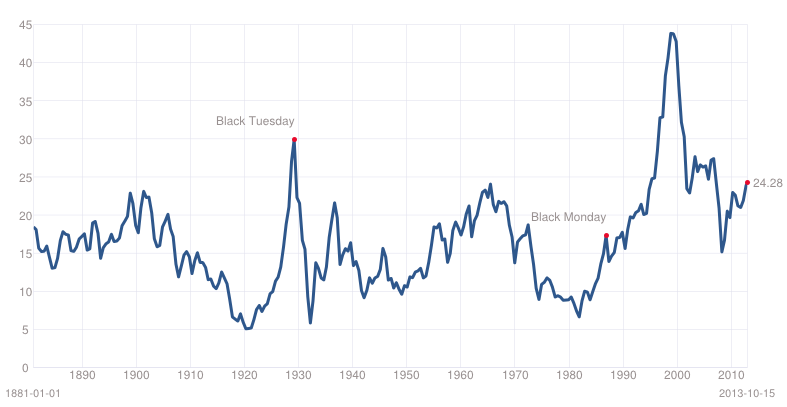
The market is overpriced, to be sure. I’m gauging this on the single most important valuation metric in finance: the cyclically adjusted price-to-earnings ratio or CAPE ratio.

Generally speaking, most investors price a company based on its current Price to Earnings or P/E ratio. Essentially what you’re doing is comparing the price of the company today to its ability to produce earnings (cash).

However, corporate earnings are heavily influenced by the business cycle.

Typically the US experiences a boom and bust once every ten years or so. As such, companies will naturally have higher P/E’s at some points and lower P/E’s at other. This is based solely on the business cycle and nothing else.

CAPE adjusts for this by measuring the price of stocks against the average of ten years’ worth of earnings, adjusted for inflation. By doing this, it presents you with a clearer, more objective picture of a company’s ability to produce cash in any economic environment.

I mentioned before that CAPE is the single most important metric for long-term investors. I wasn’t saying that for impact.

Based on a study completed Vanguard, CAPE was the single best metric for measuring future stock returns. Indeed, CAPE outperformed

  1. P/E ratios
  2. Government Debt/ GDP
  3. Dividend yield
  4. The Fed Model,

…and many other metrics used by investors to predict market value.

So what is CAPE telling us today?

Today the S&P 500 has a CAPE of over 24.  This means the market as a whole is trading at 24 times its average earnings of the last ten years.

Put another way, if you bought the entire stock market today, it would take you roughly 24 years to make your money back.

That’s expensive. Indeed, the market has only been this expensive a handful of times in the last 100+ years. Every time we’ve been closer to a market top than a new bull market run.

However, this is not to say that there are not tremendous opportunities for stock pickers in this environment.

Indeed, recently, subscribers of our value stock picking newsletter Cigar Butts & Moats  locked in a 28% gain on our latest stock pick in less than one month.

We did this by buying a deeply undervalued business. Based on its market valuation, this company could easily take itself private, using the cash generated from operations to pay the loan required to buyback all of its shares on the open market.

In fact, this business was so cheap that it could do this even if its earnings fell in HALF.

That’s one heck of a margin of safety. We bought on October 3 2013. And we closed out on October 23 2013 for a 28% gain.

Over the same time period, the S&P 500 rose just 4%.

This is how to make a killing in the market today: by focusing on value stock picking. It’s the very reason we launched Cigar Butts & Moats.

The price of an annual subscription to Cigar Butts & Moats is just $79.99.

For that price you get:

  • 12 monthly issues of Cigar Butts & Moats
  • Our proprietary deep value Investment Special Report How to Make a Fortune With Value Investing (a $199 value) which outlines specifically how Warren Buffett made his fortune investing in stocks.
  • All of our other Special Investment Reports outlining special investment opportunities.
  • Real time investment updates as needed (like the one that told investors to lock in a 28% gain).

All of this for just $79.99.

To take out an annual subscription to Cigar Butts & Moats…

Click Here Now!

Best Regards

Phoenix Capital Research


Posted by Phoenix Capital Research in It's a Bull Market

The Three Trends Investors Need to Be Aware Of

Here’s the news worth knowing about today:

1)   Europe is not fixed. The EU just announced record high unemployment with unemployment numbers rising nearly one million thus far in 2013.Greece, which was hoping to increase taxes or grow its way out its debt problems has just revealed that over 500,000 companies cannot pay their taxes (up from 182,000 last month). So much for the “Europe is fixed” theme.

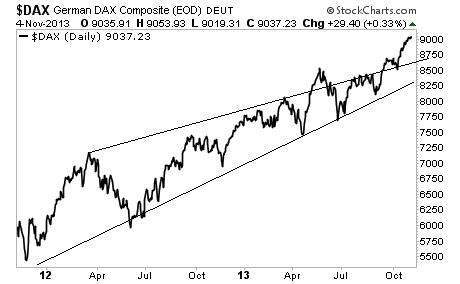
We believe the crisis will re-emerge later in 2013 or early 2014. The key item to watch is the German Dax. Whenever it comes back to test the upper trendline in the chart below, things will start getting messy again.

2)   China is engaging in the same taper/no-taper verbal interventions as the US. The Chinese premiere warned against loose monetary policy last night and China’s market dropped.

The People’s has a major problem on its hands (several actually). The primary one pertains to inflation. China has flooded its financial system with credit and easy money in ways that Ben Bernanke never dreamed of.

As a result of this inflation is rising, which leads to wage strikes, which erases profit differentials between China and other manufacturing centers, which leads to manufacturers pulling out of China, which results in a weaker Chinese economy, which results in the need for more credit to sustain growth and finance more projects.

This has resulted in a sideways Chinese stock market with every new flood of liquidity kicking off rallies and every talk or taper or tightening causing corrections. At some point this will break and we’ll either collapse or skyrocket depending on whether we see a debt deflationary collapse or a debt deflationary collapse accommodated by rampant monetization which would result in a  Zimbabwe-esque stock market rally.

3)   In the US, the housing market is definitively in a bubble. And it is once again popping.

Over 50% of all home purchases are cash only. In California, the amount of median income needed to buy a home is virtually identical to the Bubble Years of 2005-2006.

Mortgage applications are plunging and sales are stalling (we’ve been flat for two months but are down 27% since June). Be aware of this. Homebuilder stocks seem to be sensing something is amiss. We’ve been moving sideways since the peak in May 2013.

These are the trends to be away of.

Best Regards

Phoenix Capital Research

Posted by Phoenix Capital Research in It's a Bull Market

Would You Like to Buy This Business?

Dear Investor,

I have a business I would like to sell you.

Let’s run over the numbers first.

First and foremost, I have to be honest, this business has not implemented a budget in five years. I know that seems like an insane way to run a business, but I can assure you that management is comprised of highly intelligent, ethical people.

These folks would never take advantage of shareholders. They’re all highly educated. And their corporate presentations and conference calls are extremely well written. Trust me, they know what they’re doing.

Having said that I also need to disclose that this business hasn’t been growing much at all. Indeed, it hasn’t even maintained annual growth of 3% in the last five years. On top of this, management has been caught fudging the company’s financials by several outside auditors. An honest assessment of its topline shows zero growth for the last few years.

I know I mentioned before that management are highly ethical. I can assure you they have a good reason to overstate their growth numbers: if the numbers reflected reality, they’d all be fired! We can’t have that can we? So they just “massage” things a bit to make the company’s growth look better than it is and to downplay the rise in costs that are squeezing its margins.

Speaking of which, this company isn’t profitable. In fact, it hasn’t been profitable for five years… actually it has only been profitable a few years out of the last five decades. And those years were “profitable” based on some really massaged numbers.

I know this sounds strange, but those honest folks in management think the best means for this company to grow is to spend way more than the company makes in its topline revenues. Sounds weird, I know. But again, these are very intelligent and ethical people. And none of the analysts covering the company ever ask about this. So what’s the problem?

Oh, and I almost forgot, the company has debt. A lot of it. Currently its debt is running north of 100% of its total market cap. Of course, this is based on some unusual accounting practices. If this company actually followed GAAP accounting rule for its pension expenses its debt load if over 400% of its market cap.

So, would you like to buy this business? How much would you pay for it?

Oh, I understand, you’d like to do some more due diligence. OK, I’ll give you this company’s stock symbol so you can look at its filings (good luck finding accurate ones). Do you have a pen and paper ready? OK the stock symbol is:

USA.

Our new Special Investment Report titled, Preparing For a US Debt Crisis, is now available to the public.

In its 8 pages we outline the specifics of the US’s debt situation… and what it means for investors and the economy going forward.

More importantly, we detail which investments will perform best during a Debt Crisis in the US, including which stocks offer the best means of stabilizing one’s portfolio during this volatile time… as well as two unique hedges against rising interest rates.

Preparing For a US Debt Crisis, is priced at a $99 value, but we are giving it away for FREE to those who join our new daily market commentary, Gains Pains & Capital Deluxe.

Gains Pains & Capital Deluxe is our new daily market commentary featuring macro-economic analysis, market insights, trading tips, investment ideas, and interviews with investing legends.

It also comes with a “no marketing” guarantee. No advertising, no sales, nothing but solid market insights.

A subscription to Gains Pains & Capital Deluxe costs $7.99 per month.

Sign up today and receive a FREE copy of our new Special Investment Report Preparing For a US Debt Crisis (a $99 value) FREE OF CHARGE.

To join Gains Pains & Capital Deluxe

Click Here Now!!!

Best Regards,

Phoenix Capital Research


Posted by Phoenix Capital Research in It's a Bull Market

Bad News For Bulls, But GREAT News For Traders

Investors need to be aware of a significant dynamic emerging in the markets.

That dynamic is one of corporations missing revenues estimates while beating earnings estimates.

The majority of investors focus on earnings when it comes to valuing the stock market or an individual stock. Indeed, Price to Earnings or P/E ratios might be the single most popular stock valuation metric in the world.

However, there is a danger to pricing the market based on earnings alone. Earnings can be massaged in countless ways to beat estimates. You can release loan loss reserves, massage depreciation numbers, implement one time charges or writedowns, reprice bonds, etc.

Indeed, a study performed by Duke University found that roughly 20% of publicly traded firms manipulate their earnings to make them appear better than they really are. The folks who were surveyed for this study about this practice were the actual CFOs at the firms themselves.

For this reason, when you look at the markets, you need to look at how many companies are beating sales estimates as opposed to simply earnings estimates.

Unfortunately the news is not particularly good for this today. As Bloomberg notes, of those companies who have reported results so far in 3Q13, only 38% of S&P 500 companies are beating revenues estimates. This follows just 46% who beat in 2Q13 and only 37% who beat in 1Q13.

Bloomberg notes that this is the first time there have been three consecutive quarters of less than 50% of corporations beating revenues estimates going back to 2009.

Moreover, taken as a whole, the market is trading at a Price to Sales ration of 1.6. Historically, before we entered the period of Fed-induced serial bubbles, the market has traded at an average of 0.8.

So the market is expensive. And the most sensitive economic indicator (sales) are falling and failing to beat estimates.

But this doesn’t mean there are no incredible opportunities to make money in the markets today.

It does mean that investors will have to look beyond simply “buy and hold” strategies (the P/S ratio predicts real annual returns of 2.6% going forward) to accomplish outsized returns.

Our Options day trading newsletter, THE PERFECT TRADE was designed for precisely this.

THE PERFECT TRADE uses options to juice the returns from small, but predictable market patterns. And boy does it work. Year to Date THE PERFECT TRADE’s model portfolio is up over 200%.

Indeed, 11 of out last 13 trades have made money, including gains of 24%, 46%, 33% and an incredible 129% just earlier this week.

If you’d traded just $10K based on our recommendations, you’d be up over $30K today… just from 2013 alone.

However, we’ll soon be closing this product to the public. We simply cannot produce these returns with thousands of traders following this system.

So this Friday at midnight, the doors close on THE PERFECT TRADE.

AT THAT TIME WE WILL NO LONGER ACCEPT NEW CLIENTS. ANYONE WHO WANTS TO SUBSCRIBE WILL HAVE TO WAIT UNTIL ONE OF OUR CURRENT CLIENTS’ SUBSCRIPTIONS EXPIRE A YEAR FROM NOW.

SO if you want in on THE PERFECT TRADE you have just a little over 24 hours to subscribe. Because after that it will be too late.

To take out a subscription to THE PERFECT TRADE

CLICK HERE NOW!!!

Phoenix Capital Research


Posted by Phoenix Capital Research in It's a Bull Market

How to Double Your Money in 10 Months

Today I’m going to show you how to trade the market successfully.

It is commonly thought that in order to trade and make money in the markets, you need to trade all asset classes. I am always asked by people, “what do you think of Gold? Is the Dollar going up or down? What are you trading today?” and on and on from subject to subject.

The biggest problem with this is that it is hard enough to get good at trading just one item, let alone trading multiple items at once. Trading multiple asset classes requires a level of sophistication and understanding that 99% of folks simply do no have (you’ll note that even Wall Street traders tend to specialize in one asset class or theme).

So forget about becoming a “Master of the Universe.” Trading is not about having your money in every asset class under the sun (I’m talking about trading not investing here).

No, to be a successful trader, all you need to focus on is making money. And the easiest way to make money trading the markets is to find one thing that works and keep doing it.

I’m speaking from experience here. The Perfect Trade newsletter which I write, trades options on just one ETF. It sounds boring, but there is nothing boring about the profits.

On average, The Perfect Trade makes money 80% of the time. By focusing on this ONE trade and by using strict discipline in terms of position sizing and stop losses, we have produced a REAL return on invested capital of 160% so far this year.

That’s correct, 10 months into 2013 we have already more than doubled our money. In the last two months alone we’ve seen the following results:

Date Gain/ Loss
7/24/13 12.90%
7/30/13 -31.58%
8/6/13 46.15%
8/13/13 24.07%
8/20/13 33.80%
8/27/13 17.65%
9/3/13 -24.66%
9/11/13 2.20%
9/18/13 35.71%
9/26/13 -36.11%*
10/9/13 8.33%
10/15/13 12.05%
10/22/13 5.45%

It’s impossible to avoid losers. But by using careful position sizing (the * above was a trade where we used 25% of our usual position based thus minimizing the dollar losses) we’ve have a terrific run.

The rest of 2013 has been just as good. Like I said, we’re up over 160%.

In fact, this newsletter has gathered so much momentum that we’re closing the door to new subscribers this Friday at midnight. We simply cannot continue to produce these returns with a large client list.

So on Friday at midnight, we will no longer be accepting new orders for this newsletter.

So if you are interested in joining this newsletter you have until Friday at midnight.

After that the doors are closed and we will not be accepting any future subscriptions

To join now…

Click Here Now

Graham Summers


Posted by Phoenix Capital Research in It's a Bull Market

How to Accurately Value a Company (Hint, Not Through P/E Ratios)

The following is an excerpt from our value investing newsletter Stock Picker Elite

On that note, I want to point out that some of the best businesses in the world are beginning to approach valuations that are attractive (see Figure 1 below).

In terms of valuing a company, there are two key metrics I like. One is Enterprise Value (EV) divided by Earnings Before Taxes Interest Depreciation and Appreciation (EBITDA) or EV/ EBITDA.

I prefer this metric to the more traditional Price to Earnings (P/E) valuation metric because both Price (Market Cap) and Earnings are not very accurate measurements of a company’s health.

Regarding price, consider the following… a company that has a market cap of $10 billion, earnings $2 billion, has $2 billion in cash and has $9 billion in debt will look cheap with a P/E of 5… even though its debt load could bankrupt it.

Enterprise Value clears this issue up by including a company’s debt and cash on hand in the valuation process: EV is a company’s market cap, plus its debt, minus its cash. As such it is a much closer approximation of a company’s health than market cap.

Regarding earnings, as I noted in last issue of Cigar Butts & Moats there are dozens and I literally mean dozens of ways to craft earnings to be better than reality.

For that reason I prefer Earnings Before Taxes Interest Depreciation and Appreciation (EBITDA) as a metric for a company’s earning potential.

I realize this term sounds confusing, but EBITDA is essentially the money a company generates before it pays taxes or manipulates the value of the assets on its balance sheet. As such it’s a much cleaner representation of the cash a company generates.

Thus, EV/ EBITDA is a much better valuation metric than P/E. For that reason I’ve priced the businesses in Figure 1 by EV/ EBITDA.

Another term you need to know about is earnings yield. For those of you who are unfamiliar with earnings yield, this is essentially a ratio made by dividing a company’s Earnings Per Share by its Price Per Share.

I like to use this ratio relative to the yield on the ten-year Treasury (which is considered risk free) to asset the benefit of owning a stock. Given the increased risk of owning a stock, the earnings yield should be dramatically higher than the yield on the Ten Year Treasury.

However, the cash a company generates does not necessarily equal the cash it pays its owners. So I also like to consider a businesses’ dividend yield relative to the yield on the Ten Year Treasury as well.

These three metrics (EV/ EBITDA, Earnings Yield, Dividend Yield) can be used to give a decent “back of the envelope” assessment of the value of a stock.

As you can see in Figure 1 above, some of the best businesses in the world are beginning to trade at attractive valuations from an EV/EBITDA and Earnings Yield perspective.

However, the dividend yield is generally less attractive for most of these companies than the yield on the Ten Year Treasury. And given that stocks are far more volatile, I believe there is simply too much risk here relative to the cash reward for owning them at this time.

I bring all of this up, because I want to make you aware that the bargain basement sale I predicted last issue is only just beginning. And while it is tempting to start backing up the truck to invest, we need to consider the old adage that the fact a stock is cheap doesn’t mean it cannot get cheaper.

Between the low dividends and the risk to the global economy I’ve outlined in last issue, these valuations, while attractive, are not nearly as attractive as I’d like.

When you can buy a business like Apple at a dividend yield of 4+% at a time when the 10 Year Treasury is yielding 2.0% or less, THEN it’s time to go shopping based on the potential risk reward.

This time is coming. But it’s not here yet. The macro picture for the world is dangerous. And high quality companies will not be spared the carnage if a market onslaught begins (which is looking increasingly likely).

Stock Picker Elite is our long-term value-investing newsletter based on the investment methodologies of the Godfather of value investing, Benjamin Graham, and his legendary pupil Warren Buffett.

We launched Stock Picker Elite in May 2013. Since that time we’ve outperformed the stock market every year, often by double digits.

A subscription to Stock Picker Elite costs $99.99 and comes with:

  • 12 monthly issues of Stock Picker Elite
  • Our Special Report How to Make a Fortune With Value Investing which outlines how Warren Buffett and Benjamin Graham did what they did (a $199 value).
  • Real time investment alerts as needed

All just for $99.99 per year.

To sign up for Stock Picker Elite

Click Here Now!!!

Best Regards

Phoenix Capital Research


Posted by Phoenix Capital Research in It's a Bull Market

Was the Debt Ceiling Crisis a Lie?

The US can now collectively breathe a sigh of relief that we’ve averted the “debt ceiling debacle.”

The only problem is that this entire “crisis” was a lie. The US actually hit its debt ceiling back in May 2013, a full five months ago.

At that time neither the Treasury Department, nor the White House, nor Congress talked about this.

So for five months, the US debt level was frozen. The reason was because the Treasury was resorting to “extraordinary measures” to keep us below the debt ceiling. It’s interesting that no one in the media talked about this, nor that anyone seemed to care at all.

Then, suddenly we had yet another “crisis” in which the world would literally end if the political class didn’t get their way. The US would default if we don’t spend more money now!

Our President and other political “leaders” fussed about this for two weeks and basically wasted all of our time. The whole exercise was totally pointless outside of setting up an “issue” on which to campaign for the 2014 Congressional elections.

How do I know it was pointless?

Because the deal they made doesn’t raise the debt ceiling. All it did was make the debt ceiling unenforced for a few months… until February 17 2014 specifically.

So we hit the debt ceiling in May… manufactured a crisis in October… just to ignore the issue another three months…

THIS is the state of Government in the US today. The fact the media in this country goes along with this as “news” tells you everything you need to know about the “objectivity” of the fifth estate.

If you want to talk about a real debt crisis, let’s talk about the US Federal Reserve.

The Fed’s current balance sheet is $3.86 trillion. It will be over $4 trillion before the end of 2013 and over $5 trillion before the end of 2014.

THE FED is the debt problem. It is allowing the deficit and the debt to swell like this for the sake of benefiting a handful of banks and screwing the economy. QE doesn’t create jobs. It never has.

If you’re looking for actionable investment strategies on playing the markets, take a look at my monthly investment newsletter, Private Wealth Advisory.

Published on the third Wednesday of every month after the market closes, Private Wealth Advisory, shows individual investors how to beat the market with well-timed unique investments.

To whit Private Wealth Advisory is the only newsletter to have shown investors 72 straight winning trades and no losers during a 12-month period.

Indeed, in the last two months alone we’ve locked in gains of 8%, 12%, 21% and even 28%... with an average holding period of 3-4 weeks.

To find out more about Private Wealth Advisory and how it can help you beat the market with your investments…

Click Here Now!

Best Regards

Graham Summers


Posted by Phoenix Capital Research in It's a Bull Market

What the “Deal” Means for the Markets

The big news as far as the markets are concerned is the Government reopening and the debt ceiling being extended. The debt ceiling technically was hit last May but no one bother to discuss that in the media. Why let a potential good crisis go to waste?

So the “debt ceiling” debate was pushed back to February 17 2014… just in time for the usual BS political campaigns to start for the 2014 Congressional elections. Honestly, if the whole situation wasn’t so pathetic it’d be amusing.

The markets have largely priced in a resolution at this point which is why they’re pulling back this morning. Gold and the precious metals are up significantly and the US Dollar is falling.

We’re now at support on the US Dollar. Let’s hope it holds.

Between this development and the nomination of Janet Yellen to Fed Chair, the monetary backdrop for the US will be more spending and more monetization. Yellen is yet another academic with no banking or business experience what-so-ever. This makes three in a row (Greenspan, Bernanke, and now Yellen). The results speak for themselves.

By the way, I continue to hear how great the Fed is for stocks. However, since we were taken off the Gold standard Gold has outperformed stocks dramatically. In fact the only period in which stocks outperformed Gold as an asset class was the Tech Bubble.

We offer a Special Report on how to purchase Gold Bullion safe and securely with every subscription to Private Wealth Advisory. In it we outline why every investor should have some exposure to bullion, how to buy it and the key questions you should ask every bullion deal.

Along with this report, every Private Wealth Advisory subscription comes with:

  1. The Inflation Secrets Your Broker Won’t Tell You About.
  2. The Secret FDIC Legislation That Puts Your Savings At Risk.
  3. 12 monthly issues of Private Wealth Advisory.
  4. Real time investment alerts to Buy and Sell our recommendations as needed.

All this for $179.99… to subscribe to Private Wealth Advisory…

Click Here Now!

Best Regards

Phoenix Capital Research


Posted by Phoenix Capital Research in It's a Bull Market

The Clear Evidence That Gold Is Being Manipulated Lower

At this point the Gold manipulation is outright absurd.

For years there have been rumors that Gold and Silver were being manipulated lower. For the most part these rumors were thought to be in the realm of “conspiracy theory” by most of the investing crowd.

However, at this point the evidence is clear. Someone is clearly manipulating Gold lower. This is happening almost every morning when someone dumps Gold in massive sell orders, pushing the precious metal’s price sharply lower.

The reason we know that this is a clear intervention, and not simply a large institution selling concerns the pattern of selling.

On Friday morning last week, someone staged an order to dump 5,000 futures contracts of Gold. That amounts to over $640 million in Gold. In one order. Placed all at once.

When it happened, Gold dropped $25 per ounce in a matter of two minutes. It doesn’t matter that the sell order was cancelled half way through, the damage was done and Gold continued to languish as it has (extraordinary given the systemic risks in the US and Europe today).

No one and I mean NO ONE would place an order like this. It simply doesn’t happen. Anyone who is trying to unload a position of this size would do it in chunks over a period of time in order to not push the price sharply lower.

Put it this way, if you happened to own this much Gold and were looking to unload your position, you would not want the price of Gold to be lower because that would mean you make less per ounce sold.

So you would be very careful to unload this position with as little impact on the market as possible, so that you could get the best prices. You wouldn’t just hit “sell” and dump the whole batch in one go.

Again, no one would do this. That sell order came from intervention. Someone was trying to send a message to the market. Gold futures were halted for 10 seconds as liquidity dried up.

I keep hearing how this sell order could have been a “mistake.” If that were the case, it wouldn’t keep happening because the person who made the mistake would be fired.

The “mistake” has happened repeatedly over the last few weeks. So either some institution has a whole roster of numbskulls trading Gold, or the individual numbskulls at different institutions are all making the same mistake in roughly the same time period.

The odds of this are next to none.

Which begs the question, just who is trying to push Gold lower right now? Just about any sensible investor would be buying the precious metal to hedge against the default risk/ debt ceiling risk in the US.

We offer a Special Report on how to purchase Gold Bullion safe and securely with every subscription to Private Wealth Advisory. In it we outline why every investor should have some exposure to bullion, how to buy it and the key questions you should ask every bullion deal.

Along with this report, every Private Wealth Advisory subscription comes with:

  1. The Inflation Secrets Your Broker Won’t Tell You About.
  2. The Secret FDIC Legislation That Puts Your Savings At Risk.
  3. 12 monthly issues of Private Wealth Advisory.
  4. Real time investment alerts to Buy and Sell our recommendations as needed.

All this for $179.99… Private Wealth Advisory.

Click Here Now!

Best Regards

Phoenix Capital Research


Posted by Phoenix Capital Research in It's a Bull Market

Europe’s Lies Are So Bad, They Make the US Look Good Comparison

While the US continues to bumble its way towards a debt ceiling crisis (somehow our President doesn’t have time to meet work on solving this, but does have time to make sandwiches with volunteers and give press statements about how we wants to work), Europe continues to make us look good by comparison.

Remember how we were told time and again that Europe was saved? Remember how repeatedly we were told that the European Central Bank (ECB) would do “whatever it takes” to fix things?

Turns out all of that was a total load of BS. Indeed, the IMF just announced the following:

Nobody knows the true scale of potential losses at Europe’s banks, but the International Monetary Fund hinted at the enormity of the problem this month, saying that Spanish and Italian banks face 230 billion euros ($310 billion) of losses alone on credit to companies in the next two years.

Yet five years after the United States demanded its big banks take on new capital to reassure investors, Europe is still struggling to impose order on its financial system, having given emergency aid to five countries.

http://www.reuters.com/article/2013/10/13/us-eurozone-banks-idUSBRE99C03Y20131013

Remember, Spain was the banking system that was great right up until it demanded a 100 billion Euro bailout. Then only six months later, one of its largest problem banks (which had taken 18 billion Euros in bailout funds) announced it still had a negative valuation.

The entire EU banking system is insolvent. Unlike the US where the banks raised capital to address their problems, EU banks have not raised capital nor have they reduced their leverage (of 26 to 1 by the way). Instead, they’ve simply swapped garbage assets as collateral to the ECB, which counts this garbage at 100 cents on the Euro, and issues liquidity to the banks.

The whole thing is one giant lie. You have banks lying about what they own to the ECB which lies about the real risk of the banks which swaps out debt from EU countries that are lying about their finances in exchange for free money so the banks can keep lying.

Honestly, this whole mess makes the US look good by comparison. The bad loans, leverage and every other negative issue is worse for EU banks than for the US.

Makes you wonder why investors are piling into EU financials, doesn’t it? In general share prices in this space have doubled since the 2012 lows. The fact they’ve doubled on a colossal lie doesn’t bode well.

I expect we’ll see the European banking crisis back with a vengeance in the first half of 2014. Now that the German elections are over and Merkel has won, the “reality” of Europe should start leaking out (it’s not coincidence that the IMF released this report about Spanish and Italian bank woes just now after the German election as though this was suddenly “news”).

Best Regards

Graham Summers


Posted by Phoenix Capital Research in It's a Bull Market

Central Planning, Lying Career Politicians, and the US Ponzi Debt Scheme

The political class in Washington has failed to reach a deal. They are effectively playing a game of chicken with the markets to see who blinks first. As usual, there are plenty of lies and spin swirling around this situation.

The US Treasury has stated it will run out of cash on October 17.

This in of itself is a strange claim as technically we hit the debt limit back in May and have been resorting to “extraordinary” measures since then. I don’t recall anyone in at the Treasury talking about the importance of the “debt ceiling” then, do you?

Secondly, the Government has effectively been running a Ponzi scheme with our debt for the greater part of 20 years. Over $5.7 trillion of our debt is owned by the Federal Government, ($2.1 trillion is owned by the Fed, $2.6 trillion is owned by Social Security, and over $1 trillion is owned by various Federal Retirement entities).

Indeed, the single largest owner of US debt is not in fact China, but our own Government. We’ve been running this kind of scheme for over 20 years.

Now this is not to say that a debt ceiling breach or a possible default on some payments are NOT huge issues. What I am saying is that the US Government can shuffle money around just as it has for the last 20 years to insure that we meet our debt obligations.

So the debt ceiling “we’re going to run out of money and the world ends” talk is not accurate. What is accurate is that playing games with your debt limits impacts other investors’ psychologies. And THAT is the real issue here.

The Fed has already screwed this up royally. Indeed, by engaging in QE, the Fed alters the very structure of risk in the financial system. Traders on Wall Street, knowing full well that the Fed would be soaking up Treasuries, rushed into new debt issuance with the intention of flipping over these assets to the Fed in the near future.

This became a self-fulfilling prophecy as the “front-running the Fed” trade became a dominant theme for Wall Street. By piling into bonds, traders forced prices higher and yields lower: precisely what the Fed wanted.

It is critical to note that a significant percentage of these investors had no interest in actually owning US debt as an asset class in the long run. They were simply looking for an easy trade that made money. As a result, interest rates were driven even lower by the “investment herd”.

We saw this when Treasuries dived soon after the Fed hinted at “tapering” QE. At that time, traders realized the “front-run” the Fed trade may be ending and dumped Treasuries. Rates rose, mortgage rates rose, mortgage applications collapsed, and the slew of other problems surfaced.

My point with all of this is that Central planning is always a disaster. We are now watching another Central-Planning debacle in the form of the debt ceiling fiasco. These folks got us into this mess, expecting them to get us out of it is foolish.

With that in mind, I’ve already urged my Private Wealth 
Advisory clients to start prepping. We’ve opened six 
targeted trades to profit from the US’s debt crisis.

We’ve also taken care to prepare our finances and our 
loved ones for what’s coming, by following simple 
easy to follow steps concerning our savings, portfolios, 
and personal security via my Protect Your Family, 
Protect Your Savings & Protect Your Portfolio 
reports.

I’ve helped thousands of investors manage their risk 
and profit from market collapses. During the EU 
Crisis we locked in 72 straight winning trades 
and not one loser, including gains of 18%, 28% and 
more.

In fact, we’re currently on another winning streak 
having locked in FOURTEEN winning trades in the last 
two months, including gains of 10%, 11%, 21% and 25%.

All for the small price of $299: the annual cost 
of a Private Wealth Advisory subscription. 

To take action to prepare for what’s coming… and 
start taking steps to insure that when this debt crisis 
bursts you don’t lose your shirt.

Click Here Now!

Yours in Profits,

Graham Summers

Posted by Phoenix Capital Research in It's a Bull Market

Stocks Just Took Out THE Line

The markets are finally beginning to realize that the debt ceiling debacle, economic contraction in the US, housing bubble 2.0 bursting, China slowdown, Japan stagflation and European banking crisis are not good for stocks.

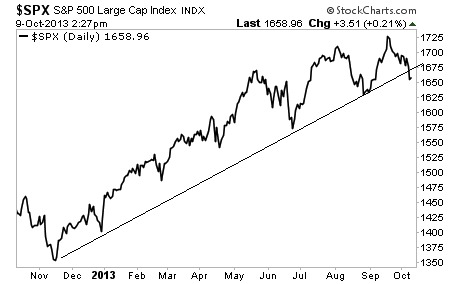
With that in mind, the S&P 500 has briefly taken out the trendline that has supported it since QE 4 was announced.

Remember, the Fed is printing $2 billion per day and funneling it into the system. So if the markets begin to break down NOW, the only thing the Fed can do is print more money.

However, this combined with the debt ceiling debacle could make a REAL mess. Yesterday the US issued a 4-week Treasury bill that came darn close to outright failure. With investors beginning to question whether the US might indeed have a debt crisis on its hands, investors are beginning to shun some US Treasuries and T-Bills for others based on priority of payments.

Remember, every single Treasury and T-bill out there is utilized as collateral for millions of Dollars worth of trades. So if the big financial institutions begin to refuse to accept some US debt as collateral based on the perceived risk of a deb ceiling debacle there could quickly be capital call in the market similar to what happened when Lehman failed.

This is not to say that the US will default on its debt. Rather this is to say that the mess the Government created is affecting things behind the scenes in the financial system. And this is where the next crisis could emerge.

With that in mind, investors should be prepping now for a potential run of systemic risk. If you are not already receiving powerful investment insights and recommendations on how to navigate this mess, I strongly suggest you take our a trial subscription to Private Wealth Advisory our monthly investment advisory devoted to helping individual investors hedge risk and protect their portfolios.

Few newsletters do a better job of navigating crisis than Private Wealth Advisory. During the EU Crisis of 2011-2012, we locked in 74 STRAIGHT winning positions and not one single loser.

We just started another winning streak in May.

Since then, Private Wealth Advisory subscribers have locked in 14 straight winners trades with gains between 7% and 25%. During this period we haven’t closed a single loser.

I just outlined six new positions that will produce huge gains when the market collapses from the Debt Ceiling Crisis.

To find out what they are, all you need to do is take out a trial subscription to Private Wealth Advisory.

The price of an annual subscription is just $299.99.

For that price you get:

  • 12 monthly issues of Private Wealth Advisory
  • All of our Special Investment Reports outlining special investment opportunities.
  • Real time investment updates as needed

All of this for just $299.99.

To take out an annual subscription to Private Wealth Advisory

Click Here Now!

Graham Summers


Posted by Phoenix Capital Research in It's a Bull Market

Are We Heading For Another September Crisis… One Day Late?

Are we headed for another September Crisis?

In general the period from May until November is a time for market underperformance. The average performance for the period from May 1 through October 31 each year since 1950 is just 1.2%. The average performance for the other six months of the year (November 1 through April 30) each year since 1950 is 7.0%

Historically, September is has been the single worst month for stocks over the last 80 years. Since 1929, on average the S&P 500 has fallen 1.1% in September.

This is only one of three months to have an average negative return over this period. And it is the single worst month of the year (the other two are May with an average return of -0.1% and February with an average return of  -0.2%).

Moreover, it is the Autumn when banking and financial crises have a tendency to occur. In terms of specific months, September and October are the worst with issues that lead up crashes erupting in September with October being when the actual crashes finally hit. There were Crashes during these months in 1907, 1929, 1987, and 2008.

All told, there have been a total of 147 crises since 1970 in the world. September accounted for 27 of them, the single largest month.

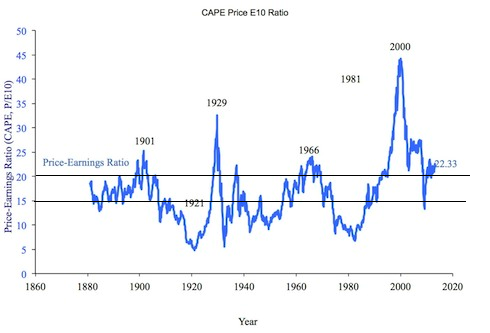
For certain stocks are definitively in a bubble. Based simply on CAPE (cyclical adjusted price to earnings) the market is significantly overvalued with a reading of nearly 24 (anything over 15 is overvalued).

Indeed, we’ve only been at this level of valuation during major stock tops (1929, 1966, 2000, and 2007)

Now we have the Government potentially shutting down. The markets are open on Monday which will be the last day in September.

Are we going to get another September Crisis a day late?

If you’re looking for actionable investment strategies on playing the markets, take a look at my monthly investment newsletter, Private Wealth Advisory.

Published on the third Wednesday of every month after the market closes, Private Wealth Advisory, shows individual investors how to beat the market with well-timed unique investments.

To whit Private Wealth Advisory is the only newsletter to have shown investors 72 straight winning trades and no losers during a 12-month period.

Indeed, in the last two months alone we’ve locked in gains of 8%, 12%, 21% and even 28%... with an average holding period of 3-4 weeks.

To find out more about Private Wealth Advisory and how it can help you beat the market with your investments…

Click Here Now!

Best Regards

Graham Summers


Best Regards

Graham Summers


Posted by Phoenix Capital Research in It's a Bull Market

Are the Bells Ringing At the Top This Time Around?

It’s often argued that they don’t a bell at the top.

I would argue that we numerous bells ringing in the financial markets today.

Carl Icahn wants Apple to leverage up to boost returns to shareholders. Apple has maintained next to no debt for the better part of ten years.

Now share price is lagging and the goal is to issue a load of debt to buy back shares. Leveraging up companies that have long had little debt is a classic market mania indicator

Hilton is trying to go public. Put another way, one of the largest commercial real estate/ hospitality chains in the world is going public after being private for over 40 years…

Why go public now? Because you can raise funds cheaply in today’s high liquidity environment and you don’t want to be holding the bag when the economy slumps again.

The large financial institutions that bought homes and real estate in the slump are looking to exit. These groups and their clients didn’t get rich by being wrong.

They’ve made their profits by buying when no one else wanted to and now they’re getting out. Hedge fund Och-Ziff, PE firm Blackstone, and others are unloading their real estate portfolios.

The smart money is getting out of the market. Fortress Investment Group, Apollo Investment Group and other large “smart money” investors are literally “selling everything” they can. They’re not doing this because they expect things to improve and the market to continue to move sharply higher.

Indeed, even investment legend Warren Buffett, who has virtually never advocated against investing in stocks (with the exception of the Tech Bubble) has stated the market is “fully valued” at today’s levels.

Buffett loves stocks. He’s made his fortune investing in them. He is a near eternal optimist. For him to state the markets are fully valued and be sitting in the single largest cash hoard of his investment life is a major indicator that stocks are topping.

If you’re looking for actionable investment strategies on playing the markets, take a look at my monthly investment newsletter, Private Wealth Advisory.

Published on the third Wednesday of every month after the market closes, Private Wealth Advisory, shows individual investors how to beat the market with well-timed unique investments.

To whit Private Wealth Advisory is the only newsletter to have shown investors 72 straight winning trades and no losers during a 12-month period.

Indeed, in the last two months alone we’ve locked in gains of 8%, 12%, 21% and even 28%… with an average holding period of 3-4 weeks.

To find out more about Private Wealth Advisory and how it can help you beat the market with your investments…

Click Here Now!

Best Regards

Graham Summers


Posted by Phoenix Capital Research in It's a Bull Market