This is Where Money Will Be Made This Week

By Graham Summers, MBA

The market is in a kind of macro-limbo.

Having juiced the markets higher with the promises of rates cuts, the Fed now finds itself in the absurd position of walking back these promises as A) stocks are at all time highs, B) the BLS continues to release manipulated jobs data to aid the Biden administration and C) the economy is allegedly growing at annualized rate of 4%+.

Regarding the jobs data…

It has become a running joke that the beancounters in Washington DC release absurdly positive economic data to aid the Biden administration, only to revise the data downward multiple times after the fact. Perhaps the single most ridiculous example of this occurred in 2022 when the Philadelphia Fed revealed that the BLS had overstated job growth in first half of the year by one million jobs.

I bring this up because the BLS was up to its usual shenanigans with the January jobs report released on Friday. In it the BLS claimed that the economy added 353,000 jobs in January 2024 instead of the expected 185,000.  Let’s be blunt here, if the economy was even close to as strong as the gimmicked data the BLS issues, the Biden administration’s approval ratings wouldn’t be in the toilet.

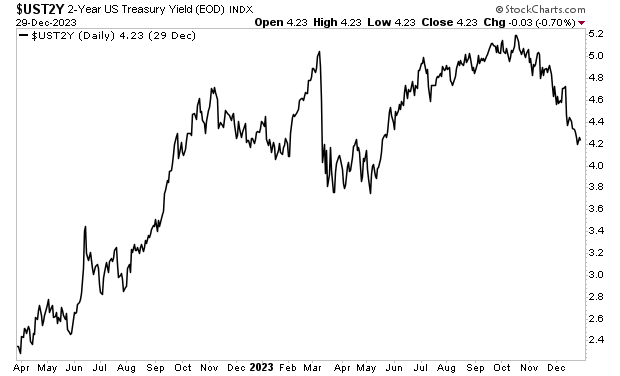
Politics aside, the issue with this jobs report is that it makes it impossible for the Fed to cut rates any time soon. After all, how can the Fed start easing monetary conditions when the economy is supposedly adding over 300,000 jobs per month and GDP is supposedly growing at 4.2%?!

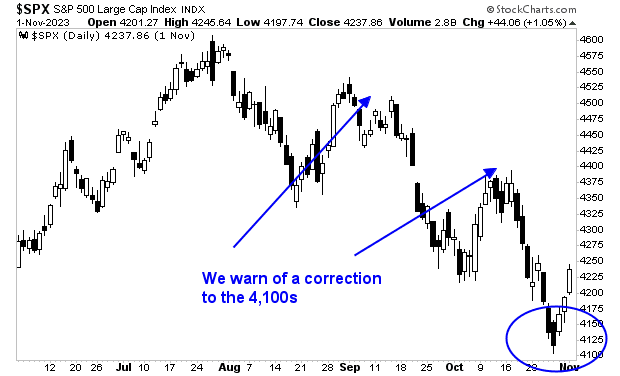
And so the markets are in a kind of limbo. Everyone is bullish based on hopes of Fed rate cuts… but the Fed can’t cut rates with the data this strong. This opens the door to a market correction to take some of the “froth” out of stocks.

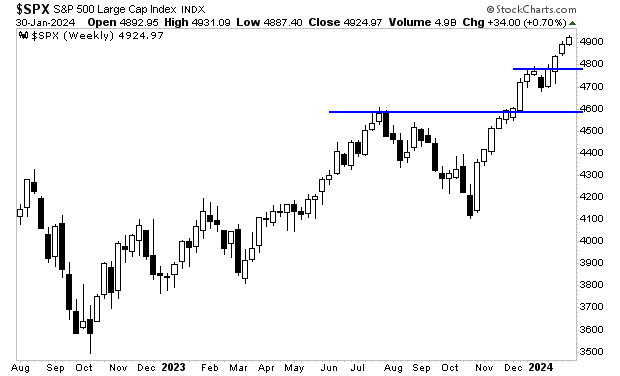
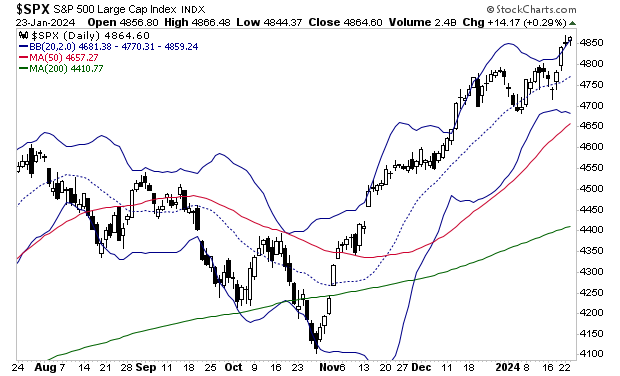
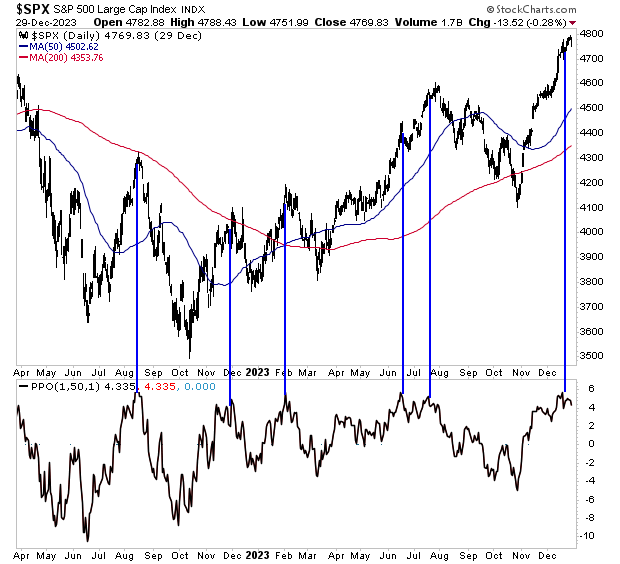
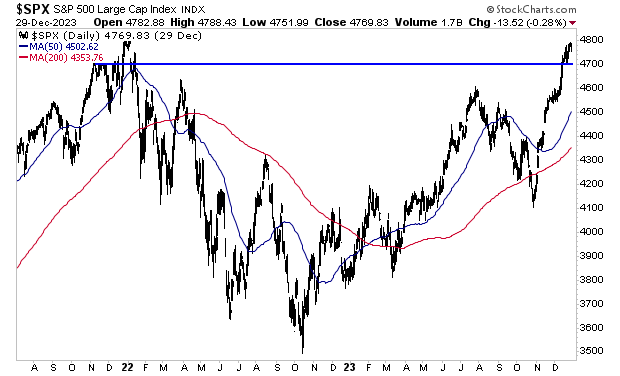
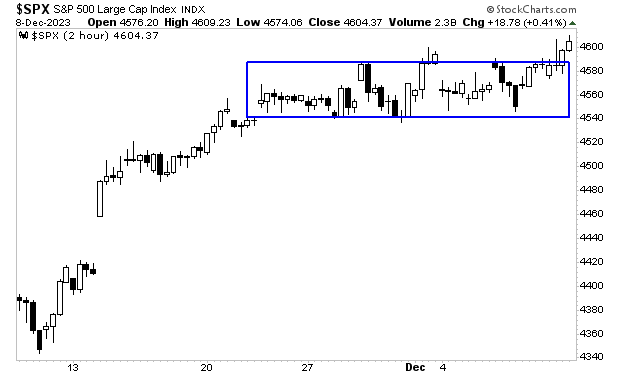
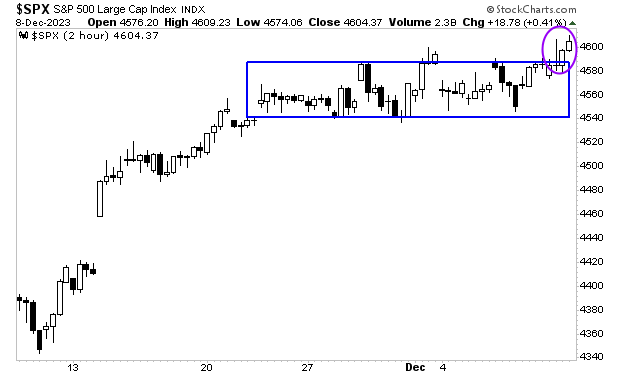
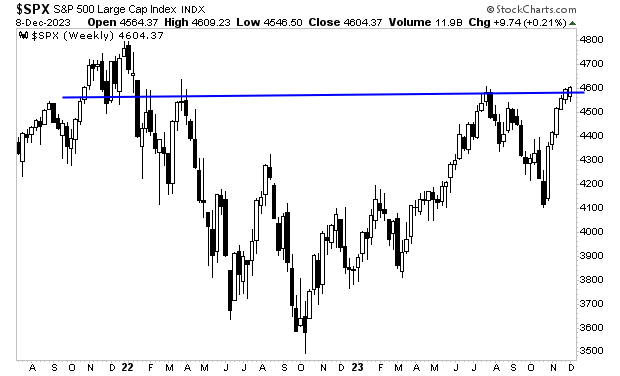
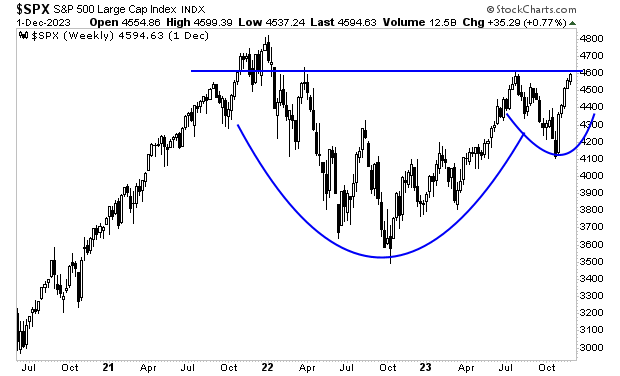
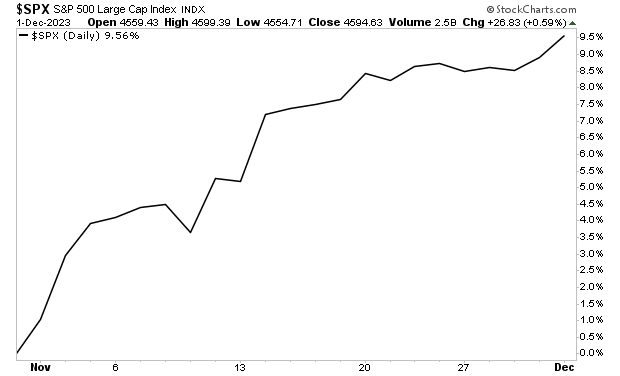
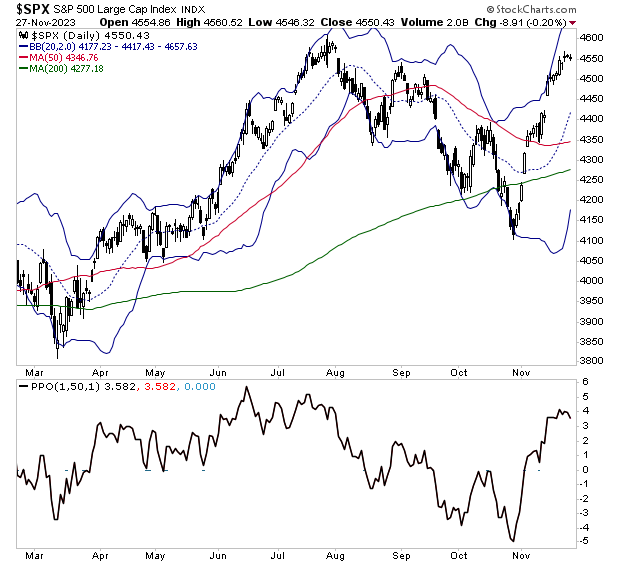
The S&P 500 hasn’t touched its 50-day moving average (DMA) in three months. The 50-DMA is represented by the blue line in the chart below. As you can see, it’s unusual for the S&P 500 NOT to touch this line for such a long period of time.

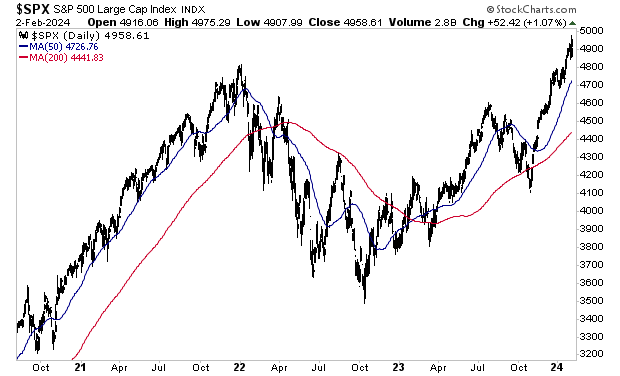
I would also add that the S&P 500 is ~5% above the 50-DMA. Historically, this degree of extension has market a top of sorts. 

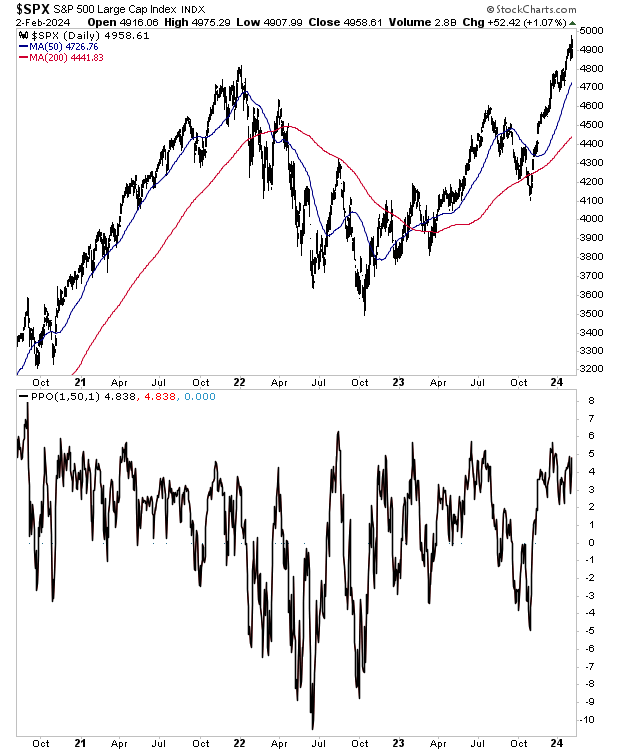
With all of this in mind, the odds favor a correction to the 50-DMA (upper 4700s) some time in the next few weeks. After that, we’ll revisit our market forecast to see what’s next.

As I keep stating, you CAN outperform the overall market, but it takes a lot of work and insight!

To start receiving our daily market insights every weekday before the market’s open (9:30AM EST), use the link below. There is no fee or cost to GAINS PAINS & CAPITAL. Access is free to the public.

Posted by Phoenix Capital Research in It's a Bull Market

Here’s Our Updated Market Forecast Based on Earnings So Far

By Graham Summers, MBA

The markets are now fully into earnings season.

The most critical companies to monitor are the MAG 7/ big tech plays. These are the largest companies in the S&P 500. Because of their size, they account for ~30% of the index’s weight.

Thus far, Tesla (TSLA), Microsoft (MSFT), and Alphabet (GOOGL) have reported. The results have been interesting.

TSLA reported on 1/24/24. The stock was down 10% on its results.

Last night, MSFT and GOOGL reported. MSFT is down about 0.5% while GOOGL is down over 5%. 

So, thus far two of the three MAG 7 have seen their stocks collapse a LOT on earnings results while one of is effectively flat. 

This doesn’t bode well for the broader market. It is VERY difficult for the S&P 500 to rally much at all if the MAG 7 plays are weak. Remember, these companies account for 30% of the market’s weight.

Apple (AAPL), Amazon (AMZN) and Meta (META) report on Thursday. Nvidia (NVDA) reports on 2/21/24. If AAPL and META also sell-off on their results, it’s safe to assume the market will experience a decent correction.

From a technical analysis perspective, the S&P 500 has support just below 4,800. After that is CRITICAL support at 4,595. Given how the MAG 7 plays are responding to earnings, I wouldn’t be surprised to see a correction to 4,595 in the next two months.

This would represent a back-test of the Cup and Handle formation I showed yesterday. Bear in mind, a correction like this would NOT negate our longer term forecast for the S&P 500 to go to 6,000 before 2025. Rather, this correction is a short-term development and would present a fantastic buying opportunity.

If you’re looking for someone to guide your investing to insure you crush the market, you can sign up for our FREE daily market commentary, GAINS PAINS & CAPITAL.

As an added bonus, I’ll throw in a special report Billionaire’s “Green Gold” concerning a unique “off the radar” investment that could EXPLODE higher in the coming months. It details the actions of a family of billionaires who literally made their fortunes investing in inflationary assets. And they just became involved in a mid-cap company that has the potential to TRIPLE in value in the coming months.

To pick up your copy, swing by:

https://phoenixcapitalmarketing.com/GreenGold.html

Posted by Phoenix Capital Research in It's a Bull Market

Three Charts Every Trader Needs to See Today

By Graham Summers, MBA

Stocks aren’t taking a breather.

The S&P 500 is up nearly 150 points in just five sessions. This has been quite a move. And what’s truly extraordinary is that every intraday dip is being bought aggressively.

However, a word of caution here.

The S&P 500 is now 4% above its 50-Day Moving Average (DMA) and 9.8% above its 200-DMA. Over these last 18 months, any time the index has become this extended above its trend has resulted in a short term peak. So, it wouldn’t be surprising to see the S&P 500 correct down to back-test the recent breakout at 4,790.

After that, the door is open to 5,000 on the S&P 500. The Cup and Handle formation I outlined a few weeks ago has broken to the upside. Long-term (later in 2024) we are likely going MUCH higher.

For more market insights swing by https://gainspainscapital.com/

Posted by Phoenix Capital Research in It's a Bull Market

The Door is Now Open to 4,920 on the S&P 500

By Graham Summers, MBA

On November 28th, 2023, I predicted that stocks would hit new all-time highs before February 1, 2024.

Bear in mind, the S&P 500 was at 4,550 when I wrote this. So my prediction meant that the index would have to rally to over 4,818 (the former all-time high established January 3, 2022) in eight weeks’ time.

On Friday this happened, a full two weeks ahead of schedule. Anyone who followed our prediction made a killing!

So what happens now?

Stocks are now quite stretched to the upside. I anticipate we’ll see a drop to backtest this recent breakout at 4,800 sometime in the next 10 days. But after that, the door is open to a run to 4,920 by the end of 1Q24. That’s the upside target for the inverse Head and Shoulders pattern the S&P 500 has established in the last four weeks.

So, in the last seven months, we’ve predicted:

1) The S&P 500 to decline to 4,100s (when it was at 4,500).

2) The S&P 500 to rally from the 4,100s to 4,600 (when it was at 4,200).

3) The S&P 500 to hit new all-time highs before February 1st 2024(when it was at 4,550).

As I keep stating, you CAN outperform the overall market, but it takes a lot of work and insight!

If you’re looking for someone to guide your investing to insure you crush the market, you can sign up for our FREE daily market commentary, GAINS PAINS & CAPITAL.

As an added bonus, I’ll throw in a special report Billionaire’s “Green Gold concerning a unique “off the radar” investment that could EXPLODE higher in the coming months. It details the actions of a family of billionaires who literally made their fortunes investing in inflationary assets. And they just became involved in a mid-cap company that has the potential to TRIPLE in value in the coming months.

To pick up your copy, swing by:

https://phoenixcapitalmarketing.com/GreenGold.html

Posted by Phoenix Capital Research in It's a Bull Market

You Do NOT Want to Miss Out On This One

By Graham Summers, MBA

On December 20th 2023, I predicted that stocks would hit new all-time highs before February 2024. Despite all the drama in Washington as well as the geopolitical risk in the world, stocks are within spitting distance of doing this… and we’re only halfway through January.

The S&P 500 bounced hard off of support at 4,700. If the index closes this week even marginally higher, it will be at new all-time highs.

This is not our first accurate prediction for stocks. 

Throughout September and October of 2023, we warned clients that the S&P 500 was due for a pull back down to the 4,100s. Time and again, we warned our readers not to buy into the rally and to preserve their capital for an incredible buying opportunity that would soon hit.

And hit it did! And our readers “backed up the truck.”

Then, on November 2, when the S&P 500 was still at 4,200, we told clients to buy aggressively because the S&P 500 was going to 4,600 before year end. Remember, the S&P 500 had only just bottomed at 4,100 and we were predicting a 400 point move to hit in the span of eight weeks. So this was an EXTREMELY aggressive forecast. But our research backed it up and we trust our work!

The market then rallied to 4,600 in just four weeks! Those clients who followed our recommendation and loaded up on stocks at 4,100 made an absolute killing!

So, in the last seven months, we’ve predicted:

1) The S&P 500 to decline to 4,100s (when it was at 4,500).

2) The S&P 500 to rally from the 4,100s to 4,600 (when it was at 4,200).

3) The S&P 500 to hit new all-time highs before February (when it was at 4,600).

As I keep stating, you CAN outperform the overall market, but it takes a lot of work and insight!

If you’re looking for someone to guide your investing to insure you crush the market, you can sign up for our FREE daily market commentary, GAINS PAINS & CAPITAL.

As an added bonus, I’ll throw in a special report Billionaire’s “Green Gold concerning a unique “off the radar” investment that could EXPLODE higher in the coming months. It details the actions of a family of billionaires who literally made their fortunes investing in inflationary assets. And they just became involved in a mid-cap company that has the potential to TRIPLE in value in the coming months.

To pick up your copy, swing by:

https://phoenixcapitalmarketing.com/GreenGold.html

Posted by Phoenix Capital Research in It's a Bull Market

This Is The #1 Question Investors Need to Be Asking Right Now

By Graham Summers, MBA

Governments around the world are issuing staggering amounts of debt to “paper over” any weakness in the private sector with public spending. As Bloomberg notes, collectively, the U.S., U.K., E.U., and Japan will issue $2 trillion in new debt this year.

This is keeping the world from entering a recession, while simultaneously setting the stage for the next round of inflation. Remember that the first wave of inflation (2021-2023) was triggering by egregious levels of public spending/ stimulus during a time of private sector weakness.

In the U.S., it is clear the Biden administration is implementing policies to prop up the economy and financial markets for the 2024 election regardless of the consequences the policies will bring down the road.

Case in point, the U.S. is running the levels of deficit you usually see during a recession, at a time when the economy is technically still growing. Indeed, the only periods in which the U.S. was running a larger deficit as a percentage of GDP in the last 100 years during World War II, and the Great Financial Crisis.

As you likely know, deficits are financed via the issuance of debt. And because the U.S. is constantly having to roll over old debt into new debt while also issuing new debt to finance its deficit, the country has added some $2 TRILLION in debt in the last seven months alone!

My question to policymakers: what if all this spending brings back higher inflation when the U.S. finally rolls over into recession? What’s the plan, then? 

Gold has figured it out already. Other asset classes will soon, too.

If you’re looking for someone to guide your investing to insure you crush the market, you can sign up for our FREE daily market commentary, GAINS PAINS & CAPITAL.

As an added bonus, I’ll throw in a special report Billionaire’s “Green Gold concerning a unique “off the radar” investment that could EXPLODE higher in the coming months. It details the actions of a family of billionaires who literally made their fortunes investing in inflationary assets. And they just became involved in a mid-cap company that has the potential to TRIPLE in value in the coming months.

To pick up your copy, swing by:

https://phoenixcapitalmarketing.com/GreenGold.html

Posted by Phoenix Capital Research in Inflation

The Dirty Truth About the “Debt Deal” and What It Means for Investors

By Graham Summers, MBA

The U.S. passed a debt ceiling resolution in May of 2023. Both the GOP and the Democrats claimed victory for the deal, but the reality is the government won and Americans were screwed.

How do I know this?

It took the U.S. 232 years to generate its first $10 trillion in debt. It added another $10 trillion in debt in just nine years once the Fed pinned interest rates at zero and cornered the bond market with Quantitative Easing (QE) from 2008 to 2017. 

The U.S. then added another $10 Trillion in debt in just five years when the Fed reintroduced ZIRP and QE in NUCLEAR fashion in response to the pandemic. Obviously, you’re beginning to see the trend here: the U.S. added $10 trillion in debt in 232 years, nine years, and five years. 

But the “debt deal” has really added fuel to the fire.

The U.S. has added another $4 trillion in debt since 2022. But~ $2 trillion of this was added in the seven months since the debt deal was passed! And thanks to the debt deal removing the debt ceiling until 2025, there is little chance that the pace of debt issuance will slow anytime this year.

How will this end? With a debt crisis of some sort. The details, for now, are unclear.

What isn’t unclear is that investors can potentially make a LOT of money from this situation. Those who invested in the right assets at the right times during the last 20 years while the U.S. has engaged in a debt bonanza have seen some truly OBSCENE returns.

And no, I’m not talking about gold. The precious metal has traded sideways for four years, while the U.S. has tacked on another $10 trillion in debt.

If you’re looking for someone to guide your investing to insure you crush the market, you can sign up for our FREE daily market commentary, GAINS PAINS & CAPITAL.

As an added bonus, I’ll throw in a special report Billionaire’s “Green Gold concerning a unique “off the radar” investment that could EXPLODE higher in the coming months. It details the actions of a family of billionaires who literally made their fortunes investing in inflationary assets. And they just became involved in a mid-cap company that has the potential to TRIPLE in value in the coming months.

To pick up your copy, swing by:

https://phoenixcapitalmarketing.com/GreenGold.html

Posted by Phoenix Capital Research in Debt Bomb

The U.S. Government Has Set the Stage for a Debt Crisis 

By Graham Summers, MBA

Since early 2023, numerous pundits and gurus have been calling for a recession. And despite numerous indicators flashing that one is coming… the recession has yet to arrive.

Why?

This: 

The U.S. is running a GARGANTUAN deficit equal to 5.5% of GDP.

To put this into perspective, it’s larger than the deficit the U.S. ran during EVERY recession in the last 100 years except for the Great Financial Crisis and when the economy was shutdown in 2020.

Put simply, the U.S. is running the kind of spending that we usually see during periods in which the private sector is in a total free-fall… at a time when the private sector is weak, but not yet collapsing.

This has managed to keep the economy positive. But it’s a short-term fix.

Ultimately, the U.S. cannot stay out of recession forever as no amount of government spending can replace the economic impact of the private sector (we learned this during the shutdowns when the Fed and Uncle Sam spent $8 trillion in 12 months but the economy still collapsed).

Moreover… this situation presents us with a MAJOR problem down the road: if the U.S. is already spending at a pace usually associated with recessions while the economy is still growing, what is going to happen when the economy finally does roll over into recession? How much spending will it be doing then? 8% of GDOP? 10% of GDP? More?

And bear in mind, this spending is being funded by debt (it is a deficit after all). What happens to the bond market if the U.S. cranks up its spending to 8% or more of GDP when the actual recession hits?

Gold has started to figure it out. Other assets will figure it out soon.

As I keep stating, you CAN outperform the overall market, but it takes a lot of work and insight!

If you’re looking for someone to guide your investing to insure you crush the market, you can sign up for our FREE daily market commentary, GAINS PAINS & CAPITAL.

As an added bonus, I’ll throw in a special report Billionaire’s “Green Gold concerning a unique “off the radar” investment that could EXPLODE higher in the coming months. It details the actions of a family of billionaires who literally made their fortunes investing in inflationary assets. And they just became involved in a mid-cap company that has the potential to TRIPLE in value in the coming months.

To pick up your copy, swing by:

https://phoenixcapitalmarketing.com/GreenGold.html

Posted by Phoenix Capital Research in Inflation

One of My FAVORITE Indicators for Timing the Market Is Flashing a Warning!

By Graham Summers, MBA

As I keep telling you, it IS possible to time the market. The key is to put in the work to do so.

For me, one of the best means of predicting stock market moves is to focus on “market leading” indicators, or assets that typically lead stocks to the upside and the downside during market turns.

One of my favorite such indicators is high yield credit, or junk bonds.

Bonds/ credit are senior to stockholders. If a company goes bust and needs to liquidate its assets, bond/ credit holders will be paid out long before stockholders see a dime. And generally speaking, bond investing is more sophisticated than stock investing largely due to bonds’ greater sensitivity to Fed policy, the economy, and more.

As a result of this, credit, particularly high yield credit, or credit for companies that are at a greater risk of going bust, typically leads stocks when it comes to pricing future risk on or risk off moves.

You can see this clearly in the following charts which depict the High Yield Corporate Bond ETF (red line) and the S&P 500 (black line). Sometimes the two assets move in tandem, but other times, credit leads stocks clearly to the point that you can accurately predict the next market move for stocks.

The first chart concerns the risk on move in assets that occurred from late 2022/ early 2023. At that time, HYG lead the market to the upside, rallying aggressively even when stocks would dip for a day or two. I’ve illustrated this with a purple rectangle below. Throughout that time period, the ongoing strength in HYG was a reliable indicator that the stock market would continue to rally.

Another example concerns the risk off move in assets that occurred from July 2023 through November 2023. During that period, high yield credit failed to confirm any rally in stocks, with the red line (credit) rolling over quickly even when the black line (stocks) bounced aggressively. I’ve illustrated this with a blue rectangle in the chart below.

So, what is high yield credit telling us about the future of the stock market today?

HYG is leading stocks to the downside, though it is doing so in a very controlled manner. Right now, HYG is suggesting that the S&P 500 will drop to 4,700 or so. Obviously this can change as things develop, but for now, HYG is telling us that any stock pullback should be relatively shallow.

As I keep stating, you CAN outperform the overall market, but it takes a lot of work and insight!

If you’re looking for someone to guide your investing to insure you crush the market, you can sign up for our FREE daily market commentary, GAINS PAINS & CAPITAL.

As an added bonus, I’ll throw in a special report Billionaire’s “Green Gold concerning a unique “off the radar” investment that could EXPLODE higher in the coming months. It details the actions of a family of billionaires who literally made their fortunes investing in inflationary assets. And they just became involved in a mid-cap company that has the potential to TRIPLE in value in the coming months.

To pick up your copy, swing by:

https://phoenixcapitalmarketing.com/GreenGold.html

Posted by Phoenix Capital Research in It's a Bull Market

Graham Summers’ Market Forecast For the Week of 1/2/24

By Graham Summers, MBA

Stocks are due for a pullback here. 

The S&P 500 is ~5% above its 50-Day Moving Average. Historically, this degree of extension above the primary trend has marked a temporary top. It doesn’t mean that stocks will collapse, rather is suggests the upside is limited and consolidation/ correction is the high probability scenario.

The question now is how deep the correction will be…

For that analysis we turn to bonds and the Fed.

The yield on the 2-Year U.S. Treasury has declined from 5.25% to 4.2% where it is now. This decline has been driven by the Fed pivot, in that the Fed will no longer be raising rates, but instead will begin cutting them in the near future.

 This will be a boon for stocks as this declining yield means:

1) Stocks will be priced at a higher future Earnings Per Share (EPS) multiple.

2) Money will begin to flow out of bonds and money market accounts into stocks as yields have peaked.

All of the above suggests that any and all dips in stocks will be relatively shallow. Put simply the coming decline is an opportunity to “buy the dip” in a new bull market. 

In terms of specific price points, the S&P 500 has major support at 4,700. I would be very surprised to see the market drop much below that level. The S&P 500 might decline into the upper 4,600s to “run the stops” for stock bulls, but a drop below 4,680 is unlikely.

For more market insights and analysis, join our free daily market commentary Gains Pains & Capital. You’ll immediately start receiving our Chief Market Strategist Graham Summers, MBA’s briefings to your inbox every morning before the market’s open.

And if you sign up today, you’ll also receive a special investment report How to Time a Market Bottom that the market set-up that has caught the bottoms after the Tech Crash, Housing Bust, and even the 2020 pandemic lows.

Even more importantly, you’ll find out what this trigger says about the market today!

This report usually costs $249, but if you join Gains Pains & Capital today, you’ll receive your copy for FREE.

To do so…

https://phoenixcapitalmarketing.com/TMB.html

Posted by Phoenix Capital Research in It's a Bull Market

Did You Catch That Move Higher?

By Graham Summers, MBA

On Monday I told you that the S&P 500 was headed for 4,700. At that time, the market was hovering around 4,600. And given all the risks in the world (turmoil in the Middle East, slowing economic data in the U.S.), I’m sure many people thought I was bonkers to predict that stocks would continue higher.

Fast forward 48 hours and it looks as if the S&P 500 will hit my target before the week ends. As I write this, the S&P 500 futures are at 4,656.

The gains won’t stop there either. I believe the market will reach new all-time highs before February 1 2024. The former high was 4,818 set in October of 2022. I believe we’ll break that within six weeks’ time.

The long-term chart is clear… I’ll tell you what it portends tomorrow. But for now, here’s a hint.

As I keep stating, you CAN outperform the overall market, but it takes a lot of work and insight!

If you’re looking for someone to guide your investing to insure you crush the market, I’m your guy. Since 2015, subscribers of my Private Wealth Advisory have maintained a win rate of 74%.

Yes, we made money on three out of every four trades we closed.

Throughout this time, we completely OBLITERATED the S&P 500, returning over 200% compared the market’s 125%.

So you are looking for someone to help you profit from the markets… few analysts have the ability to navigate volatile markets like I do.

And I believe 2023 is going to be our best year yet!

To join us in turning the coming roller coaster into a source of life-changing profits, all you NEED to do is take out a 30-day $3.99 trial subscription to Private Wealth Advisory.

A full SIX (6) MONTH subscription to Private Wealth Advisory includes:

Frankly, this is a ridiculous amount of material to offer for just $3.99…

Heck, the book alone is worth $9.99, and you’re getting FREE shipping on it!

So technically, you’re getting the weekly market updates, the weekly podcast, and the trades and trade alerts FREE OF CHARGE.

The doors close on this offer soon… don’t delay taking advantage of it!

Posted by Phoenix Capital Research in It's a Bull Market

Here’s the Breakout… Next Up is 4,700 on the S&P 500

By Graham Summers, MBA

Here comes the Santa Rally.

The S&P 500 has been trading in a 40-point range since mid-November. I know that sounds difficult to believe, but it’s true. For all the issues in the world (conflict in the Middle East, the ongoing war between Russia and Ukraine,  economic data weakening in the U.S., political issues/ potential impeachment for the Biden administration), the stock market has gone nowhere.

See for yourself. I’ve illustrated this with a blue rectangle in the chart below. 

Having said that, the market DID reveal something MAJOR in the last month… but it’s what DIDN’T happen as opposed to what happened.

What didn’t happen?

Stocks didn’t break down.

In spite of all the issues and potential risks in the world right now, the bears couldn’t generate enough selling pressure to push stocks down more than 1%. And considering the market was EXTREMELY overbought going into this period, it REALLY suggests the bears are weak right now.

Which means…

The Santa rally is about to hit. Indeed, just last week, the market managed to break out of its trading range and stay there. I’ve illustrated this development with a purple circle in the chart below.

If stocks hold this today, then the door opens to a Santa rally that sees the S&P 500 hit 4,700 before year-end. Take out 4,600 on a weekly basis and you’ve got an opening to 100 points higher relatively quickly.

For more market insights and analysis, join our free daily market commentary Gains Pains & Capital. You’ll immediately start receiving our Chief Market Strategist Graham Summers, MBA’s briefings to your inbox every morning before the market’s open.

And if you sign up today, you’ll also receive a special investment report How to Time a Market Bottomthat the market set-up that has caught the bottoms after the Tech Crash, Housing Bust, and even the 2020 pandemic lows.Even more importantly, you’ll find out what this trigger says about the market today!This report usually costs $249, but if you join Gains Pains & Capital today, you’ll receive your copy for FREE. To do so…

https://phoenixcapitalmarketing.com/TMB.html

Posted by Phoenix Capital Research in It's a Bull Market

This is How to Make Money From Today’s Market

By Graham Summers, MBA

Yesterday’s market action could not have illustrated the current market rotation any better.

As I recently outlined:

1) The S&P 500 is currently consolidating after one of its best monthly performances in 30 years.

2) This consolidation has consisted of large tech correcting while laggard sectors and indices (small caps/ the Russell 2000, industrials/ the Dow Jones Industrial Average) catch a bid.

Yesterday’s price action illustrated this perfectly: microcaps (the Russell 2000) caught a major bid relative to tech (the NASDAQ) as the Russell 2000 ROSE over 1% while the NASDAQ fell nearly 0.9%.

If you heeded yesterday’s missive you did quite well! Again, you CAN outperform the overall market, but it takes a lot of work and insight!

This trend is likely to play out over the next two weeks until the Russell 2000/ NASDAQ ratio reaches its 200-day moving average (DMA) sometime around the Fed’s next FOMC (December 12th-13th).

At that point the overall market should complete its consolidation/ correction and begin its next leg up. I’ve said previously that the S&P 500 will hit 5,000 sometime in the 1Q24. The setup is clear in the longer-term Cup and Handle formation.

For more market insights and analysis, join our free daily market commentary Gains Pains & Capital. You’ll immediately start receiving our Chief Market Strategist Graham Summers, MBA’s briefings to your inbox every morning before the market’s open.

And if you sign up today, you’ll also receive a special investment report How to Time a Market Bottom that the market set-up that has caught the bottoms after the Tech Crash, Housing Bust, and even the 2020 pandemic lows.Even more importantly, you’ll find out what this trigger says about the market today!This report usually costs $249, but if you join Gains Pains & Capital today, you’ll receive your copy for FREE.To do so…https://phoenixcapitalmarketing.com/TMB.html

Posted by Phoenix Capital Research in It's a Bull Market

Here’s the Rotation and Then Comes New Highs

By Graham Summers, MBA

What comes next for stocks?

The S&P 500’s performance for the month of November 2023 was one of the best single month performances for stocks in the last 30 years. Stocks finished the month up 9.5%, a truly incredible return.

The big question is “what’s next for the markets?”

The answer is “rotation.”

Tech led the rally as Big Tech blasted higher throughout November while much of the rest of the market lagged behind. We are now seeing capital flowing into some of of the laggards, specifically small caps.

The ratio between the NASDAQ and the Russell 2000 has been in a downtrend for most of 2023 as Tech stocks outperform small caps. We are now seeing a break of this downtrend to the upside as small caps finally catch a bid and Tech consolidates

This rotation is allowing overall breadth to improve as non-Tech stocks catch up to Tech leaders. You can see this clearly in the chart below in which breadth (red line) is catching up to the Tech sector (XLK).

After this rotation/ catch up is finished, stocks go to new all time highs. The Cup and Handle formation in the long-term chart for the S&P 500 is clear.

For more market insights and analysis, join our free daily market commentary Gains Pains & Capital. You’ll immediately start receiving our Chief Market Strategist Graham Summers, MBA’s briefings to your inbox every morning before the market’s open.

And if you sign up today, you’ll also receive a special investment report How to Time a Market Bottom that the market set-up that has caught the bottoms after the Tech Crash, Housing Bust, and even the 2020 pandemic lows.Even more importantly, you’ll find out what this trigger says about the market today!This report usually costs $249, but if you join Gains Pains & Capital today, you’ll receive your copy for FREE. To do so…

https://phoenixcapitalmarketing.com/TMB.html

Posted by Phoenix Capital Research in It's a Bull Market

Stocks Will Hit New All Time Highs Before February 1, 2024

By Graham Summers, MBA

The S&P 500 is consolidating after one of its best monthly performances in the last 30 years.

Thus far in November, the S&P 500 is up 8.5%. If the month ended today, it would be one of the top 10 monthly returns for the S&P 500 in the last 30 years. We rode this rally the entire way up, having told our clients to buy stocks aggressively when the S&P 500 was down at 4,200. Suffice to say, they’re quite happy.

And their #1 question today is: so what’s next for stocks?

The S&P 500 is quite overextended, having rallied to a level that is 4% above its 50-day moving average (DMA). Throughout the last 12 months, an extension of this magnitude above the 50-DMA has marked a temporary top for stocks.

The big question now is if stocks correct… or if they simply consolidate here, thereby allowing the 50-DMA to catch up to price, before the market make its next push higher. 

Thus far the market is opting for #2: consolidating. 

The S&P 500 has traded within a 20 point range since November 22nd. The key issue here as far as I’m concerned is that the bears have failed to push stocks down in any significant way, even though there was very low trading volume due to the Thanksgiving holiday.

Think of it this way… stocks are finalizing one of their most aggressive single month rallies  in 30 years, and the bears can’t even generate enough selling pressure to push the S&P 500 down 1%. 

This suggests that the next move for stocks will be up once this consolidation is over. And given that the market is less than 5% from its all-time highs, I believe we’ll see the S&P 500 hit NEW all-time highs some time in the first quarter of 2025, likely before February 1st, 2024.

For more market insights and analysis, join our free daily market commentary Gains Pains & Capital. You’ll immediately start receiving our Chief Market Strategist Graham Summers, MBA’s briefings to your inbox every morning before the market’s open.

And if you sign up today, you’ll also receive a special investment report How to Time a Market Bottom that the market set-up that has caught the bottoms after the Tech Crash, Housing Bust, and even the 2020 pandemic lows.

Even more importantly, you’ll find out what this trigger says about the market today!

This report usually costs $249, but if you join Gains Pains & Capital today, you’ll receive your copy for FREE.

To do so…

https://phoenixcapitalmarketing.com/TMB.html

Posted by Phoenix Capital Research in It's a Bull Market

Yes, You CAN Time the Market… And I’ll Show You How!

By Graham Summers, MBA

Yesterday’s article caused quite a stir.

It is widely believed that you cannot time the market. This is a myth. You can time the market, but it takes a lot of work and knowledge.

Case in point, as I outlined in yesterday’s article, I accurately called for the S&P 500 to run to 4,600 back on November 2, 2023 when the market was still just at 4,200.

The S&P 500 hit a high an intraday high of 4,557 yesterday. Modesty aside, this was an incredible call, made within a few days of the market hitting its absolute lows before the rally.

This wasn’t luck either. 

Prior to this call, I had been warning clients for weeks that stocks would break down to the 4,100s on the S&P 500 and that this would be a MAJOR buying opportunity. Heck, the literal title to a research note to private clients on October 5th was “Bonds Stabilize… But I Expect a Final Flush for Stocks.”

What happened next is illustrated in the chart chart. Again, I called for the S&P 500 to drop to the 4,100s weeks in advance, then predicted the S&P 500 would run to 4,600 weeks within days of the market bottom in late October.

So my point remains the same: you CAN time the market, but it takes a lot of work and knowledge.

For more market insights and analysis, join our free daily market commentary Gains Pains & Capital. You’ll immediately start receiving our Chief Market Strategist Graham Summers, MBA’s briefings to your inbox every morning before the market’s open.

And if you sign up today, you’ll also receive a special investment report How to Time a Market Bottom that the market set-up that has caught the bottoms after the Tech Crash, Housing Bust, and even the 2020 pandemic lows.

Even more importantly, you’ll find out what this trigger says about the market today!

This report usually costs $249, but if you join Gains Pains & Capital today, you’ll receive your copy for FREE.

To do so…

https://phoenixcapitalmarketing.com/TMB.html

Posted by Phoenix Capital Research in It's a Bull Market

How We Called the Santa Rally Week’s Before Anyone Else

By Graham Summers, MBA

The following are excerpts from my Private Wealth Advisory market update to private clients written on 11-2-23. At that time the S&P 500 was trading in the 4,200s. It’s at 4,531 today.

The door is open to a Santa Rally to 4,600 or even higher on the S&P 500.

Why?

The Treasury just removed the single largest concern for stocks for the remainder of the year.

As I’ve noted previously, one of the most difficult aspects of stock market investing is that the market is a discounting mechanism for millions, if not billions, of pieces of information. The stock market represents the collective decisions of millions of individuals all of whom are thinking about a myriad of data points/ issues… and all of whom have literal money on the line.

However, out of all the millions or billions of pieces of information that the market is discounting at any given time, it typically only really cares about two or three issues at a time. 

Sometimes it’s inflation. Other times it’s what the President is doing (or tweeting). Other times it’s China. Other times it’s what the Fed is doing or about to do. Other times it’s the economy. And so on and so forth.

What makes things even more difficult is the fact that the market changes its focus all the time. It might be really focused on inflation for a few weeks only to then ignore inflation for months on end. Similarly, the market might go weeks without acknowledging anything Fed officials say, only to then care a great deal about a single statement made by a single Fed official during an hour-long Q&A session.

I bring all of this up, because since late-July/ early-August 2023, the #1 thing the market has cared about has been the size of the Treasury’s long-duration debt issuance…

On July 31st 2023, the Treasury announced its financing needs for the third quarter (July through September). The Treasury announced it would:

1)    Need to borrow $274 billion more than previously expected.

2)    Increase its issuance of longer duration Treasury bonds for the first time since 2021.

Regarding #2, the actual increase in dollar terms of long duration bonds that the Treasury needed to issue was relatively small ($102 billion vs. $96 billion). However, the fact that there was increase in long duration issuance, combined with the increase in total debt issuance ($274 billion) was a surprise.

And the bond markets HATE surprises.

Since that time, bond investors have been dumping ALL long duration bonds. This has resulted in long-term Treasury yields rising (bond yields rise when bond prices fall). And because the stock market is priced based on long-duration Treasury yields, this has meant a sell-off in stocks.

The chart bel shows the yield on the 10-Year U.S. Treasury and the S&P 500 from the last QRA announcement on July 31st 2023 until last week. As you can see, the two items have been moving in lockstep.

Which brings us to this week (week of 10-30-23).

On Monday the 30th of October, the Treasury issued its QRA for the fourth quarter of 2023. It surprised the markets (in a good way) by stating that it would borrow only $776 billion (this was $76 billion less than previously expected).

Then, on Wednesday (11-1-3), the Treasury released its Report to the Secretary of the Treasury from the Treasury Borrowing Advisory Committee.

In it, the Treasury Borrowing Advisory Committee wrote the following (emphasis added)

The Committee supported meaningful deviation from the historical recommendation for 15-20% T-Bill share. While most members supported a return to within the recommended band over time, the Committee noted that the work Treasury has done to meaningfully increase WAM over the past 15 years affords them increased flexibility with T-Bill share in the medium term.

Source: Treasury.gov

As I explained to clients in the remainder of this market update, the decision of the Treasury to rely extensively on short-term T-bills to finance the deficit would ignite a “risk on” rally that will likely last into year-end.

Since that time, the S&P 500 has done this:

For more market insights and analysis, join our free daily market commentary Gains Pains & Capital. You’ll immediately start receiving our Chief Market Strategist Graham Summers, MBA’s briefings to your inbox every morning before the market’s open.

And if you sign up today, you’ll also receive a special investment report How to Time a Market Bottom that the market set-up that has caught the bottoms after the Tech Crash, Housing Bust, and even the 2020 pandemic lows.

Even more importantly, you’ll find out what this trigger says about the market today!

This report usually costs $249, but if you join Gains Pains & Capital today, you’ll receive your copy for FREE.

To do so…

https://phoenixcapitalmarketing.com/TMB.html

Posted by Phoenix Capital Research in It's a Bull Market

Enjoy the Santa Rally… What Comes Afterwards Won’t Be Pretty

By Graham Summers, MBA

Treasury Secretary Yellen wants stocks and bonds higher. 

The reason is simple.

Next year 2024 is an election year. And Yellen is a playing politics for the Biden Administration. After all, it’s hard to convince voters to re-elect someone when their 401(k)s are shrinking by the week.

This is why Secretary Yellen chose to have the Treasury shift its issuance from its traditional breakdown of 15%-20% short-term debt/ 80%-85% long-term debt to favor issuing more short-term debt for the foreseeable future.

Doing this alleviates some of the pressure on long-term Treasuries as well as stocks which are priced based on the former’s yields. This is THE reason why both assets (stocks and bonds) erupted higher last week after declining for most of the last three months.

The BIG problem with this is that Secretary Yellen is choosing to rely heavily on short-term debt at a time when the Biden Administration is running its largest deficit as a percentage of GDP outside of WWII.

The U.S. has added nearly $2 TRILLION to the debt in the last 12 months alone. This is happening at a time when the Treasury is ALSO rolling over trillions of dollars worth of debt. 

By relying on short-term debt (12 months of less in duration), Secretary Yellen is setting the stage for an absolute disaster in late 2024/ early 2025. 

Why?

All of this short-term debt will be coming due between now and then. By late 2024, the U.S. will have nearly $35 trillion in debt. And if inflation hasn’t collapsed by then, all of the new short-term debt will need to be rolled over when rates are HIGH.

Interest payments on the debt are already at $800 billion. What do you think will happen to them when the U.S. has $35 trillion in debt and needs to roll over a large amount of this while rates are still in the 4% range or higher?

The long-term end of the bond market has figured it out. Stocks will too eventually.

As I keep warning, the Great Debt Crisis of our lifetimes is fast approaching.

In 2000, the Tech Bubble burst.

In 2007, the Housing Bubble burst.

The Great Debt Bubble burst in 2022. And the crisis is now approaching.

If you’ve yet to take steps to prepare for what’s coming, we just published a new exclusive special report How to Invest During This Bear Market.

It details the #1 investment to own during the bear market as well as how to invest to potentially generate life changing wealth when it ends.

Normally this report would be sold for $249. But we are making it FREE to anyone who joins our Daily Market Commentary Gains Pains & Capital.To pick up your copy, swing by: 

https://phoenixcapitalmarketing.com/BM.html

This image has an empty alt attribute; its file name is signature.jpg
Posted by Phoenix Capital Research in Debt Bomb

Warning: the U.S. is on the Verge of Becoming an Emerging Market

By Graham Summers, MBA

Both stocks and bonds caught a bid mid-week on announcements that the Treasury has decided to issue less long duration bonds that previously expected.

This is GREAT news for risk assets in the short-term. It’s EXTRAORDINARILY BAD NEWS for EVERYTHING in the long-term.

Let’s me explain.

The recent sell-off in both bonds and stocks was driven by one primary concern: that the Treasury would need to issue a gargantuan amount of long-term debt to fund the Biden administration’s profligate spending.

In its simplest rendering:

1) The Biden administration is running the largest fiscal deficit as a percentage of GDP outside of WWII.

2) All of this spending requires the Treasury to issue massive amounts of debt.

Historically, the Treasury’s debt issuance consisted of 15%-20% short-term debt, and 80%-85% long-term debt. The reason for this was to avoid a rate shock should rates change dramatically in a 12-month period (all the short-term debt would come due at a time when rates were much higher).

It was this heavy reliance on long-term debt issuance that resulted in the 10-Year U.S. Treasury collapsing from late July through late October. And since stocks are generally a long-duration asset class, this pulled stocks down as well. 

The below chart shows the 10-Year U.S. Treasury (red line) plotted against the S&P 500 (black line). As you can see, the two were trading in lock-step as soon as the Treasury announced its long duration debt issuance needs for the third quarter of 2023 on July 31st.

The Treasury took note of this collapse, which is why it announced a shift in focus for its 4Q23 debt issuance from long-term debt to short-term debt. 

In its very simplest rendering, the Treasury intentionally removed the #1 concern for the stock market… thereby opening the door to a Santa Rally into year-end. Unfortunately, the cost of this is that the U.S. debt markets will be in VERY serious trouble a year from now.

Why?

Because this is a “one time” trick that cannot be repeated. Sure, it puts a floor under bonds for the time being, but unless the government cuts spending in a BIG WAY, sometime in the next 6-12 months all of this short-term debt will come due and the Treasury will once again need to issue long-term debt.

Mind you, the U.S. is currently adding debt at a pace of nearly $2 TRILLION per year. So you can only imagine the yield investors will require to lend money to Uncle Sam for any time period a year from now when our debt is over $35 trillion and we’re still running a ~$1 TRILLION deficit.

The below chart needs no explanation. Long-term Treasuries have broken their multi-decade trendline. They are now sitting on CRITICAL support. Once that green line goes, the debt crisis begins.

As I keep warning, the Great Debt Crisis of our lifetimes is fast approaching.

In 2000, the Tech Bubble burst.

In 2007, the Housing Bubble burst.

The Great Debt Bubble burst in 2022. And the crisis is now approaching.

If you’ve yet to take steps to prepare for what’s coming, we just published a new exclusive special report How to Invest During This Bear Market.

It details the #1 investment to own during the bear market as well as how to invest to potentially generate life changing wealth when it ends.

Normally this report would be sold for $249. But we are making it FREE to anyone who joins our Daily Market Commentary Gains Pains & Capital.To pick up your copy, swing by: 

https://phoenixcapitalmarketing.com/BM.html

This image has an empty alt attribute; its file name is signature.jpg
Posted by Phoenix Capital Research in Debt Bomb, Inflation

Japan’s Currency Hasn’t Traded Here Since the Late 1980s!

By Graham Summers, MBA

Japan’s currency is now collapsing.

Japan’s central bank, the Bank of Japan (or BoJ for short) is currently engaged in an open-ended Quantitative Easing (QE) program. In its simplest rendering, the BoJ starts buying the 10-Year Japanese Government Bond any time that bond’s yield rises to 1% or higher.

It’s possibly the boldest QE program in history: a definitive “line in the sand” drawn by a major central bank as far as bonds are concerned. Again, this is an open-ended, unlimited QE program through which a MAJOR central bank does whatever it takes to keep is country’s bond yields from rising.

However, even this program is proving inadequate.

The BoJ has had to engage in previously unscheduled bond market interventions SIX TIMES in the last four weeks. And yesterday, it finally gave in and announced that its “line in the sand” of 1% for the yield on the 10-Year Japanese Government bond is now a “loose upper bound” instead of a definitive cap.

The below chart needs little explanation.

In response to this announcement, Japan’s currency, the Yen, broke to new lows. The Yen hasn’t traded at this level since the late 1980s!

This is the end game for every major central bank: the gradual losing control of the bond market… and having to sacrifice your currency in order to stave off a debt crisis. But even that won’t work eventually as the weaker the currency, the less value bonds will have.

As I keep warning, the Great Debt Crisis of our lifetimes is fast approaching.

In 2000, the Tech Bubble burst.

In 2007, the Housing Bubble burst.

The Great Debt Bubble burst in 2022. And the crisis is now approaching.

If you’ve yet to take steps to prepare for what’s coming, we just published a new exclusive special report How to Invest During This Bear Market.

It details the #1 investment to own during the bear market as well as how to invest to potentially generate life changing wealth when it ends.

Normally this report would be sold for $249. But we are making it FREE to anyone who joins our Daily Market Commentary Gains Pains & Capital.To pick up your copy, swing by: 

https://phoenixcapitalmarketing.com/BM.html

This image has an empty alt attribute; its file name is signature.jpg
Posted by Phoenix Capital Research in Central Bank Insanity, Debt Bomb