The $USD continues to drop like a brick, having taken out critical support in the near-term.
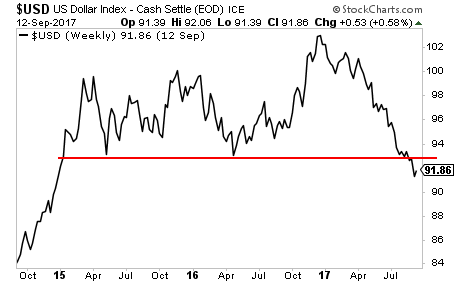
This is just the beginning. It’s only going to get worse from here.
Here’s the $USD’s chart running back 40 years. I call this the “single most important chart in the world,” because how the $USD moves has a massive impact on all other asset classes.
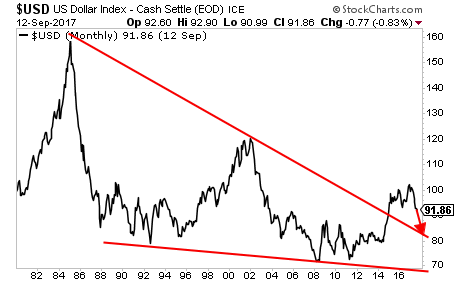
As you can see the $USD broke out of a massive 40 year falling wedge pattern. This initial breakout has failed to reach its ultimate target (120) and is now rolling over for a retest of the upper trendline in the mid-to low-80s.
Put simply, this chart is telling us that the $USD is going to be collapsing in the coming months.
The implications of this are going to be tremendous for the financial system. US corporate profits will be increasing particularly for large multi-national companies. Emerging Markets will outperform.
And most importantly, the $USD’s collapse is going to be like rocket fuel for inflation trades. Smart investors will use this trend to make literal fortunes.
If you’re not taking steps to actively profit from this, it’s time to get a move on.
We just published a Special Investment Report concerning a secret back-door play on Gold that gives you access to 25 million ounces of Gold that the market is currently valuing at just $273 per ounce.
The report is titled The Gold Mountain: How to Buy Gold at $273 Per Ounce
We are giving away just 100 copies for FREE to the public.
As I write this, there are 49 left.
To pick up yours, swing by:
https://www.phoenixcapitalmarketing.com/goldmountain.html
Best Regards
Graham Summers
Chief Market Strategist
Phoenix Capital Research
