Stocks have broken the bearish rising wedge formation that began in late-2016.
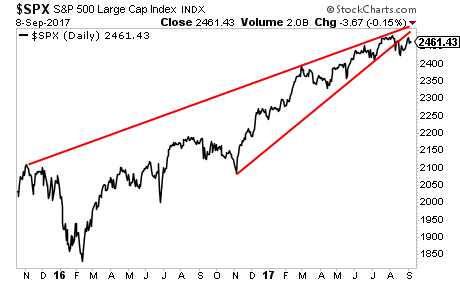
We might hold up here for a few more days, but there is now considerable risk to the downside.
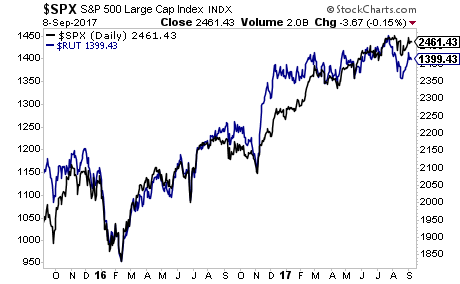
Indeed, the Russell 2000, which usually leads the S&P 500, has already rolled over and has begun breaking down. This is a major warning for stocks.
The Russell 2000 should be roaring higher. It’s not. Instead it’s rolling over.
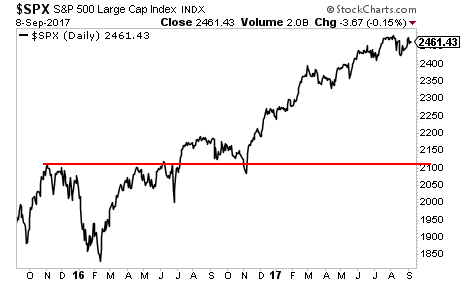
And given how much the market has been rigged just to keep stocks afloat, we have the makings of a SERIOUS drop. As in a collapse to 2,100 on the S&P 500 in a matter of sessions.
You’ve been warned.
We offer a FREE investment report outlining when the market will collapse as well as what investments will pay out massive returns to investors when this happens. It’s called Stock Market Crash Survival Guide.
We made 1,000 copies to the general public.
As I write this, only 29 are left.
To pick up one of the last remaining copies…
Best Regards
Graham Summers
Chief Market Strategist
Phoenix Capital Research
