stock collapse?

Don’t Fall For the Manipulations… Another Bloodbath is Coming!

By Graham Summers, MBA

“Someone” is manipulating stocks higher. And the manipulations are getting even more desperate.

Over the last two weeks, there has been a determined effort to manipulate the stock market higher. Time and again, stocks have gone vertical on new news or no major developments.

Financial institutions do NOT attempt to move markets. In fact, the traders charged with executing these institutions’ trades are graded based on their ability to buy and sell large chunks of stocks without moving the tape.

Which is why we knew that no real investor was responsible for the moves that occurred yesterday from 9:35AM to 11:00AM, again at 3PM and finally at 3:40PM. All three of those moves saw the S&P 500 move 20-50 points on no news or developments.
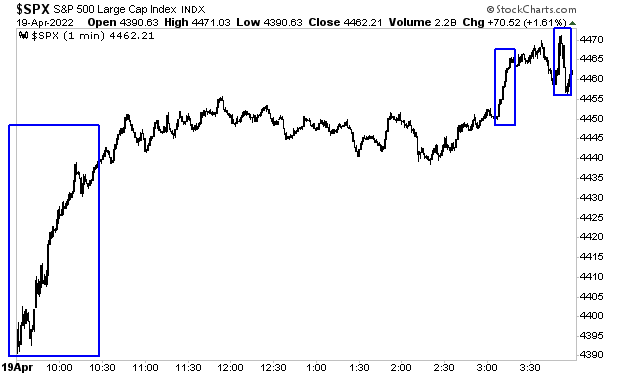
No real investor does this. This is egregious manipulation. And it shows us that the manipulators are becoming increasingly desperate.

Why?

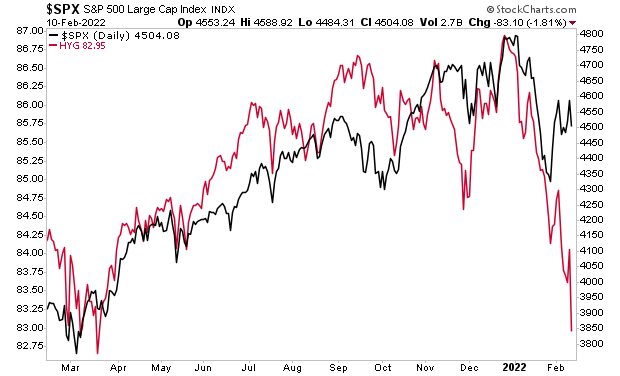
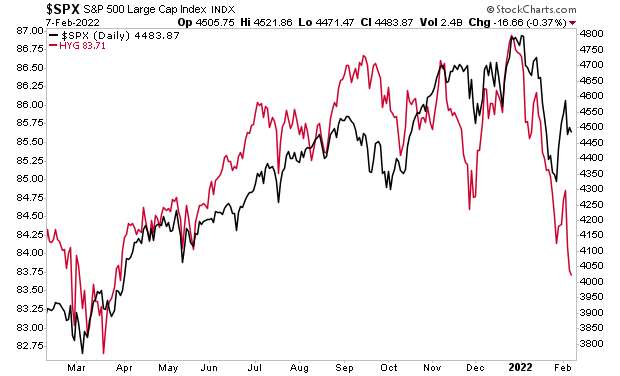
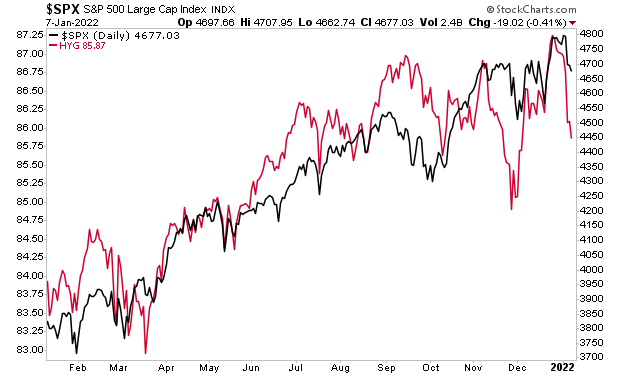
High yield credit, which typically leads the stock market, is telling us the S&P 500 should be down at 3,900 (stocks are at 4,400 right now). You can see it lead stocks higher throughout 2021. And now it’s leading them lower. Without manipulation, the S&P 500 would easily be sub-4000.
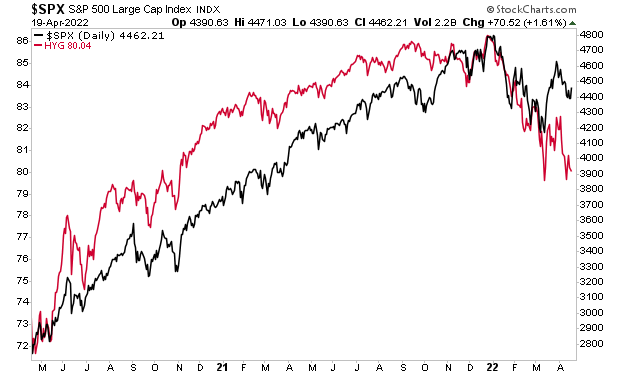
In simple terms, the signs are clear: another bloodbath is coming. The markets will soon be a sea of red again. And the losses will be staggering.

And it’s just the beginning. It’s quite possible the markets are entering a prolonged BEAR MARKET… a time in which stocks lose 50% or more over the course of months.

For those looking to prepare and profit from this mess, our Stock Market Crash Survival Guide can show you how.

Within its 21 pages we outline which investments will perform best during a market meltdown as well as how to take out “Crash insurance” on your portfolio (these instruments returned TRIPLE digit gains during 2008).

To pick up your copy of this report, FREE, swing by:

https://phoenixcapitalmarketing.com/stockmarketcrash.html

Posted by Phoenix Capital Research in stock collapse?

This Is the Only Trigger I Know Of That Predicted the 2020 Crash… What’s It Saying Today?

By Graham Summers, MBA

Thus far this week, we’ve been noting an extremely odd development. And it’s left strategic investors feeling uneasy to say the least.

Stocks, the asset class most investors pay attention to, have erupted higher. Indeed, if you only look at stocks by themselves… everything looks great right now.

The S&P 500 has gone straight up, rising well above both its 50-day moving average (DMA) and its 200-DMA. And who would have thought we’ve be within 4% of new all time highs!

Meanwhile, beneath the surface, the bond market is flashing major warning signs.

“So what?” thinks the stock investor, “bonds are boring. They only rally 2% on a big day. Stocks are up 10% and some stocks as much as 50% in a week!”

Bonds are the bedrock of our current financial system. Their yields represent the “risk free rate” of return against which every asset class, including stocks, are valued. So if bonds are signaling trouble, the entire financial system is in trouble.

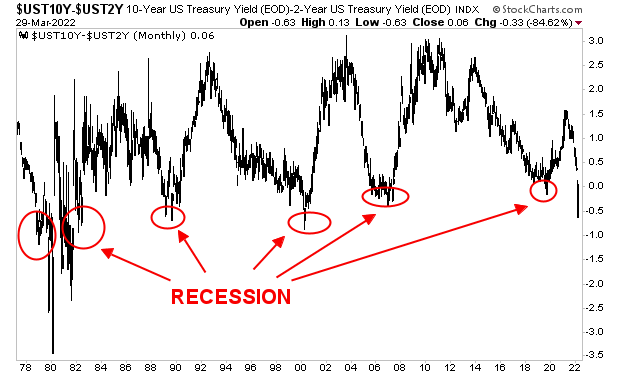
The yield curve, which is a means of measuring risk in the bond market, is now inverted. This is a MAJOR recession signal that has predicted every recession since the mid-1970s. This includes the brief, but horrific C.O.V.I.D.-19 recession of 2020. And yes, bonds somehow “knew” about that in advance.

Again, this trigger has hit before every recession going back 50 years. And it just hit again.

What are the odds it’s different this time?

Look, I get it, stocks are up… a lot. Some stocks like Tesla (TSLA) or AMC Entertainment Holdings (AMC) are up 50% or more in just a week! So who cares about boring old bonds?

Everyone should… especially after bonds predicted the 2020 recession and crash… something fewer than 1% of investors got right. And the fact so few investors are payng attention to bonds today is enough to make you wonder if another, equally ugly situation is about to unfold.

Bonds terrified, but stocks in la la land? This is the kind of environment in which crashes happen.

For those looking to prepare and profit from this mess, our Stock Market Crash Survival Guide can show you how.

Within its 21 pages we outline which investments will perform best during a market meltdown as well as how to take out “Crash insurance” on your portfolio (these instruments returned TRIPLE digit gains during 2008).

To pick up your copy of this report, FREE, swing by:

https://phoenixcapitalmarketing.com/stockmarketcrash.html

Posted by Phoenix Capital Research in stock collapse?

WARNING: The Bedrock of the Financial System is Cracking

By Graham Summers, MBA

Do you feel that?

I’m sure on some level you do…

Something isn’t right about this rally in stocks. Something doesn’t add up. In fact, something very bad is brewing in the financial system.

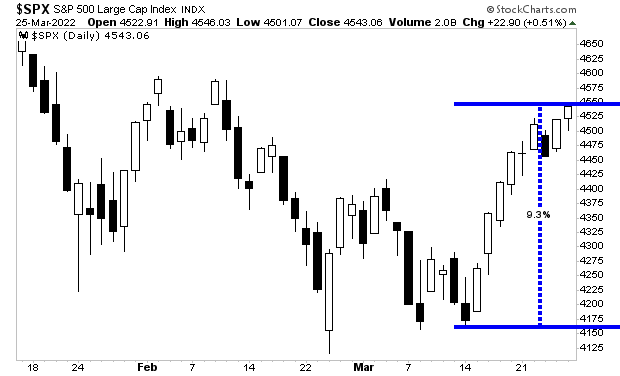
Stocks have erupted higher over the last week, rising 9%.

However, beneath the surface, something truly incredible is happening. In fact, it’s horrifying.

I’m talking about the bond market.

The media likes to focus on the stock market because stocks are “sexy” and grab the public’s attention. However, the reality is that the stock market is one of the smallest asset classes out there. Globally the stock market is about $89 trillion.

By way of comparison, globally the debt markets are over $281 trillion. When you include derivatives that trade based on bond yields (debt interest payments) the amount balloons up over $750 trillion.

Which is why, the complete carnage occurring in bonds should terrify everyone. Across the board, bond prices are collapsing while bond yields skyrocket.

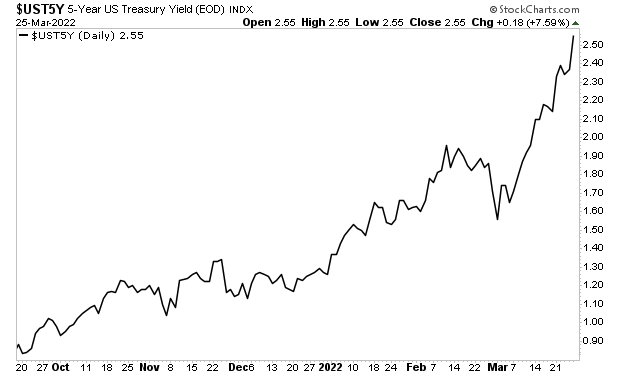
The yield on the 5- Year U.S., Treasury is up 100 basis points this month. 100 basis points. It rose over 20 basis points last week alone.

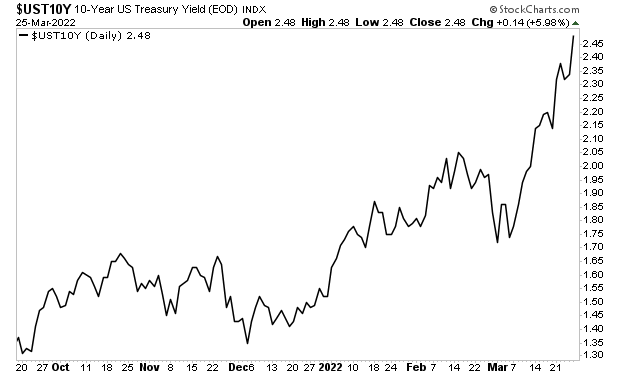
The yield on the all-important 10-Year U.S. Treasury (the most important bond in the world) is also exploding higher. It’s up almost 75 basis points this month, roaring higher by 13 basis points last week alone.

I realize most of you likely don’t follow the bond market…  but you have to remember that  our current financial system is debt-based.

The $USD is not backed by anything finite, and U.S. Treasuries are the senior most asset class owned by the large financial institutions. They are literally the bedrock of our current financial system.

And the bedrock is cracking in a big way.

Imagine the impact it would have on a skyscraper if the bedrock, which supports its foundation began to crack… that’s where we are with the financial system today.

For those looking to prepare and profit from this mess, our Stock Market Crash Survival Guide can show you how.

Within its 21 pages we outline which investments will perform best during a market meltdown as well as how to take out “Crash insurance” on your portfolio (these instruments returned TRIPLE digit gains during 2008).

To pick up your copy of this report, FREE, swing by:

https://phoenixcapitalmarketing.com/stockmarketcrash.html

Posted by Phoenix Capital Research in stock collapse?

If You Believe This… Please Stop Reading Now

By Graham Summers, MBA

The bottom is in.

As everyone knows… the Fed has saved the day again!

On Tuesday, Fed Chair Jerome Powell announced that the Fed is NOT going to raise rates anymore. It’s not going to shrink their balance sheet either. And best of all… inflation which entered the financial system for the first time in 40 years… is actually disappearing and will soon be gone!

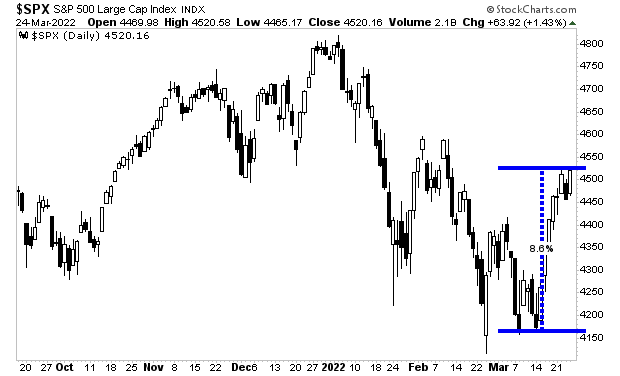
That’s what stocks think, isn’t it? After all, they’ve rallied over 8% in a single week.

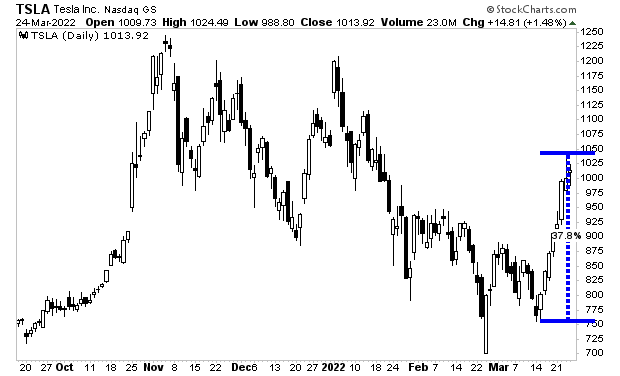
Heck, Tesla (TSLA) is up over 35% in one week’s time!

Oh wait… the Fed didn’t say any of that. 

In fact, Jerome Powell said the following on Tuesday:

1) Inflation is MUCH too high.

2) If the Fed finds that raising rates by 0.25% is not enough, it will begin raising by 0.5% at every Fed meeting.

3) If the Fed finds that it is not curbing inflation adequately, it is willing to overshoot to the upside with rate hikes.

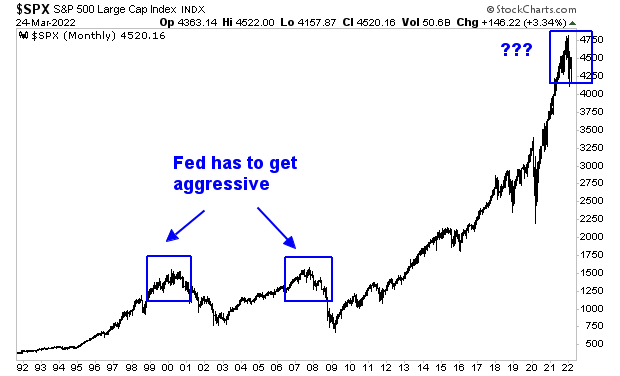
So, the Fed is going to be a LOT MORE aggressive than people think. If anything, it’s warning the markets that it’s going to have to raise rates a LOT and quite QUICKLY.

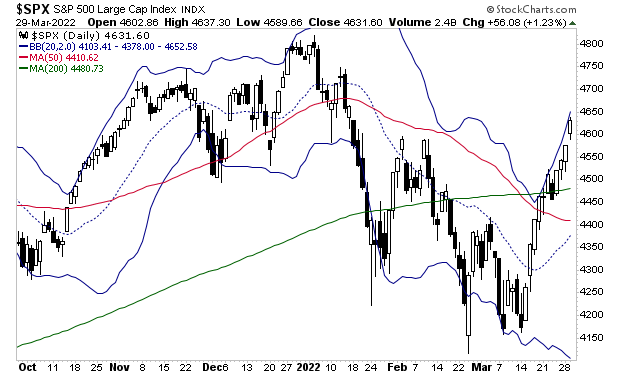
Here’s what happened the last two times the Fed did this. I’m sure the third time’s the charm!

If you believe the Fed will somehow be able to stop inflation without blowing up the markets, please stop reading now.

However, if you’re a clear-thinking investor, someone who doesn’t fall for hype and nonsense… someone who is serious about using the markets to produce extraordinary gains… you should download our Stock Market Crash Survival Guide now.

Within its 21 pages we outline which investments will perform best during a market meltdown as well as how to take out “Crash insurance” on your portfolio (these instruments returned TRIPLE digit gains during 2008).

To pick up your copy of this report, FREE, swing by:

https://phoenixcapitalmarketing.com/stockmarketcrash.html
Posted by Phoenix Capital Research in stock collapse?

Stocks Are On the Ledge of a Cliff

The stock market is clinging to the ledge of a cliff.

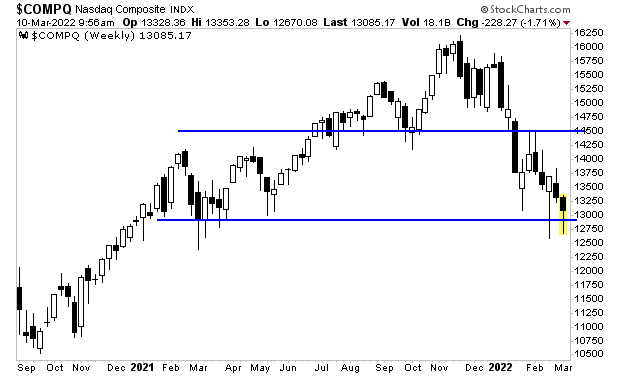
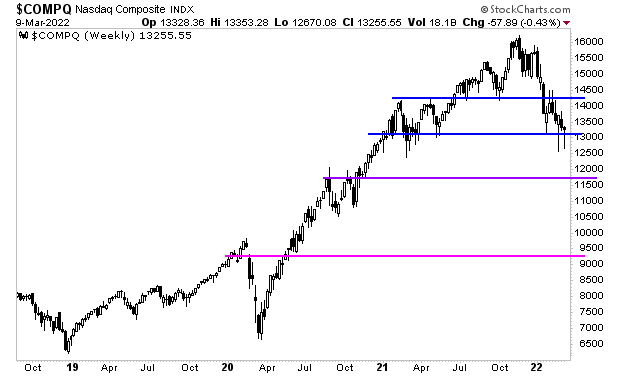
The weekly chart of the NASDAQ is truly. Tech stocks have been trading in a wide range since stocks peaked in November 2021. And they are just BARELY clinging to the lower line of this range on a weekly basis.

Why is this a big deal? Because if the NASDAQ closes below the lower line of this range on a weekly basis, it opens the door to an unwind of most if not ALL of the COVID-19 bull market. This would mean a 40%-50% collapse from current levels.

And all of this is happening right as the Fed ends QE and starts raising rates. Meanwhile, the economy is rolling over and the tech-heavy market is barely able to rally.

Sounds like the recipe for a crash to me!

For those looking to prepare and profit from this mess, our Stock Market Crash Survival Guide can show you how.

Within its 21 pages we outline which investments will perform best during a market meltdown as well as how to take out “Crash insurance” on your portfolio (these instruments returned TRIPLE digit gains during 2008).

To pick up your copy of this report, FREE, swing by:

https://phoenixcapitalmarketing.com/stockmarketcrash.html
Posted by Phoenix Capital Research in stock collapse?

And Here Comes the Inflationary Recession

The Fed is now cornered courtesy of the coming inflationary recession.

Let’s start with the economy first.

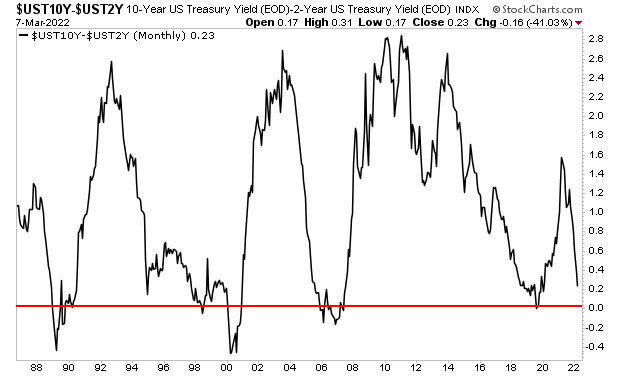
The 2s-10s yield curve is just a 19.4 basis points away from inversion. The last FOUR times this yield curve inverted the U.S. experienced a recession soon after. I’ve identified that line on the chart below:

Chart

Description automatically generated

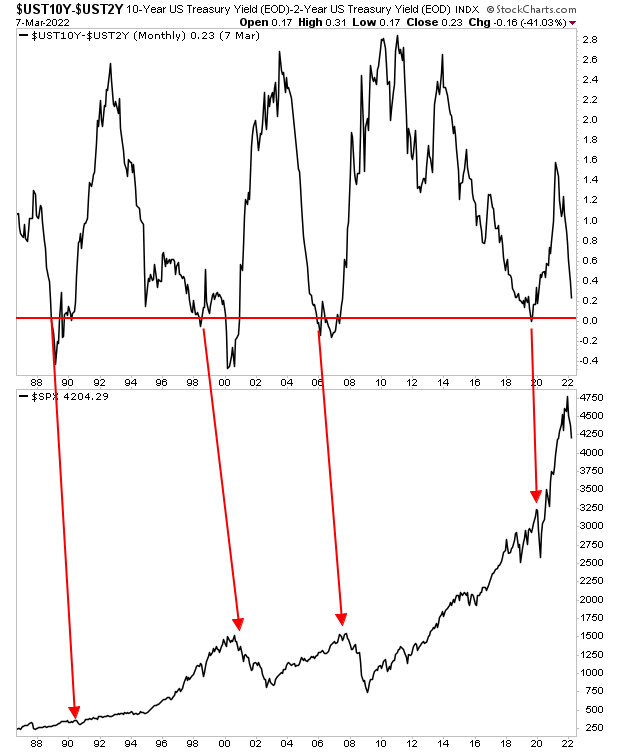
A recession is bad enough news because it means a bear market in stocks and most likely a crash. Here’s that same chart with the S&P 500 below it. Note what happened to stocks soon after the yield curve inversion hit (note that the 1990 market saw a 17% drop, but the chart doesn’t show it well).

A picture containing chart

Description automatically generated

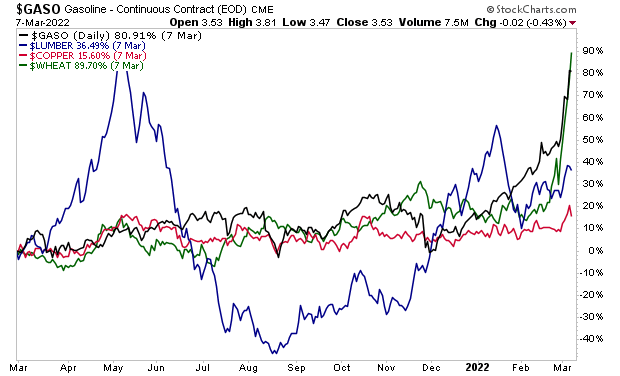
On top of this, inflation is roaring in the financial system. Gasoline is up 80% in the last 12 months. Lumber is up 36%. Copper is up 15%. And wheat has exploded 90% higher!

Chart, histogram

Description automatically generated

Remember, the consumer accounts for 75% of GDP in the U.S. What do you think happens to consumer spending when inflation eats into incomes? There is a reason Presidential ratings are highly correlated to gasoline prices!

And all of this is happening when the Fed only just ended QE and still has rates at zero.

Yes, we are rapidly heading into an inflationary recession, and the Fed hasn’t even begun tightening yet. If the Fed tightens to rapidly to kill inflation, the economy collapses. And if the Fed takes its time raising rates, inflation rages, and the economy again collapses.

The Fed is officially cornered. There is no possible way to navigate this mess without disaster. Remember the last four recessions involved a stock market crash. This one will likely prove no different.

For those looking to prepare and profit from this mess, our Stock Market Crash Survival Guide can show you how.

Within its 21 pages we outline which investments will perform best during a market meltdown as well as how to take out “Crash insurance” on your portfolio (these instruments returned TRIPLE digit gains during 2008).

To pick up your copy of this report, FREE, swing by:

https://phoenixcapitalmarketing.com/stockmarketcrash.html
Posted by Phoenix Capital Research in Inflation, stock collapse?

The Single Best Predictor of a Recession is Signaling “WARNING!”

By now, you’re no doubt getting pretty worried about the markets.

After all, why wouldn’t you?

Russia has invaded Ukraine which has massive implications for natural resources. Oil is over $120 a barrel. The stock market is already down over 10% from its recent highs.

It’s enough to stress anyone out!

Well, unfortunately we now need to add the following: the U.S. will likely enter a recession late this year or early in the next.

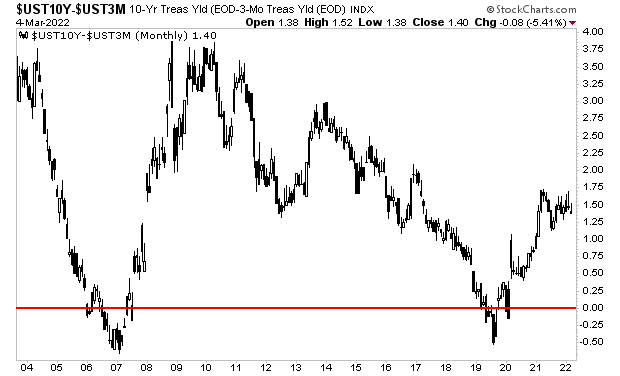
According to the Fed’s research, the most accurate predictor of a recession is the 10-year/ 3 month U.S Treasury yield curve, or the difference between the yield on the 10-Year U.S. Treasury and the yield on the 3-month U.S. Treasury.

Whenever this yield curve breaks below 0%, the U.S. has entered a recession. I’ve identified this level on the chart below.

Chart

Description automatically generated

The bad news today is that this yield curve is currently rolling over in a big way.

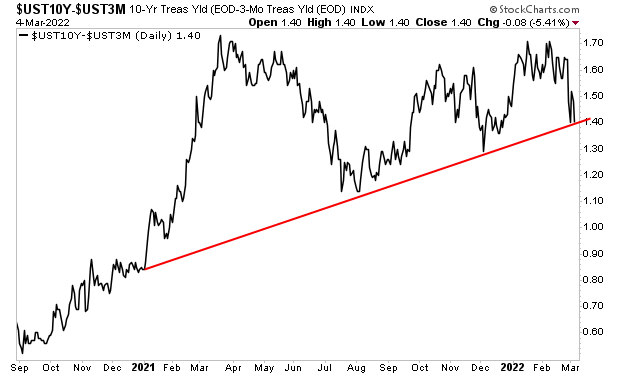
As I write this, it’s about to take out its upward trendline (red line in the chart below). This would mean that the yield curve is no longer trending in a positive manner but is heading downwards to the dreaded ZERO that predicts a recession.

Put another way, a break of this level would almost assuredly trigger a yield curve inversion… which would mean a recession is just around the corner.

Line chart

Description automatically generated with medium confidence

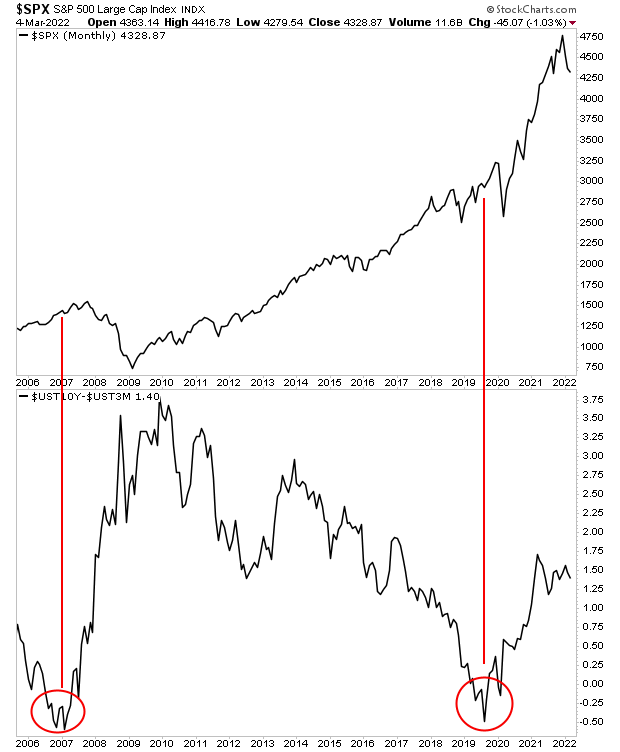
Please note, the last two recessions triggered stock market crashes. The yield curve inverted a mere six to nine months before the crash hit. This means we can expect a full blown crash some time later this year or early in the next

Chart, histogram

Description automatically generated

You’ve been warned.

For those looking to prepare and profit from this mess, our Stock Market Crash Survival Guide can show you how.

Within its 21 pages we outline which investments will perform best during a market meltdown as well as how to take out “Crash insurance” on your portfolio (these instruments returned TRIPLE digit gains during 2008).

To pick up your copy of this report, FREE, swing by:

https://phoenixcapitalmarketing.com/stockmarketcrash.html
Posted by Phoenix Capital Research in stock collapse?

The Chop is Here and Next Comes the Final Puke

Three weeks ago, I told our clients that I believed the stock market would act in such a way as to induce the greatest amount of suffering to the greatest number of investors.

This meant the market trading in a “chopping” fashion, moving in a large range designed to hurt bulls and bears alike.

In simple terms, when stocks get to the top of the range, the bulls will get excited only to see stocks roll over and drop back down. And similarly, when stocks get to the bottom of the range, the bears will get excited, only to then see stocks rally hard.

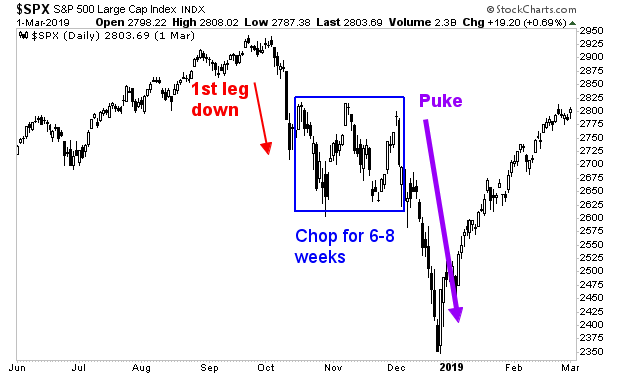
Indeed, this whole pattern since the start of the year has been reminiscent of the late-2018 market collapse. That represents the last time the Fed attempted to normalize policy, only to backtrack once something “broke.”

That pattern was:

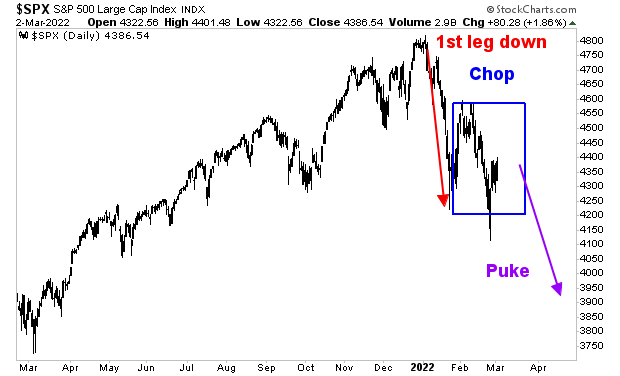
  1. An initial leg down
  2. Several weeks of chop
  3. A final puke to new lows.

In chart form, it looked like this:

In terms of today’s market, the first leg down occurred in late January. We are now 3-4 weeks into the “chop” which means the final puke to new lows is just around the corner.

Chart

Description automatically generated

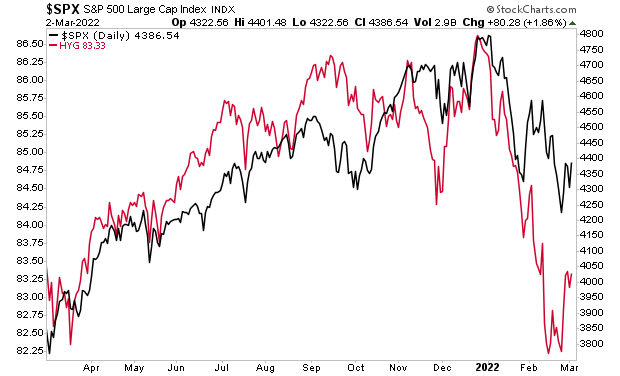
High yield credit is warning us about this in a big way.

Chart, line chart

Description automatically generated

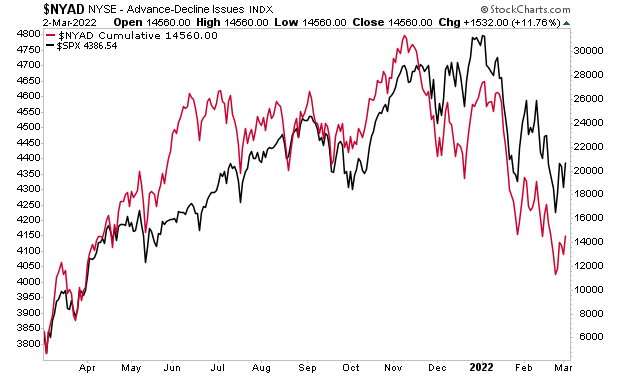
So is breadth.

Chart, line chart

Description automatically generated

For those looking to prepare and profit from this mess, our Stock Market Crash Survival Guide can show you how.

Within its 21 pages we outline which investments will perform best during a market meltdown as well as how to take out “Crash insurance” on your portfolio (these instruments returned TRIPLE digit gains during 2008).

To pick up your copy of this report, FREE, swing by:

https://phoenixcapitalmarketing.com/stockmarketcrash.html
Posted by Phoenix Capital Research in stock collapse?

How Oil Will Trigger a Stock Market Crash

Russia’s invasion of Ukraine has laid bare all the misguided, naïve policies our “leaders” have foisted upon us in the last 18 months.

Among the more foolish policies enacted by U.S. policymakers is the idea that the U.S. should NOT be energy independent but should rely on outside sources for oil.

Within days of taking office, President Biden ended the development of the Keystone XL Pipeline while putting an indefinite pause on new oil and natural gas leases on public lands.

Months later he was asking OPEC to increase production of oil because oil and gasoline prices skyrocketed. Thus far, gas is up over 90% during the Biden Presidency, while oil is close behind at 80%.

Chart, line chart

Description automatically generated

Maybe we shouldn’t rely on countries that benefit from higher oil prices for our energy needs? Maybe those Executive Orders weren’t such a good idea? Maybe we should have people running our energy policy who actually know how many barrels of oil the U.S. consumers per day?

The icing on this cake of incompetence is the fact that the U.S. is directly financing Russia’s invasion of Ukraine. Russia supplies 7% of the U.S.’s energy needs. We are literally sending money to Putin every single day of the week… while calling him a monster. Maybe we should… stop buying oil from him!?!

As misguided as the Biden White House has been about energy policy, Europe’s leaders make it looks a bunch of geniuses. To that effect, Europe has been shutting down nuclear power plants and other sources of domestic energy production for years… all while signing deals with Vladimir Putin to supply its energy needs.

Currently Russia supplies ~40% of Europe’s gas and more than 25% of its oil.

How insane, or corrupt, or simply ignorant do you have to be to shut down domestic energy production and hand your energy needs over to Vladimir Putin? A kindergartener could tell you this was a dumb idea. But Europe’s elites signed off on it.

The end result?

Oil is above $100 a barrel for the first time since 2014. And there is little if any signs it’s not going much higher.

This is going to trigger a global recession… which in turn will trigger a market crash.

The world economy which was already fragile due to roaring inflation and supply chain issues will now be contending with an energy crisis. How do you think the economy will handle $100 oil when inflation was already at major problem when oil was at $80 a barrel?

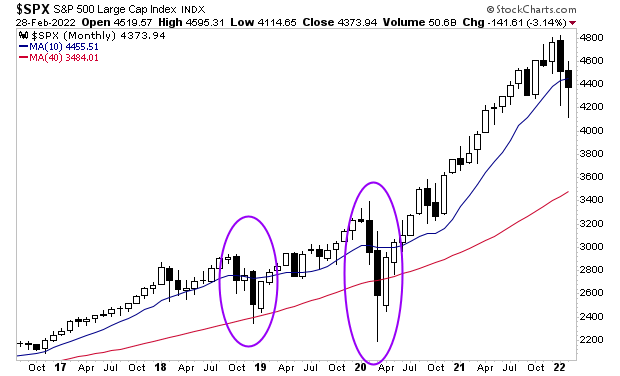
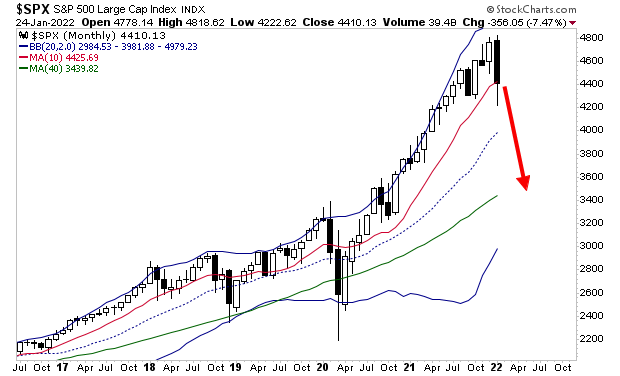
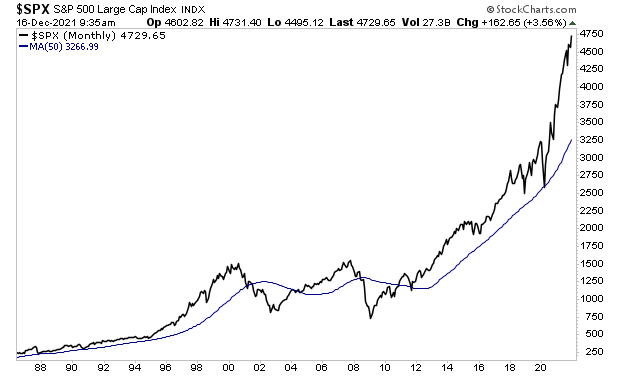
Stocks know what’s coming, as they have already broken below their 10-month moving average (MMA). The last two times this happened, the market ended up testing its 40-month moving average soon after (see the purple circles below).

That means the S&P 500 falling to 3,450 or so.

For those looking to prepare and profit from this mess, our Stock Market Crash Survival Guide can show you how.

Within its 21 pages we outline which investments will perform best during a market meltdown as well as how to take out “Crash insurance” on your portfolio (these instruments returned TRIPLE digit gains during 2008).

To pick up your copy of this report, FREE, swing by:

https://phoenixcapitalmarketing.com/stockmarketcrash.html
Best Regards,

Text, letter

Description automatically generated
Posted by Phoenix Capital Research in stock collapse?

The Investors Who Ignore This Are In For a NASTY Surprise

By Graham Summers, MBA

The stock market manipulations are getting even more desperate.

For weeks now, I’ve noted time and again that the only thing holding up the stock market was abject manipulation. 

Financial institutions do NOT attempt to move markets. In fact, the traders charged with executing these institutions’ trades are graded based on their ability to buy and sell large chunks of stocks without moving the tape.

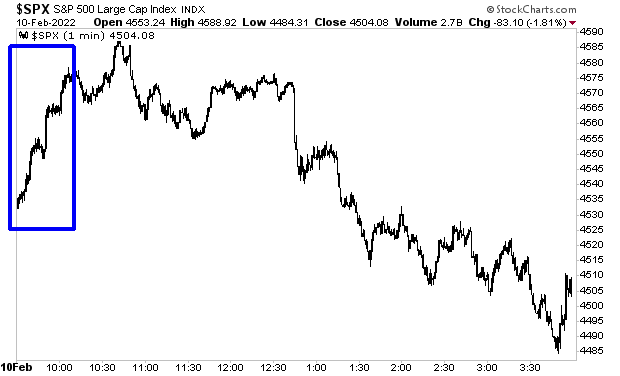
Which is why we knew that no real investor was responsible for the move that occurred yesterday at the open. I’m talking about the move that pushed stocks up from 4,535 to 4,575 in a matter of minutes on announcements that inflation has hit a 40-year high.

The CPI came in at 7.5% yesterday. The Fed’s funds rate is still at zero. Yesterday’s news means the Fed is WAAAAAYYY behind the curve on inflation and will need to hike rates aggressively.

So what investor would buy panic buy stocks based on this? The answer is NO ONE. This was egregious manipulation. And it shows us that the manipulators are becoming increasingly desperate.

Why?

The credit markets are imploding. They know what is coming. It ain’t pretty.

Let me be blunt here, if you’re not taking steps to prepare for what’s coming, NOW is the time to do so.

For those looking to prepare and profit from this mess, our Stock Market Crash Survival Guide can show you how.

Within its 21 pages we outline which investments will perform best during a market meltdown as well as how to take out “Crash insurance” on your portfolio (these instruments returned TRIPLE digit gains during 2008).

To pick up your copy of this report, FREE, swing by:

https://phoenixcapitalmarketing.com/stockmarketcrash.html
Best Regards,

Text, letter

Description automatically generated
Posted by Phoenix Capital Research in stock collapse?

Warning: The Next Bloodbath is About to Begin

By Graham Summers, MBA

The stock market is setting up for another puke.

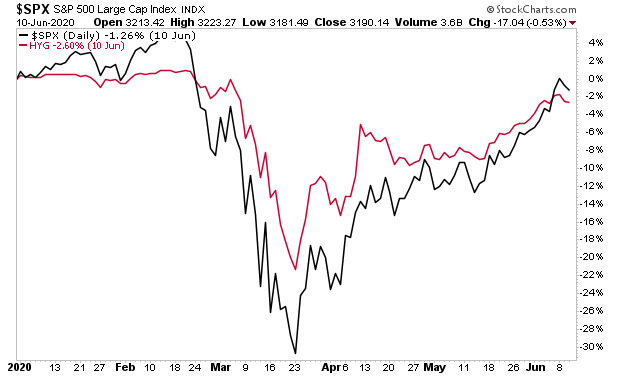
High yield credit typically leads the stock market. During the 2020 crash triggered by the economic shutdowns, high yield credit was already flashing major warning signals as early as January, while stocks continued to rally into late February. By the time stocks figured “it out” it was an absolute bloodbath. 

Now, take a look at what high yield credit is doing today.

In simple terms, the signs are clear: another bloodbath is coming. The markets will soon be a sea of red again. And the losses will be massive.

And it’s just the beginning. It’s quite possible the markets are entering a prolonged BEAR MARKET… a time in which stocks lose 50% or more over the course of months.

The coming bust is going to be life-changing for many people. Most will lose much if not everything. But a small number of investors will generate LITERAL FORTUNES.

Let me be blunt here, if you’re not taking steps to prepare for what’s coming, NOW is the time to do so.

For those looking to prepare and profit from this mess, our Stock Market Crash Survival Guidecan show you how.

Within its 21 pages we outline which investments will perform best during a market meltdown as well as how to take out “Crash insurance” on your portfolio (these instruments returned TRIPLE digit gains during 2008).

To pick up your copy of this report, FREE, swing by:

https://phoenixcapitalmarketing.com/stockmarketcrash.html
Best Regards,

Posted by Phoenix Capital Research in stock collapse?

Will It Be a Crash, New All Time Highs, Something Else? Let’s Find Out!

By Graham Summers, MBA

You’re no doubt confused by the market’s action of the last week. Are we about to see a waterfall crash… or are stocks about to explode higher to new highs? 

The answer is probably neither. 

Markets are tricky things. More often than not, their goal is to induce the maximum amount of suffering to the maximum number of investors.

So let’s dive in together and sort this out.

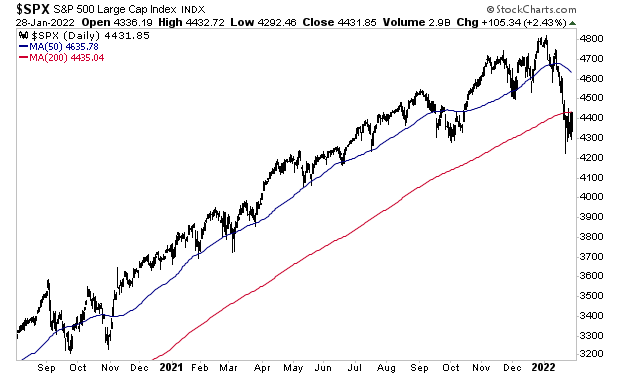
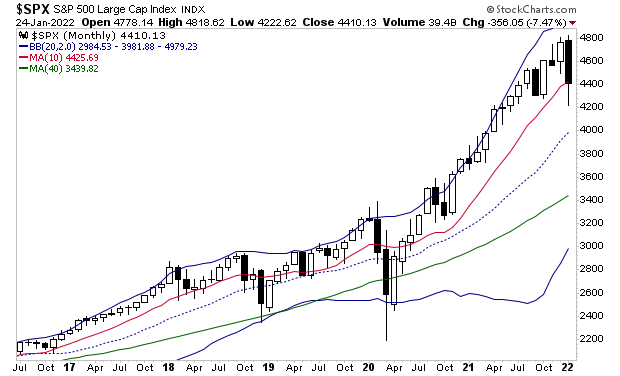
On a daily and weekly basis, the S&P 500 is now trending down. The market broke below its 200-day moving average (DMA) for the first time since the March 2020 lows. That’s a BIG deal and suggests a new bear market is here.

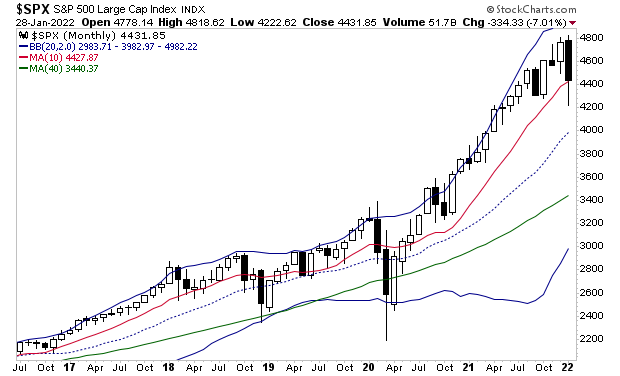
However, on a monthly basis, the S&P 500 can still end January above the all-important 10-monthly moving average (MMA)at 4,427. This is a BIG deal for the bulls because every time the market has broken that line in the last five years, a bear market has hit, with stocks losing 20%-30% of their value quite rapidly.

Where does this leave us?

Well we’re likely to see the bulls push to end January (today) with the market above 4,417. After that, I wouldn’t see surprised to see total chaos in the markets with prices whip-sawing this way and that… much as they did last week.

However, the trend is DOWN which opens the door to some nasty drops in the future. The average bear market is 9-10 months and sees stocks lose 30% of their value. However, in recent years the drops have happened much faster than that.

For those looking to prepare and profit from this mess, our Stock Market Crash Survival Guidecan show you how.

Within its 21 pages we outline which investments will perform best during a market meltdown as well as how to take out “Crash insurance” on your portfolio (these instruments returned TRIPLE digit gains during 2008).

To pick up your copy of this report, FREE, swing by:

https://phoenixcapitalmarketing.com/stockmarketcrash.html
Best Regards,

Posted by Phoenix Capital Research in stock collapse?

Warning: Stocks Are About to Start a Bear Market

Stocks have taken out critical support.

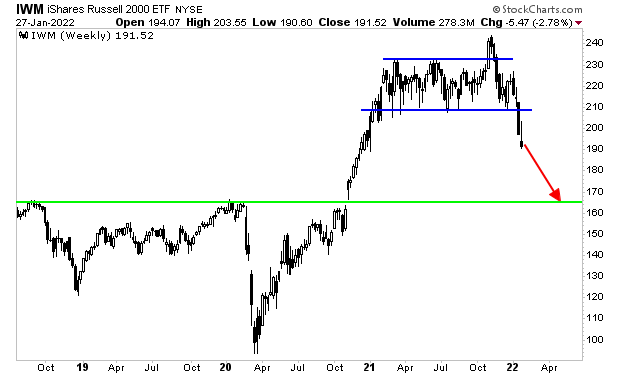
The Russell 2000 is perhaps the “junkiest” index among stock indexes with 31% of its companies NOT making profits. So, if the Fed is indeed looking to deflate the stock market bubble, this would be the first index to collapse.

Sure enough, it is collapsing. As I write this Friday morning, it has taken out critical support. By the look of things, we will be unwinding the entire stock market move of the last 24 months, returning to pre-COVID levels.

Chart, histogram

Description automatically generated

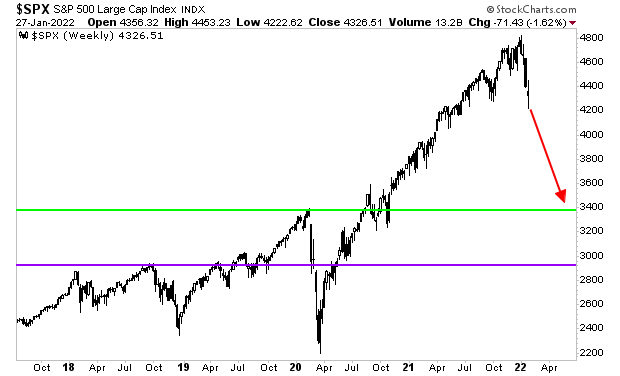
A similar price move in the S&P 500 sees it at 3,400, or possibly even lower. That’s a full 20% down from here.

Chart, histogram

Description automatically generated

For those looking to prepare and profit from this mess, our Stock Market Crash Survival Guidecan show you how.

Within its 21 pages we outline which investments will perform best during a market meltdown as well as how to take out “Crash insurance” on your portfolio (these instruments returned TRIPLE digit gains during 2008).

To pick up your copy of this report, FREE, swing by:

https://phoenixcapitalmarketing.com/stockmarketcrash.html
Best Regards,

Posted by Phoenix Capital Research in stock collapse?

Stocks are on the ledge of a VERY large cliff.

Anytime the S&P 500 has taken out its 50-week moving average (WMA), it usually falls to the middle of its Bollinger Band, if not the 200-WMA. In chart terms below, anytime the S&P 500 takes out the red line, it drops to the blue dotted line if not the green line.

If stocks hold right here and now, then we have escaped a bear market by the skin of our teeth. If stocks DON’T hold right here and now, it’s a bear market and stocks will eventually drop another 10% if not 20%.

I’m talking about this:

Chart, histogram

Description automatically generated

What happens right now is key. If stocks hold these gains, then this recent drop was likely just a plain vanilla sell-off to take out the excess froth in the markets. 

However, if, instead of holding those gains, stocks roll over and begin falling again, then we are likely at the start of a more pronounced breakdown and possibly a new bear market.

For those looking to prepare and profit from this mess, our Stock Market Crash Survival Guidecan show you how.

Within its 21 pages we outline which investments will perform best during a market meltdown as well as how to take out “Crash insurance” on your portfolio (these instruments returned TRIPLE digit gains during 2008).

To pick up your copy of this report, FREE, swing by:

https://phoenixcapitalmarketing.com/stockmarketcrash.html
Best Regards,

Posted by Phoenix Capital Research in stock collapse?

My Roadmap For Where Stocks Go From Here (And How to Profit)

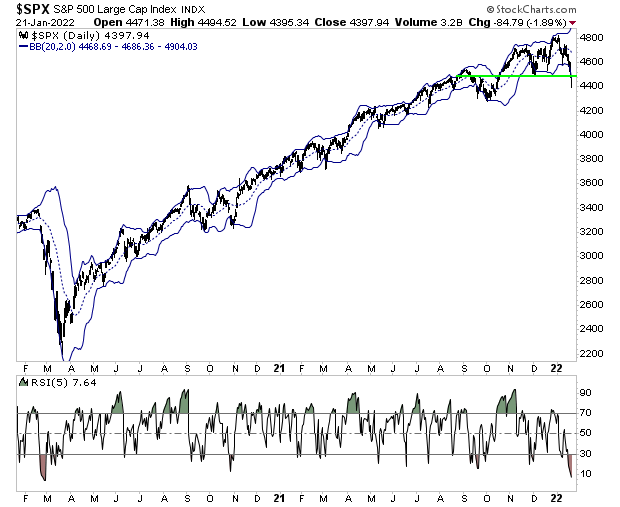
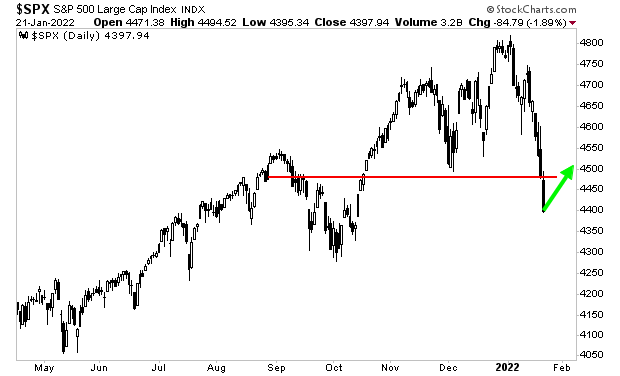
Stocks took it on the chin last week, slicing through critical support at 4,480 on the S&P 500. All told, this sell-off has erased six months’ worth of gains bringing stocks back to the levels of last August 2021.

Chart, histogram

Description automatically generated

The big question for investors this week is: where do we go from here?

First and foremost, the market is deeply oversold. The S&P 500 is well below the lower Bollinger Band on its daily chart. The market is also showing the lowest relative strength index (RSI) reading since the March 2020 crash. Yes, the market is as oversold as it was during the first wave of the global pandemic.

A picture containing graphical user interface

Description automatically generated

This suggests a bounce is coming. It is highly unlikely stocks go straight down from here. Instead, we are likely to get a rally into this week’s FOMC on Wednesday, with the S&P 500 revisiting former support, if not breaking a little above it. I’ve drawn this out on the chart below.

Chart, histogram

Description automatically generated

What happens there is key. If stocks hold those gains, then this recent drop was likely just a plain vanilla sell-off to take out the excess froth in the markets.

However, if, instead of holding those gains, stocks roll over and begin falling again, then we are likely at the start of a more pronounced breakdown and possibly a new bear market.

For those looking to prepare and profit from this mess, our Stock Market Crash Survival Guidecan show you how.

Within its 21 pages we outline which investments will perform best during a market meltdown as well as how to take out “Crash insurance” on your portfolio (these instruments returned TRIPLE digit gains during 2008).

To pick up your copy of this report, FREE, swing by:

https://phoenixcapitalmarketing.com/stockmarketcrash.html
Best Regards

Posted by Phoenix Capital Research in stock collapse?
Is the $USD Warning That Inflation is About to Become BAD News For Stocks?

Is the $USD Warning That Inflation is About to Become BAD News For Stocks?

By Graham Summers, MBA

Yesterday, I outlined how the markets are likely at a very critical point regarding inflation.

By quick way of review:

1)    Stocks initially love inflation because it boosts results (companies don’t report inflation-adjusted returns, so any increase in product pricing due to inflation is instead reflected as “growth”).

2)    This love relationship eventually turns to hatred as inflation leads to higher operating costs, which squeeze profit margins.

In yesterday’s article, I illustrated how this played out during the last major bout of inflation in the 1970s. 

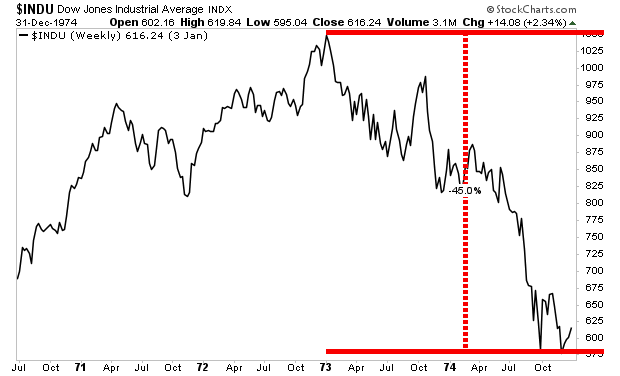
At that time, stocks initially roared higher as inflation initially boosted corporate results. However, by the time 1974 rolled around and inflation (as measured by the consumer price index or CPI) hit 11%, stocks began to crash, eventually losing ~50%.

I mention all of this because it is highly likely that something similar is about to manifest in the markets today.

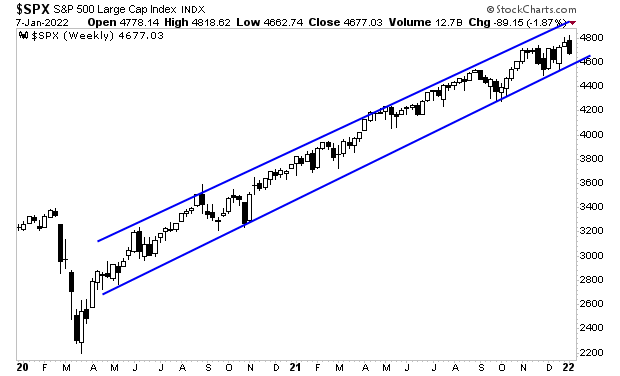
Stocks have erupted higher on the back of inflation, courtesy of $11 trillion in Fed QE/ fiscal stimulus from the Federal Government between March 2020 and today.

However, inflation is now taking a turn for the worse. And, as usual, the signs are showing up in the currency markets first.

The Fed is in the process of ending its QE program. Fed officials have also signaled that they intend to raise rates three or four times this year. All of this should be highly U.S. dollar positive.

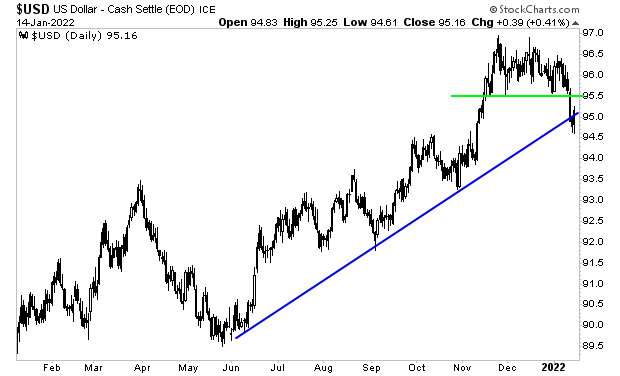
And yet… the $USD is breaking down.

The greenback has taken out key support (green line in the chart below). Even worse, it’s also broken its bull market trendline (blue line in the chart below).

Chart, histogram

Description automatically generated

This is a MAJOR signal that the Fed’s actions are not enough. Put another way, the Fed is behind the curve on inflation! This is extremely negative for stocks as it means inflation is getting out of control (just like in 1974).

So, what would a similar, 1970s-style crisis look like today? The market is warning us, though few have noticed.

For those looking to prepare and profit from this mess, our Stock Market Crash Survival Guidecan show you how.

Within its 21 pages we outline which investments will perform best during a market meltdown as well as how to take out “Crash insurance” on your portfolio (these instruments returned TRIPLE digit gains during 2008).

To pick up your copy of this report, FREE, swing by:

https://phoenixcapitalmarketing.com/stockmarketcrash.html
Best Regards

Posted by Phoenix Capital Research in Inflation, stock collapse?
The Fed Just “Rang the Bell”… Are You Ready For What’s Coming?

The Fed Just “Rang the Bell”… Are You Ready For What’s Coming?

By Graham Summers, MBA

The Fed just “rang the bell.”

One of the oldest adages in investing is that “they don’t ring a bell at the top.”

This is quite misleading.

While it’s true it’s impossible to predict the exact day of a market top, what is totally false is that there are not clear signals that a top is being made.

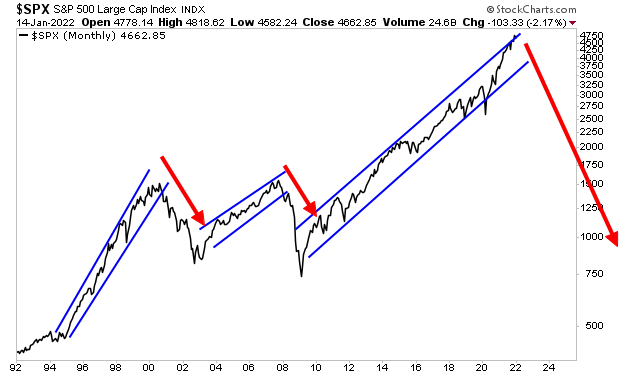
The clearest one of all, is the Fed aggressively tightening monetary policy. Indeed, the last two major bear markets (2000-2003 and 2007-2009) were both triggered by the Fed.

Why?

Because the markets move in similar cycles. And for over 20 years, the most important cycle has been the following:

1) The Fed ignores clear and obvious signs of a bubble for far too long.

2) The Fed is finally forced to act to attempt to deflate the bubble waaaaay past the point at which a soft landing is possible.

3) The bubble bursts in spectacular fashion triggering a crisis.

This was the case in 2000, 2007, 2018, and it’s the case today.

Yesterday Fed Chair Jerome Powell confirmed this with the following statement made to the U.S. Senate.

“If we see inflation persisting at higher levels, longer than expected, if we have to raise interest rates more over time, then we will.”

This is coming from the same Fed Chair who told the markets for the last year that inflation was “transitory” and didn’t require the Fed to act.

So what changed?

Inflation is now a politically toxic issue for voters. 2022 is an election year. And a CNN poll from December shows that the the #1 issue for voters is higher prices.

In this context, the Fed is receiving tremendous pressure from the Biden administration to stop inflation NOW. We know this because Fed Chair Jerome Powell only changed his tune on inflation AFTER he was nominated for a second term by President Biden.

That’s the bell.

Both the White House and the Fed want inflation killed. This means the Fed must now act aggressively to try to stop it by hiking rates faster and more frequently than most investors believe.

Given the Fed’s success with deflating the last two bubbles (both instances lead to crises), what are the odds it is able to succeed this time without a crash?

Put another way… what are the odds this time it’s any different?

For those looking to prepare and profit from this mess, our Stock Market Crash Survival Guidecan show you how.

Within its 21 pages we outline which investments will perform best during a market meltdown as well as how to take out “Crash insurance” on your portfolio (these instruments returned TRIPLE digit gains during 2008).

To pick up your copy of this report, FREE, swing by:

https://phoenixcapitalmarketing.com/stockmarketcrash.html
Best Regards,

Posted by Phoenix Capital Research in stock collapse?

What Does the Market Look Like Without Fed Interventions?

By Graham Summers, MBA

The markets are about to lose their “training wheels.”

And by the look of things, it won’t be pretty.

On March 23, 2020, during the depths of the market crash triggered by the economic shutdowns, the Fed moved to backstop everything.

And I do mean EVERYTHING.

The Fed On Monday March 23nd, 2020, the Fed staged an Emergency Meeting during which it announced that it would be expanding its $700 billion QE program to “unlimited”… meaning it would print as much money as was needed.

It also announced that it would be using this unlimited QE to fund various credit facilities that would buy: 

·      Mortgage-Backed Securities (MBS)

·      U.S. Treasuries

·      Corporate debt or debt issued by corporations.

·      Corporate debt-related ETFs (stock funds linked to corporate debt).

·      Municipal debt (debt issued by states, counties, and cities).

·      Certificates of Deposit (CDs)

·      Student Loans

·      Auto Loans 

Since that time, stocks have ripped higher in a near straight line… 

Diagram

Description automatically generated with low confidence

The Fed, nearly two years later, finally decided to its time to end the interventions. Within eight weeks its current QE program will be over. And the Fed intends to start raising rates soon after.

So, what will the market look like once the Fed stops its nearly weekly interventions?

High yield credit is already offering a preview. The Fed stopped intervening in this market weeks ago.

Chart, line chart

Description automatically generated

The signs are clear… another bloodbath is just around the corner.

For those looking to prepare and profit from this mess, our Stock Market Crash Survival Guidecan show you how.

Within its 21 pages we outline which investments will perform best during a market meltdown as well as how to take out “Crash insurance” on your portfolio (these instruments returned TRIPLE digit gains during 2008).

To pick up your copy of this report, FREE, swing by:

https://phoenixcapitalmarketing.com/stockmarketcrash.html
Best Regards,

Posted by Phoenix Capital Research in stock collapse?

Three Charts That Warn Another Bloodbath is Just Around the Corner!

The technical damage of the last week has been severe.

The S&P 500 broke below critical support at 4,705 with heavy selling this week. That’s bad news.  Even worse, the market has failed to reclaim that level during yesterday’s bounce.

This means that what used to be support is now resistance. The fact the bulls couldn’t reclaim this level means we are going lower.

How much lower?

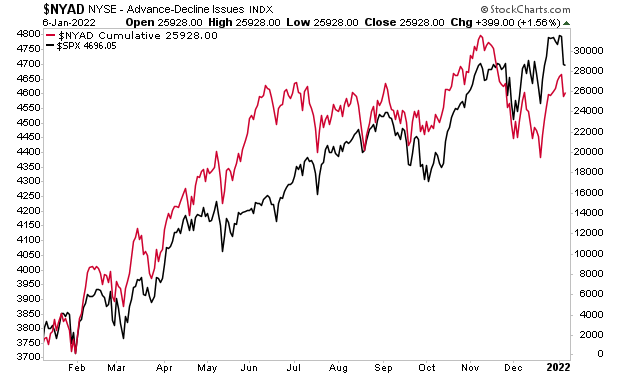
Breadth is telling us to expect 4,600.

Chart, line chart, histogram

Description automatically generated

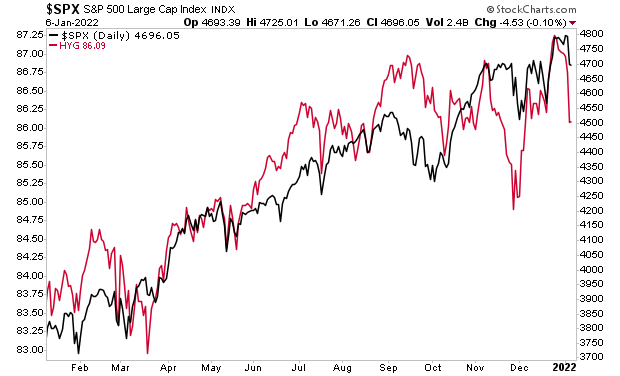
High yield credit says it will be even lower at 4,500.

Chart, line chart

Description automatically generated

The signs are clear… another bloodbath is just around the corner.

For those looking to prepare and profit from this mess, our Stock Market Crash Survival Guidecan show you how.

Within its 21 pages we outline which investments will perform best during a market meltdown as well as how to take out “Crash insurance” on your portfolio (these instruments returned TRIPLE digit gains during 2008).

To pick up your copy of this report, FREE, swing by:

https://phoenixcapitalmarketing.com/stockmarketcrash.html
Best Regards

Posted by Phoenix Capital Research in stock collapse?
What’s Coming Will Make 2008 Look Like a Picnic

What’s Coming Will Make 2008 Look Like a Picnic

By Graham Summers, MBA

Make no mistake, a crisis is coming.

It might not be tomorrow, next week or even next month, but it will be truly life changing for most investors.

How do we know this?

Because the current bubble is so insane, so out of control, that when it bursts it will make 2008 look like a picnic.

Consider that:

  1. Options trading volume (a sign of speculation) is exponentially higher than it was during the Tech Bubble.
  2. Crypto currencies that were invented as jokes trade at tens of billions of dollars.
  3. Tesla (TSLA) a $1 trillion company, trades like a penny stock rising or falling 10+% in a single day.
  4. People are selling Non-Fungible Tokes (NFTs) of farts, and other garbage… and making significant money.
  5. “Meme stocks” or stocks that are traded for ironic/ humorous purposes rise triple digits in a single day.
  6. Former President Trump’s Special Purpose Acquisition Company (SPAC) rose to a value of $5 billion despite having no business or operations.

And what is the Fed’s answer to all of this?

The Fed is going to keep rates at ZERO until at least the middle of 2022. And between now and then, it’s going to print another $90 billion in QE ($60 billion in QE in January, then another $30 billion in February and finally no QE in March).

Put another way the Fed believes that because it is printing less money, somehow this is going to make investors become rational/ deflate the bubble without inducing a crash. There was a time, before 2008, in which the Fed didn’t do ANY QE at all, but those days are long gone.

So where does this us?

Official inflation metrics show it clocking it at 6.8%, while REAL inflation is somewhere in the ballpark of 9%. The Fed has rates at zero and won’t raise them until the middle of 2022.

And this is happening: 

Again, a crisis is coming. And it’s going to make 2008 look like a picnic.

For those looking to prepare and profit from this mess, our Stock Market Crash Survival Guide can show you how.

Within its 21 pages we outline which investments will perform best during a market meltdown as well as how to take out “Crash insurance” on your portfolio (these instruments returned TRIPLE digit gains during 2008).

To pick up your copy of this report, FREE, swing by:

https://phoenixcapitalmarketing.com/stockmarketcrash.html
Best Regards

Posted by Phoenix Capital Research in stock collapse?