stock collapse?

This is How Professional Traders Are Playing the Next Round of the Covid-19 Crisis

It is impossible to understand what is happening in the U.S. today from a COVID-19 policy response.

One day Dr Fauci says there will NOT be lockdowns, and the very next President Biden suggests there will.

One day CDC Director Rochelle Walensky states that the Biden Administration will likely issue a national mandate for the COVID-19 vaccine… and the next day she walks that back stating that “an experimental vaccine cannot be mandated by anyone.”

One day we are told by Biden administration officials that Delta variants are the biggest concern in terms of spread… and the next day the White House Deputy Press Secretary admits that she doesn’t even know if there’s a test for it.

You can draw your own conclusions from this situation. Some people will say that COVID-19 is a complicated situation that changes on a weekly basis, hence the confusion. Others will say this whole mess is about politics and has nothing to do with science. Others will say it’s a mix of the two.

For investors, given the market impact of another round of shutdowns, the wisest move is to ignore all the news and focus on price levels.

Put another way, don’t try to be psychic… let the market show you what’s going on.

I’ve illustrated the major lines of support for the S&P 500 with green lines in the chart below. They are currently 4380 and 4265. We also have minor support at 4,370 (purple line).
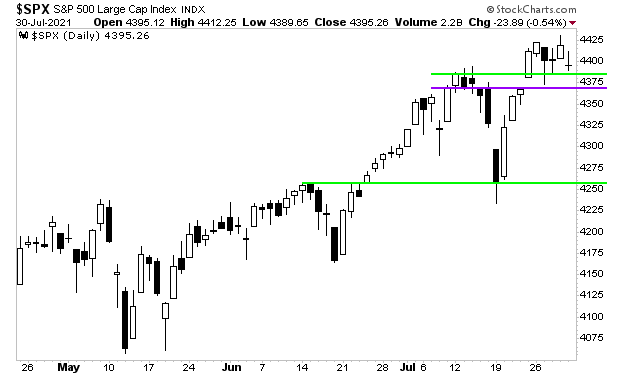
The key with bull markets is to let ride them for as long as possible. Put another way, until the market starts to “do something wrong,” by breaking down and taking out support lines you need to fight the urge to sell.

At some point the stock market will break down again as the Everything Bubble finally bursts and the financial system lurches into another crisis.

With that in mind, we’ve reopened our Stock Market Crash Survival Guide to the general public.

Within its 21 pages we outline which investments will perform best during a market meltdown as well as how to take out “Crash insurance” on your portfolio (these instruments returned TRIPLE digit gains during 2008).

We are making just 100 copies available to the general public.

To pick up your copy of this report, FREE, swing by:

http://phoenixcapitalmarketing.com/stockmarketcrash.html

Best Regards

Graham Summers

Chief Market Strategist

Posted by Phoenix Capital Research in stock collapse?

Ignore the Bounce, the Stock Market is in SERIOUS Trouble


Stocks are bouncing hard this morning because China stepped in to prop up its stock market.

That’s it. That’s the only reason.

Put another way, the stock market is in very serious trouble. 

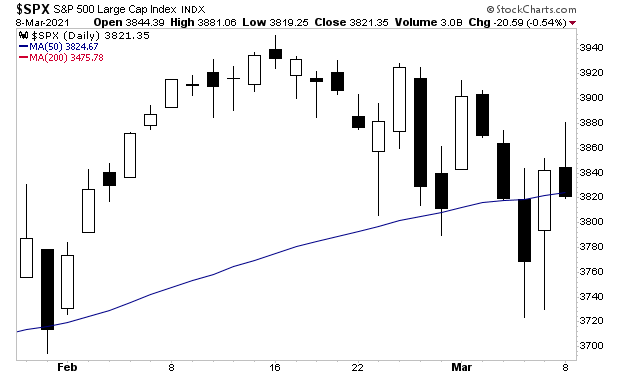
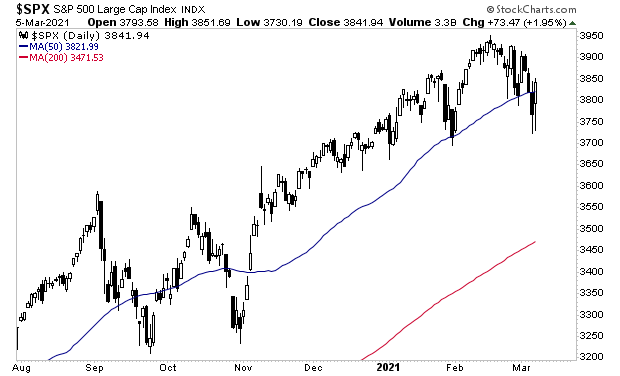
The bulls have made multiple attempts to keep the S&P 500 above its 50-day moving average (DMA). Despite all of their efforts, the S&P 500 still closed below the 50-DMA yesterday.

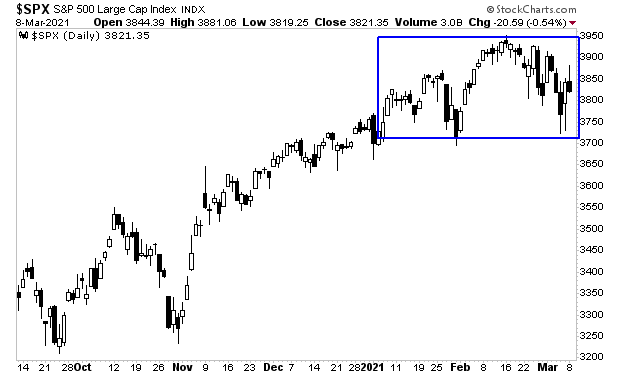
The longer-term picture isn’t much better. The S&P 500 has effectively traded sideways now for three months. Stocks have managed to move a lot without actually going anywhere!

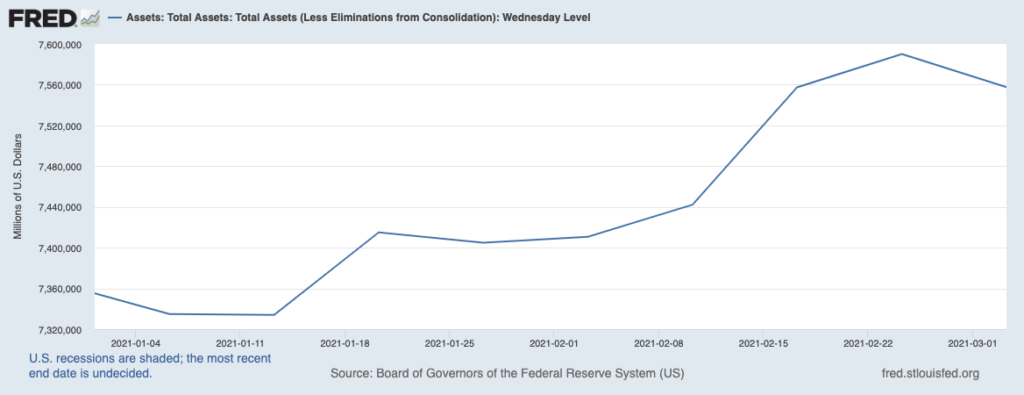
Mind you, this is happening at a time when the Fed is pushing some $120 BILLION into the financial system every month. So, the market has managed to go nowhere despite the Fed putting nearly a quarter of a trillion dollars into the financial system ($120 billion for January and February each).

Now you understand why I say the markets are in serious trouble. It stocks can’t catch a bid despite this much money printing, something is VERY wrong.

That something is inflation.

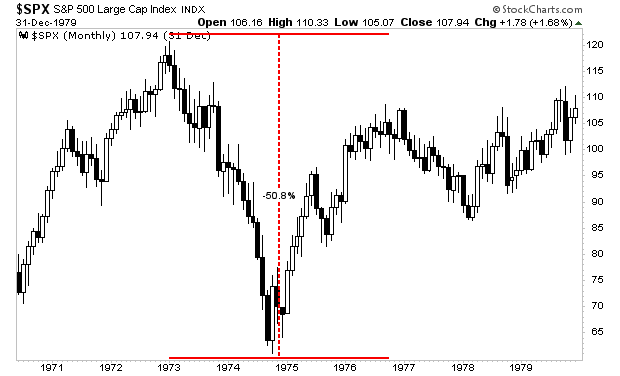
Stocks love inflation at first, but that love quickly turns to hate. During the last bout of hot inflation in the 1970s, stocks initially bubbled up before CRASHING nearly 50% in the span of two years, wiping out ALL of their initial gains and then some.

As I keep warning, inflation is going to ANNIHILATE investors’ portfolios.

Those who are properly prepared. however, will make literal fortunes.

On that note, if you’re worried about weathering a potential market crash, we’ve reopened our Stock Market Crash Survival Guide to the general public.

Within its 21 pages we outline which investments will perform best during a market meltdown as well as how to take out “Crash insurance” on your portfolio (these instruments returned TRIPLE digit gains during 2008).

We are making just 100 copies available to the public.

To pick up your copy of this report, FREE, swing by:

http://phoenixcapitalmarketing.com/stockmarketcrash.html

Best RegardsParagraph

Graham Summers

Chief Market Strategist

Phoenix Capital Research

Posted by Phoenix Capital Research in stock collapse?

These Are the Levels to Watch For Stocks

The bloodbath continues.

I warned for weeks that inflation was going to annihilate investors portfolios. And now it is.

The big question for most investors, is “when does it end?”

No one knows. But the market is offering us some clues.

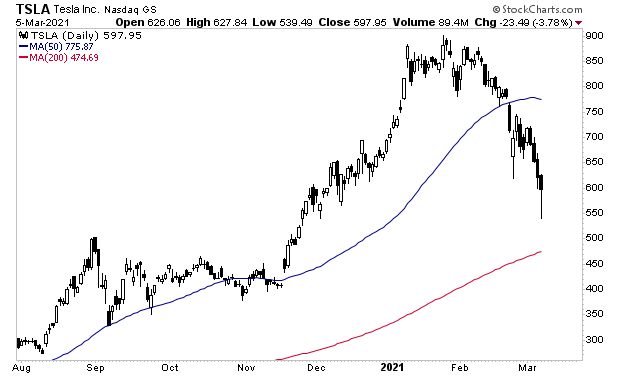
Tesla (TSLA) was one of the hottest momentum stocks on the market going into this meltdown. It has sliced right through its 50-DMA and is now approaching its 200-DMA. Realistically, the 200-DMA is the first place we could see an actual bottom formed.

If the overall market were to follow TSLA, this would mean the S&P 500 dropping to roughly 3,500.

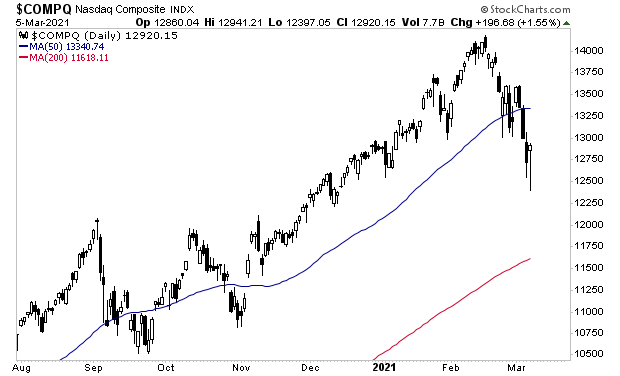
And the NASDAQ falling to 11,600 or so.

I know this is NOT what you wanted to hear. But the reality is that as awful as last week’s selling was, it didn’t induce any major flight to safety in bonds.

Historically, Treasuries are a safe haven, meaning that during times of trouble, capital runs to them for safety. However, last week this didn’t prove to be the case. The long-Treasury ETF (TLT) briefly spiked for a day or so, but then plunged back down to its lows.

Until you see TLT rallying hard, the odds of a market bottom remain extremely low. I wouldn’t get too excited about buying stocks until we see TLT trading near its 50-DMA at 148 or so.

Which means, buckle up, because the market is STILL in serious trouble.

Those who are properly prepared. however, will make literal fortunes.

On that note, if you’re worried about weathering a potential market crash, we’ve reopened our Stock Market Crash Survival Guide to the general public.

Within its 21 pages we outline which investments will perform best during a market meltdown as well as how to take out “Crash insurance” on your portfolio (these instruments returned TRIPLE digit gains during 2008).

We are making just 100 copies available to the public.

To pick up your copy of this report, FREE, swing by:

http://phoenixcapitalmarketing.com/stockmarketcrash.html

Best RegardsParagraph

Graham Summers

Chief Market Strategist

Phoenix Capital Research

Posted by Phoenix Capital Research in stock collapse?
Warning: the Bloodbath is Far From Over

Warning: the Bloodbath is Far From Over


The bloodbath continues.

I warned for weeks that inflation was going to annihilate investors portfolios. And now it is.

The big question for most investors, is “when does it end?”

No one knows. But the market is offering us some clues.

Tesla (TSLA) was one of the hottest momentum stocks on the market going into this meltdown. It has sliced right through its 50-DMA and is now approaching its 200-DMA. Realistically, the 200-DMA is the first place we could see an actual bottom formed.

If the overall market were to follow TSLA, this would mean the S&P 500 dropping to roughly 3,500.

And the NASDAQ falling to 11,600 or so.

I know this is NOT what you wanted to hear. But the reality is that as awful as last week’s selling was, it didn’t induce any major flight to safety in bonds.

Historically, Treasuries are a safe haven, meaning that during times of trouble, capital runs to them for safety. However, last week this didn’t prove to be the case. The long-Treasury ETF (TLT) briefly spiked for a day or so, but then plunged back down to its lows.

Until you see TLT rallying hard, the odds of a market bottom remain extremely low. I wouldn’t get too excited about buying stocks until we see TLT trading near its 50-DMA at 148 or so.

Which means, buckle up, because the market is STILL in serious trouble.

Those who are properly prepared. however, will make literal fortunes.

On that note, if you’re worried about weathering a potential market crash, we’ve reopened our Stock Market Crash Survival Guide to the general public.

Within its 21 pages we outline which investments will perform best during a market meltdown as well as how to take out “Crash insurance” on your portfolio (these instruments returned TRIPLE digit gains during 2008).

We are making just 100 copies available to the public.

To pick up your copy of this report, FREE, swing by:

http://phoenixcapitalmarketing.com/stockmarketcrash.html

Best RegardsParagraph

Graham Summers

Chief Market Strategist

Phoenix Capital Research


Posted by Phoenix Capital Research in stock collapse?
Jerome Powell is Lying and We Will All Pay For It

Jerome Powell is Lying and We Will All Pay For It

At this point in my career, few things surprise me.

I’ve seen the housing boom, the Great Financial Crisis, the E.U. debt crisis, bail-ins, bail-outs, Fed chairs lying to congress, BREXIT, and President Trump.

However, what Fed Chair Jerome Powell said this week made my jaw hit the floor.

In his testimony to Congress, Fed Chair Jerome Powell stated:

It may take three years for inflation to hit the Fed’s goal of 2%.

Three years, as in inflation won’t hit 2% until 2024.

Bear in mind, inflation, today, right now, is well over that. Bond yields which trade based on inflation have more than doubled since August.

Gasoline prices are up over 70% since November. Lumber prices are up 52% over the same time period. Copper is up 33%. Heck, the ENTIRE commodities complex as measured by the Commodity Research Bureau’s index is up 26%!

Chart, line chart, histogram

Description automatically generated

There is no sign of this stopping. Indeed, as Bill King notes, on the very day in which Fed Chair Powell was making these insane claims, gasoline surged 2%, oil surged 2.5%, copper rallied 3% and bonds collapsed.

This is akin got the financial system SCREAMING “INFLATION IS HERE!” in Powell’s ear. And he claims we won’t even hit inflation of 2% until 2024.

This is total insanity. And it is going to end horribly.

During the last bout of hot inflation in the 1970s, stocks initially bubbled up before CRASHING nearly 50% in the span of two years, wiping out ALL of their initial gains and then some.

Chart, bar chart, histogram

Description automatically generated

As I keep warning, inflation is going to ANNIHILATE investors’ portfolios.

On that note, if you’re worried about weathering a potential market crash, we’ve reopened our Stock Market Crash Survival Guide to the general public.

Within its 21 pages we outline which investments will perform best during a market meltdown as well as how to take out “Crash insurance” on your portfolio (these instruments returned TRIPLE digit gains during 2008).

We are making just 100 copies available to the public.

To pick up your copy of this report, FREE, swing by:

http://phoenixcapitalmarketing.com/stockmarketcrash.html

Best RegardsParagraph

Graham Summers

Chief Market Strategist

Phoenix Capital Research

Posted by Phoenix Capital Research in stock collapse?

Warning: A Bloodbath Could Be Just Around the Corner


The stock market is warning us that a real bloodbath could be around the corner.

Let’s take a look at some charts. 

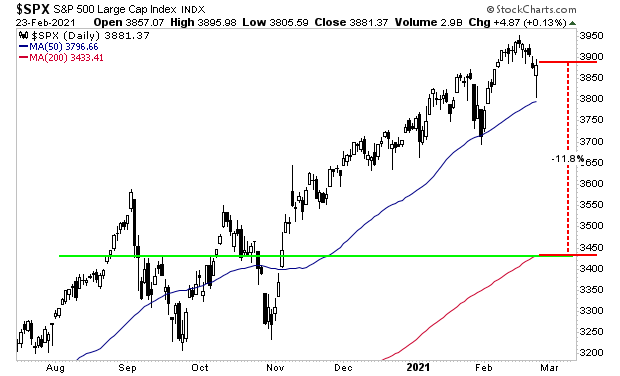
The market action of the last week has been extremely problematic. On the surface things look relatively benign. The S&P 500 fell to test support and its 50-day moving average (DMA) and bounced hard.

All of this is just fine and no cause for major concern. But again, this is problematic because “under the hood” things have gotten downright nasty.

Tesla (TSLA) has been one of the most important market leaders for stocks since the March lows. It sliced through its 50-DMA with little to no trouble. Support held, but this was a very negative development and opens the door to a test of the 200-DMA.

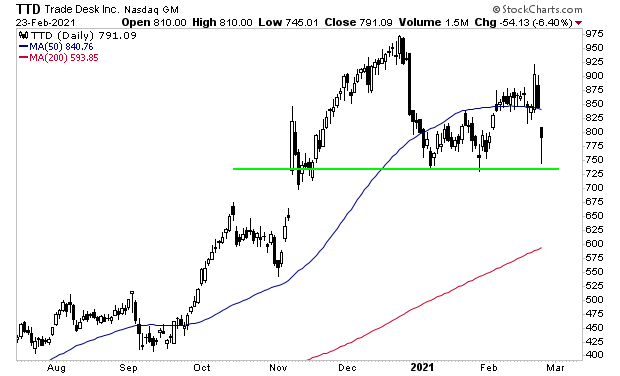
It’s a similar story for TradeDesk (TTD) another market leader: support held, but we sliced through the 50-DMA like a hot knife through butter. Again, the door is now open to the 200-DMA.

These are market leaders. If they go to their 200-DMAs, the broader market will likely end up doing the same.

That’s a pretty significant drop.

Again, the market action of the last week is quite problematic. While the S&P 500 looks contained, market leaders have seen tremendous damage to their charts. With this in mind, the potential for a nasty drop is higher than at any point in the last six months. 

This all ties back to what I’ve been arguing for weeks now: that the inflationary forces rippling through the financial system will eventually HURT rather than help stocks. 

The reason for this is that the ONLY thing that allows stocks to remain in a bull market is if the debt markets are calm and stable.

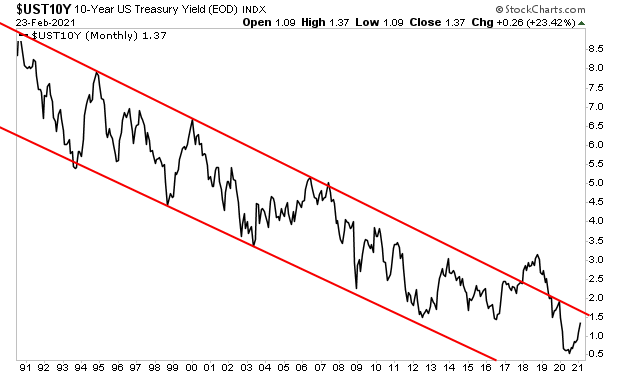
They are not. The yield on the all-important 10-Year Treasury yield has more than doubled since August and is now on the verge of breaking its 40+ year downtrend.

This is a HUGE deal. The last time that downtrend broke was in 2018 and it resulted in the stock market losing 20% in a matter of weeks.

As I kept warning for weeks, the coming inflation is going to ANNIHILATE most investors’ portfolios.

On that note, if you’re worried about weathering a potential market crash, we’ve reopened our Stock Market Crash Survival Guide to the general public.

Within its 21 pages we outline which investments will perform best during a market meltdown as well as how to take out “Crash insurance” on your portfolio (these instruments returned TRIPLE digit gains during 2008).

We are making just 100 copies available to the public.

To pick up your copy of this report, FREE, swing by:

http://phoenixcapitalmarketing.com/stockmarketcrash.html

Best RegardsParagraph

Graham Summers

Chief Market Strategist

Phoenix Capital Research

Posted by Phoenix Capital Research in stock collapse?

Are the Markets About to Crash? Let’s Find Out!

Stocks are a bloodbath this morning.

To be fair, the market was EXTREMELY overbought going into this correct. So, we are MORE than due for a drop.

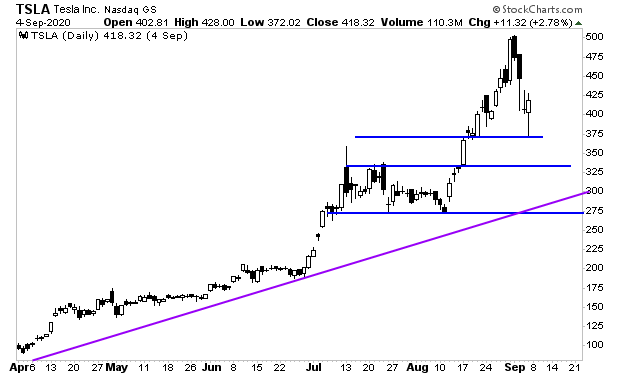
The most egregious stocks in terms of being overbought were Tech stocks. This is where we’ll see the most severe drops. We bounce off support on Friday, but it’s highly likely we’ll work our way down to the lower blue line in the coming days.

A screenshot of a social media post

Description automatically generated

Tesla (TSLA) is the ultimate example of just how ridiculous things had gotten. It could almost HALVE and still maintain its bull market trendline (purple line).

A close up of a map

Description automatically generated

Is this going to be a crash? For some parts of the market it will feel like it. For others, the selling will be less dramatic.

However, this DOES present us with the first REAL opportunity to profit from a collapse since the March lows.

In light of this, we’ve reopened our Stock Market Crash Survival Guide to the general public.

Within its 21 pages we outline which investments will perform best during a market meltdown as well as how to take out “Crash insurance” on your portfolio (these instruments returned TRIPLE digit gains during 2008).

We are making 100 copies available to the public.

To pick up your copy of this report, FREE, swing by:

http://phoenixcapitalmarketing.com/stockmarketcrash.html

Best Regards

Graham Summers

Chief Market Strategist

Phoenix Capital Research

Posted by Phoenix Capital Research in stock collapse?

Is This Just a Correction… or the Start of a Crash?

Stocks are a bloodbath this morning.

To be fair, the market was EXTREMELY overbought going into this correct. So, we are MORE than due for a drop.

The most egregious stocks in terms of being overbought were Tech stocks. This is where we’ll see the most severe drops. We bounce off support on Friday, but it’s highly likely we’ll work our way down to the lower blue line in the coming days.

A screenshot of a social media post

Description automatically generated

Tesla (TSLA) is the ultimate example of just how ridiculous things had gotten. It could almost HALVE and still maintain its bull market trendline (purple line).

A close up of a map

Description automatically generated

Is this going to be a crash? For some parts of the market it will feel like it. For others, the selling will be less dramatic.

However, this DOES present us with the first REAL opportunity to profit from a collapse since the March lows.

In light of this, we’ve reopened our Stock Market Crash Survival Guide to the general public.

Within its 21 pages we outline which investments will perform best during a market meltdown as well as how to take out “Crash insurance” on your portfolio (these instruments returned TRIPLE digit gains during 2008).

We are making 100 copies available to the public.

To pick up your copy of this report, FREE, swing by:

http://phoenixcapitalmarketing.com/stockmarketcrash.html

Best Regards

Graham Summers

Chief Market Strategist
Phoenix Capital Research

Posted by Phoenix Capital Research in stock collapse?

The Bears Fumbled Yesterday… Will They Recover or Is It New Highs?

Stocks dropped hard over the last 36 hours, but the buyers stepped in and aggressively bought the dip mid-session yesterday.

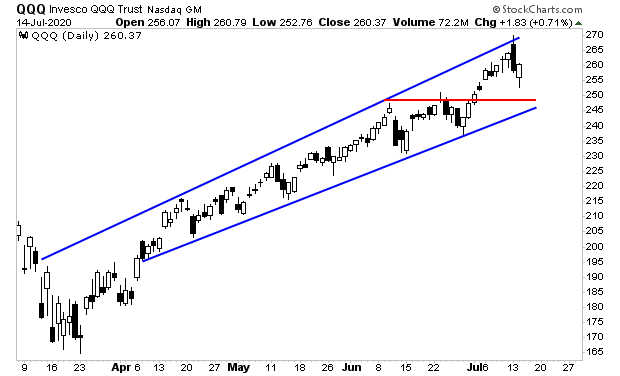
On the surface, the price action felt exciting. But the reality is that Tech Stocks had slammed into resistance at the top of the upwards channel they’ve been forming over the last four weeks (blue lines in the chart below). And try as they might, the bears failed to get the job done… price didn’t even drop to test major support (red line in the chart below).

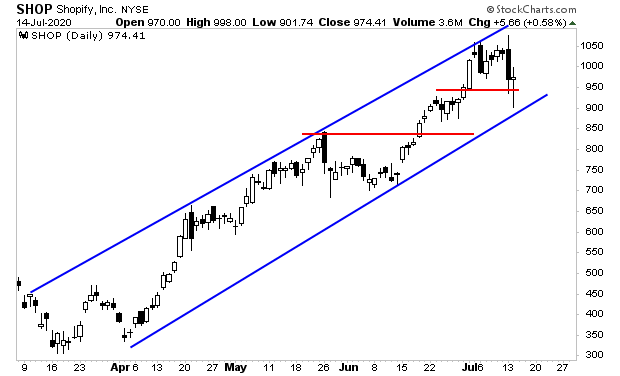
Even massively overvalued companies like Shopify (SHOP) didn’t break their first line of support (top red line in the chart below). The uptrend remains clear. And this is on a stock that is up over 300% from the lows!

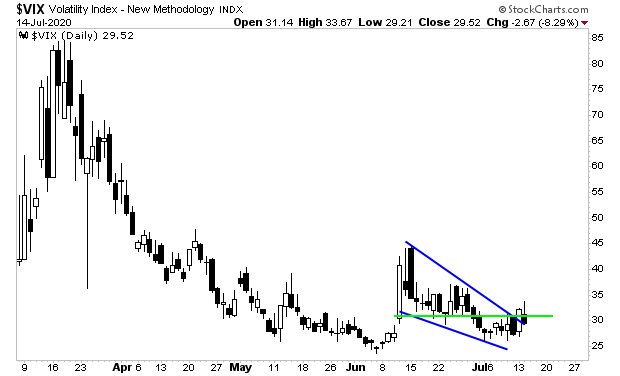
Moreover, the VIX failed to break out of its falling wedge formation (blue lines in the chart below) and fell back below resistance (green lines in the chart below).

If we are going to get a significant drop, bears need to step up today or tomorrow at the latest. Otherwise we’re going to new highs.

Today is the last day our Stock Market Crash Survival Guide will be available to the general public.

To pick up your copy of this report, FREE, swing by:

http://phoenixcapitalmarketing.com/stockmarketcrash.html

Best Regards

Graham Summers

Chief Market Strategist
Phoenix Capital Research

Posted by Phoenix Capital Research in stock collapse?

Three Charts I’m Watching For Signs of a Major Pullback


Stocks dropped hard over the last 36 hours, but the buyers stepped in and aggressively bought the dip mid-session yesterday.

On the surface, the price action felt exciting. But the reality is that Tech Stocks had slammed into resistance at the top of the upwards channel they’ve been forming over the last four weeks (blue lines in the chart below). And try as they might, the bears failed to get the job done… price didn’t even drop to test major support (red line in the chart below).

Even massively overvalued companies like Shopify (SHOP) didn’t break their first line of support (top red line in the chart below). The uptrend remains clear. And this is on a stock that is up over 300% from the lows!

Moreover, the VIX failed to break out of its falling wedge formation (blue lines in the chart below) and fell back below resistance (green lines in the chart below).

If we are going to get a significant drop, bears need to step up today or tomorrow at the latest. Otherwise we’re going to new highs.

Today is the last day our Stock Market Crash Survival Guide will be available to the general public.

To pick up your copy of this report, FREE, swing by:

http://phoenixcapitalmarketing.com/stockmarketcrash.html

Best Regards

Graham Summers

Chief Market Strategist
Phoenix Capital Research

Posted by Phoenix Capital Research in stock collapse?

Yes, the Market is in a Bubble. And It May Have Just Burst.


The stock market is in a bubble.

Actually, that statement is not 100% correct. SOME stocks are in a massive bubble. Other stocks are not even close.

The bubble we are facing today is in large tech stocks.

To prove this, I’m not going to get into the technology itself, nor am I going to try to get clever with discounted cash flows or some other analysis.

Instead I’m going to use the simplest method of analysis possible: mean reversion.

Why? Because price ALWAYS reverts to the mean.

It doesn’t matter how great management is, nor how fast sales are growing, at some point a stock’s price will revert back to its mean.

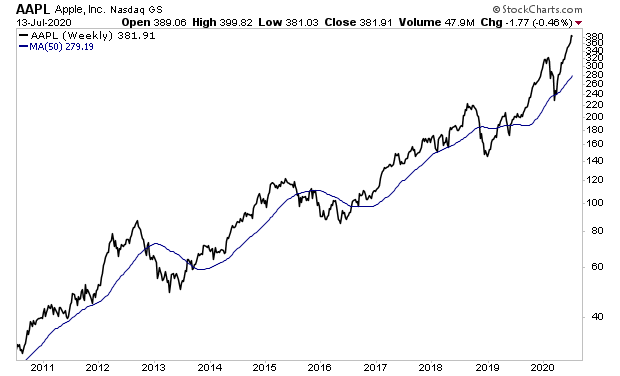
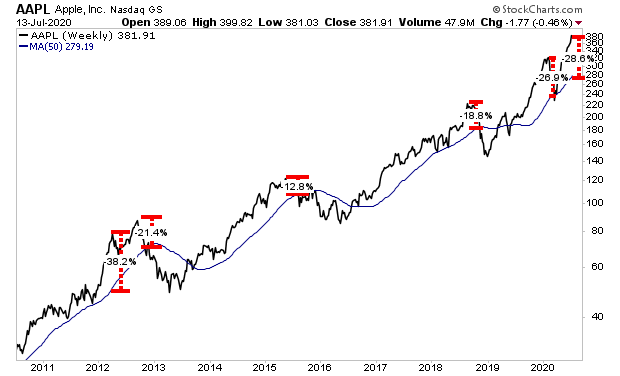
For the sake of today’s argument I am using the 50-week moving average (WMA) as the “mean.” If you’re unfamiliar with this concept, the 50-week moving average comes from adding up the closing prices of the last 50 weeks and then dividing that number by 50.

Historically, this line has acted as a magnet for stock prices. In the case of large tech companies today, let’s take a look at Apple (AAPL).

As you can see in the below chart, the 50-week moving average has served as an anchor for AAPL’s stock over the last 10 years. Anytime AAPL has become too “stretched” above or below this line, it has reverted back to it… usually quite quickly.

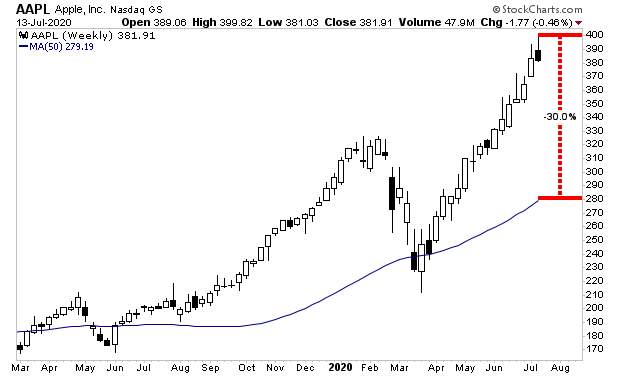
Now, take a look at how far AAPL’s stock is stretched above the line today compared to other peaks. I’ve actually looked deeper here and AAPL is MORE stretched above its 50-WMA today than at any point in the last 10 years with only one exception.

In 2012, AAPL’s stock was 38% above its 50-WMA. That was a peak.

Later in 2012, AAPL’s stock was 21% above its 50-WMA. That was a peak.

In 2015, AAPL’s stock was 12% above its 50-WMA. That was a peak.

In 2018, AAPL’s stock was 18% above its 50-WMA. That was a peak.

In 2019, AAPL’s stock was 26% above its 50-WMA. That was a peak.

Today, AAPL’s stock is 28% above its 50-WMA.

This is a bubble, plain and simple.

Of course, AAPL stock can continue higher, becoming even more stretched above its 50-WMA but that mean reversion move is coming eventually.

Put simply, the risk to reward for large Tech Stocks is extremely high right now. Yes, you could possibly make money buying AAPL’s stock but the idea you’ll make a lot is minimal.

And at some point, this bubble will burst  as all bubbles do and we will get that mean reversion move.

I believe this move may have started yesterday.

Smart investors are already taking steps to profit from the next major downturn in the markets.

In light of this, we’ve reopened our Stock Market Crash Survival Guide to the general public.

Within its 21 pages we outline which investments will perform best during a market meltdown as well as how to take out “Crash insurance” on your portfolio (these instruments returned TRIPLE digit gains during 2008).

We made 100 copies available to the public.

As I write this, there are just 9 left.

To pick up your copy of this report, FREE, swing by:

http://phoenixcapitalmarketing.com/stockmarketcrash.html

Best Regards

Graham Summers

Chief Market Strategist
Phoenix Capital Research

Posted by Phoenix Capital Research in Central Bank Insanity, Debt Bomb, stock collapse?
If Stocks Don’t Hold Here We Could See Another Crash of Sorts

If Stocks Don’t Hold Here We Could See Another Crash of Sorts


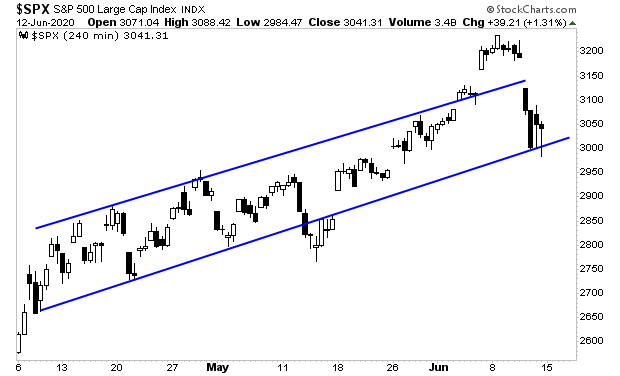
Stocks have fallen hard over the weekend again. The media is pinning this drop on the potential for another COVID-19 pandemic, but the facts don’t support that theory.

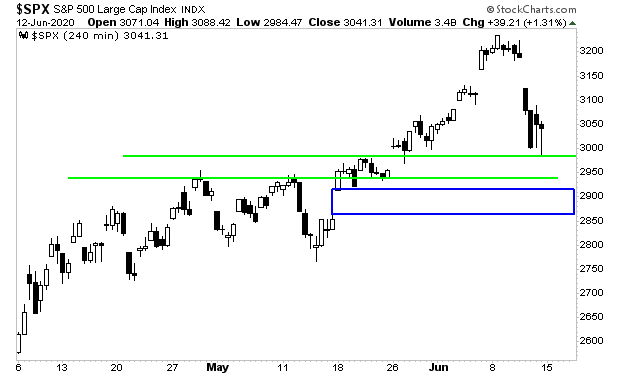
At times like these, it’s essential to ignore narratives, and focus on price. With that in mind, the S&P 500 remains in an uptrend, barely (blue lines in the chart below). Stocks need to hold here for the bull market case to remain intact. 

If stocks break down from here, there are two items in play. One is support at 2,940 (lower green line in the chart below). The other is the gap established by the open on May 18th (blue rectangle in the chart below).

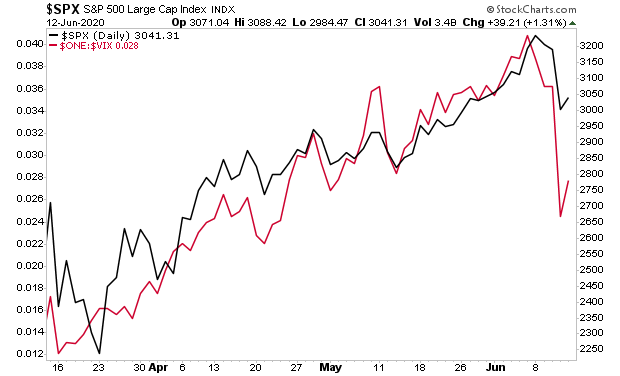
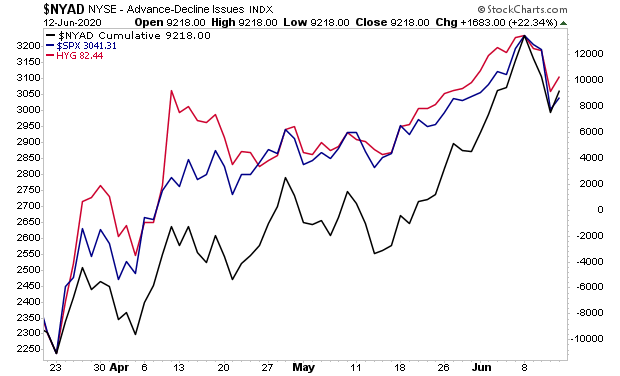
When we plot the S&P 500 against the VIX (inverted), it looks like there’s more downside to go here.

However, both breadth and credit suggest the downside is limited here.

My point with all of this is that today the market is literally a crap shoot. The easy money from the rally has been made, and the next trend is not clear yet. So now is NOT the time to be putting a load of capital to work.

However, if stocks don’t hold here, we could potentially see a crash down to 2,700.

That is a high reward type move. And one we need to consider.

In light of this, we’ve reopened our Stock Market Crash Survival Guide to the general public.

Within its 21 pages we outline which investments will perform best during a market meltdown as well as how to take out “Crash insurance” on your portfolio (these instruments returned TRIPLE digit gains during 2008).

There are only 33 copies available to the public.

To pick up your copy of this report, FREE, swing by:

http://phoenixcapitalmarketing.com/stockmarketcrash.html

Best Regards

Graham Summers

Chief Market Strategist
Phoenix Capital Research

Posted by Phoenix Capital Research in stock collapse?

Here Are the Key Lines For Stocks During This Correction

The markets are down hard this morning.

There are a myriad of reasons. The most important one concerns price: stocks were extremely overbought and overextended. It was time for a correction.

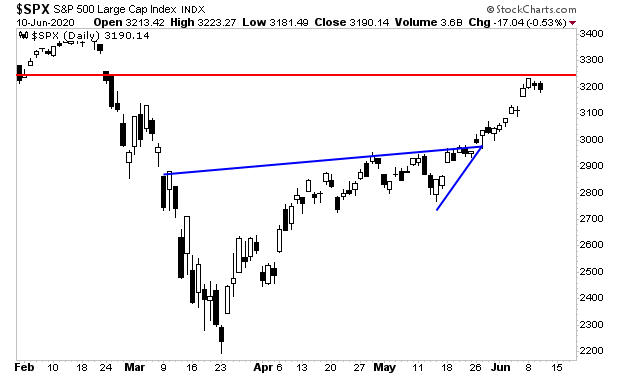
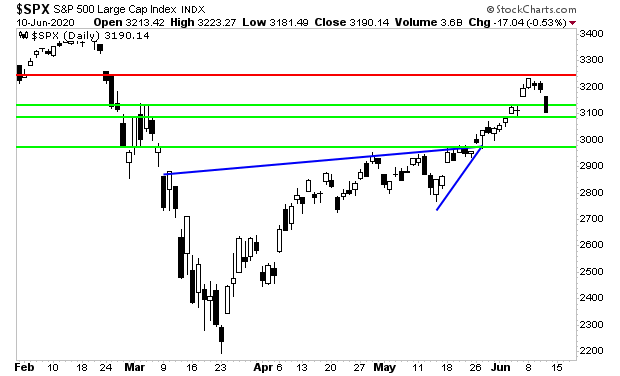
The S&P 500 had just made an explosive move higher out of a rising wedge formation (blue lines in the chart below). This move had brought stocks to a line of major overhead resistance (red line in the chart below).

As I wrote earlier this week, it is highly unlikely stocks would break that red line on the first try. So, a correction is expected here. The question is where it stops.

I’ve drawn the support lines to watch (green lines in the chart below). As I write this, stocks have already sliced through the first and are testing the second.

In the big picture, the fact is that the economic shutdown triggered by the COVID-19 panic has done PROFOUND structural damage to the US economy.

Stocks have largely ignored this, experiencing a kind of “sugar high” by focusing on the record amounts of liquidity the Fed is providing.

However, stocks now appear to be waking up to the damage. We are entering a “risk off” mode in the markets.

In light of this, we’ve reopened our Stock Market Crash Survival Guide to the general public.

Within its 21 pages we outline which investments will perform best during a market meltdown as well as how to take out “Crash insurance” on your portfolio (these instruments returned TRIPLE digit gains during 2008).

There are only 33 copies available to the public.

To pick up your copy of this report, FREE, swing by:

http://phoenixcapitalmarketing.com/stockmarketcrash.html

Best Regards

Graham Summers

Chief Market Strategist
Phoenix Capital Research

Posted by Phoenix Capital Research in stock collapse?

The Next Leg Down is Here. Are You Ready?


The markets are down hard this morning.

There are a myriad of reasons. The most important one concerns price: stocks were extremely overbought and overextended. It was time for a correction.

The S&P 500 had just made an explosive move higher out of a rising wedge formation (blue lines in the chart below). This move had brought stocks to a line of major overhead resistance (red line in the chart below).

As I wrote earlier this week, it is highly unlikely stocks would break that red line on the first try. So, a correction is expected here. The question is where it stops.

I’ve drawn the support lines to watch (green lines in the chart below). As I write this, stocks have already sliced through the first and are testing the second.

In the big picture, the fact is that the economic shutdown triggered by the COVID-19 panic has done PROFOUND structural damage to the US economy.

Stocks have largely ignored this, experiencing a kind of “sugar high” by focusing on the record amounts of liquidity the Fed is providing.

However, stocks now appear to be waking up to the damage. We are entering a “risk off” mode in the markets.

In light of this, we’ve reopened our Stock Market Crash Survival Guide to the general public.

Within its 21 pages we outline which investments will perform best during a market meltdown as well as how to take out “Crash insurance” on your portfolio (these instruments returned TRIPLE digit gains during 2008).

There are only 33 copies available to the public.

To pick up your copy of this report, FREE, swing by:

http://phoenixcapitalmarketing.com/stockmarketcrash.html

Best Regards

Graham Summers

Chief Market Strategist
Phoenix Capital Research

Posted by Phoenix Capital Research in stock collapse?

Remember, the Markets Rallied Right Before the March Meltdown As Well

Now is the time to be extra careful.

The US has erupted in riots/ civil unrest. The economic and cultural impacts of these events will be extreme. History has shown us that riots can have long-lasting, highly negative effects on local economies for years after the riots have ended.

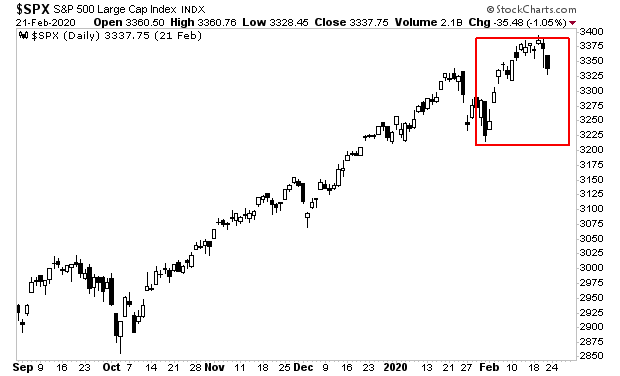
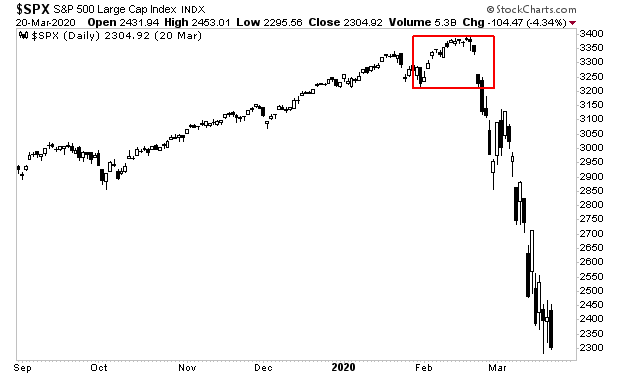
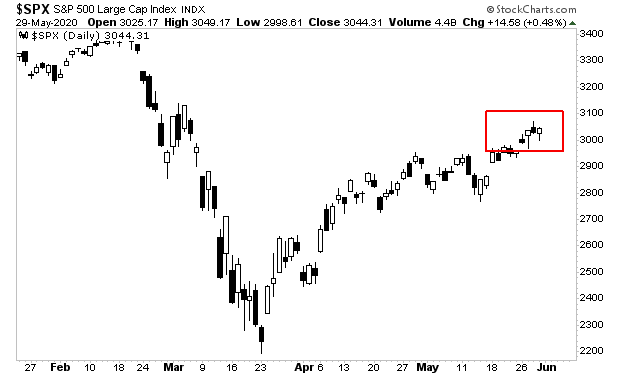
Despite all of this horrific news, the markets are up somewhat this morning. And that is a bad sign. It reminds me of what the markets were doing in late February: while the COVID-19 pandemic/ economic shut down was just around the corner, the markets were actually rallying (red square in the chart below).

Then this happened.

Fast forward to today, and the week before a large portion of the economy literally went up in flames, the markets are rallying once again.

A close up of a logo

Description automatically generated

Let’s be clear… the US economy was already in a depression before the riots started. The riots have made things exponentially worse. The potential fallout from this is tremendous. And we could indeed see another crash hit.

Again, now is the time to be careful, with yourself, your loved ones and your investments.

In light of this, we’ve reopened our Stock Market Crash Survival Guide to the general public.

Within its 21 pages we outline which investments will perform best during a market meltdown as well as how to take out “Crash insurance” on your portfolio (these instruments returned TRIPLE digit gains during 2008).

To pick up your copy of this report, FREE, swing by:

http://phoenixcapitalmarketing.com/stockmarketcrash.html

Best Regards

Graham Summers

Chief Market Strategist
Phoenix Capital Research

Posted by Phoenix Capital Research in stock collapse?
Just What Is Warren Buffet and the Fed Seeing To Make Them Do This?

Just What Is Warren Buffet and the Fed Seeing To Make Them Do This?

The US is lurching towards an economic catastrophe.

If you’ve been paying attention, over the last few weeks there have been several LARGE “tells.” Those tells were two of the BIGGEST cheerleaders for stocks in history, Warren Buffett and the Fed, getting EXTREMELY bearish.

First and foremost, Warren Buffett, the man who famously stated that he likes to own companies for a long-time, ideally “forever,” has begun dumping huge quantities of stocks.

All told, Buffett sold 21 stocks worth over the last four months. He’s unloaded large portions of his holdings in Goldman Sachs, JP Morgan, and other large banks, as well as multiple airline stocks, pharmaceuticals, and energy stocks.

The media claims Buffett is doing this because he wants to make sure he owns less than 10% of these companies, but when do you remember Buffett ever unloading so many stocks worth billions of dollars in such a short period?

On top of this Buffett didn’t use the March meltdown to load up on investments.

Put another way, during the largest market collapse in years, at a time when many businesses were on sale, Buffett didn’t buy anything (he sold the airlines stocks he tried to buy) but rather chose to start unloading several of his largest positions?

Whatever Buffett is seeing in the economy that is making him do this… it’s NOT good.

Then there’s the Fed.

 ———————————————————-  

Get a LIFETIME Subscription to All Of Our Products For Just $2,500 

An annual subscription to all of our current newsletters costs $1,500.

But today, you can get a LIFETIME subscription to ALL of them, along with every new product we ever launch, for just $2,500.

Today is the last day this offer is available.

To lock in one of the remaining slots…

CLICK HERE NOW!!! 

———————————————————–

For decades now, the Fed has been a cheerleader for the economy and stocks.

Indeed, it is extremely rare to find the Fed ever issue a gloomy view of the economy or markets. Which is why it’s astonishing to see the Fed making statements that you would expect from a raging bear.

During the last week, Fed Chair Jerome Powell has publicly stated:

1)    The US is facing its biggest economic shock in living memory (this would include the Great Financial Crisis), an economic downturn which Powell says is “without precedent.”

2)    The depression/recession in the US could stretch through the end of NEXT year (2021).

3)    Asset prices (stocks) remain vulnerable o significant price declines (crashes).

When do you ever remember hearing a Fed chair say anything like this? Typically, the head of the Fed issues statements that understate the severity of a risk (remember Bernanke saying the subprime crisis was “contained”?).

And yet, here is Jerome Powell saying that the US economy is in its WORST collapse ever, that it could last through the end of 2021, and that the stock market could crash.

And this is AFTER the Fed has spent over $2.7 TRILLION propping up the markets in the last two months. Just how horrific is the economy that Powell is saying this stuff after the Fed began buying assets in:

1)    The Treasury markets (U.S. sovereign debt).

2)    The municipal bond markets (debt issued by states and cities).

3)    The corporate bond markets (debt issued by corporations).

4)    The commercial paper markets (short-term corporate debt market).

5)    The asset-backed security markets (everything from student loans to certificates of deposit and more).

Between Warren Buffett and Fed Chair Powell, we’ve got two of the biggest stock cheerleaders in history, issuing some truly horrific stuff.

Again… just how bad are things that these two individuals are acting this way?

Think BAD, as in worse than 2008.

On that note, if you’re worried about weathering a potential market crash, we’ve reopened our Stock Market Crash Survival Guide to the general public.

Within its 21 pages we outline which investments will perform best during a market meltdown as well as how to take out “Crash insurance” on your portfolio (these instruments returned TRIPLE digit gains during 2008).

Today is the last day this report will be available to the public.

To pick up your copy of this report, FREE, swing by:

http://phoenixcapitalmarketing.com/stockmarketcrash.html

Best RegardsParagraph

Graham Summers

Chief Market Strategist

Phoenix Capital Research

Posted by Phoenix Capital Research in stock collapse?
Just What Is Warren Buffet and the Fed Seeing To Make Them Do This?

Just What Is Warren Buffet and the Fed Seeing To Make Them Do This?

The US is lurching towards an economic catastrophe.

If you’ve been paying attention, over the last few weeks there have been several LARGE “tells.” Those tells were two of the BIGGEST cheerleaders for stocks in history, Warren Buffett and the Fed, getting EXTREMELY bearish.

First and foremost, Warren Buffett, the man who famously stated that he likes to own companies for a long-time, ideally “forever,” has begun dumping huge quantities of stocks.

All told, Buffett sold 21 stocks worth over the last four months. He’s unloaded large portions of his holdings in Goldman Sachs, JP Morgan, and other large banks, as well as multiple airline stocks, pharmaceuticals, and energy stocks.

The media claims Buffett is doing this because he wants to make sure he owns less than 10% of these companies, but when do you remember Buffett ever unloading so many stocks worth billions of dollars in such a short period?

On top of this Buffett didn’t use the March meltdown to load up on investments.

Put another way, during the largest market collapse in years, at a time when many businesses were on sale, Buffett didn’t buy anything (he sold the airlines stocks he tried to buy) but rather chose to start unloading several of his largest positions?

Whatever Buffett is seeing in the economy that is making him do this… it’s NOT good.

Then there’s the Fed.

 ———————————————————-  

Get a LIFETIME Subscription to All Of Our Products For Just $2,500 

An annual subscription to all of our current newsletters costs $1,500.

But today, you can get a LIFETIME subscription to ALL of them, along with every new product we ever launch, for just $2,500.

Today is the last day this offer is available.

To lock in one of the remaining slots…

CLICK HERE NOW!!! 

———————————————————–

For decades now, the Fed has been a cheerleader for the economy and stocks.

Indeed, it is extremely rare to find the Fed ever issue a gloomy view of the economy or markets. Which is why it’s astonishing to see the Fed making statements that you would expect from a raging bear.

During the last week, Fed Chair Jerome Powell has publicly stated:

1)    The US is facing its biggest economic shock in living memory (this would include the Great Financial Crisis), an economic downturn which Powell says is “without precedent.”

2)    The depression/recession in the US could stretch through the end of NEXT year (2021).

3)    Asset prices (stocks) remain vulnerable o significant price declines (crashes).

When do you ever remember hearing a Fed chair say anything like this? Typically, the head of the Fed issues statements that understate the severity of a risk (remember Bernanke saying the subprime crisis was “contained”?).

And yet, here is Jerome Powell saying that the US economy is in its WORST collapse ever, that it could last through the end of 2021, and that the stock market could crash.

And this is AFTER the Fed has spent over $2.7 TRILLION propping up the markets in the last two months. Just how horrific is the economy that Powell is saying this stuff after the Fed began buying assets in:

1)    The Treasury markets (U.S. sovereign debt).

2)    The municipal bond markets (debt issued by states and cities).

3)    The corporate bond markets (debt issued by corporations).

4)    The commercial paper markets (short-term corporate debt market).

5)    The asset-backed security markets (everything from student loans to certificates of deposit and more).

Between Warren Buffett and Fed Chair Powell, we’ve got two of the biggest stock cheerleaders in history, issuing some truly horrific stuff.

Again… just how bad are things that these two individuals are acting this way?

Think BAD, as in worse than 2008.

On that note, if you’re worried about weathering a potential market crash, we’ve reopened our Stock Market Crash Survival Guide to the general public.

Within its 21 pages we outline which investments will perform best during a market meltdown as well as how to take out “Crash insurance” on your portfolio (these instruments returned TRIPLE digit gains during 2008).

Today is the last day this report will be available to the public.

To pick up your copy of this report, FREE, swing by:

http://phoenixcapitalmarketing.com/stockmarketcrash.html

Best RegardsParagraph

Graham Summers

Chief Market Strategist

Phoenix Capital Research

Posted by Phoenix Capital Research in stock collapse?

Once Again, Credit is Leading Stocks Lower

Ever since stocks bottomed on March 23rd, the big question has been: 

Can the Fed negate the economic damage caused by the shutdown by throwing trillions of dollars at the financial system?

The market is beginning to show us.

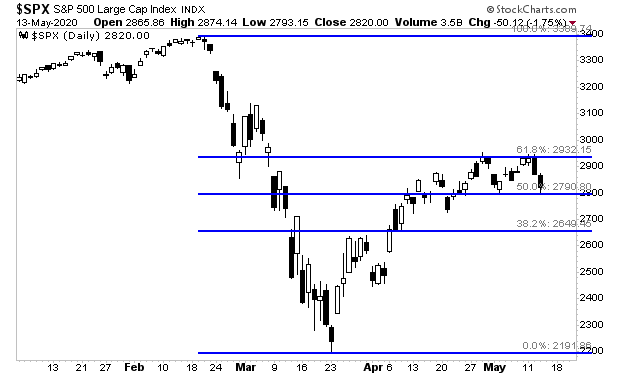
I’ve mentioned time and again that the 61.8% retracement of the March meltdown is key to the market entering a new bull market. If it can break above this line, we’re in a new bull market. If it can’t then the entire rally was just a bear market bounce.

With that in mind, note that stocks have failed to break above this level twice now. Each time it has failed we’ve had a ~5% correction.

Does this mean the top is in? Why bother trying to predict that? Let’s focus on the what the markets are actually telling us instead of trying to be psychic!

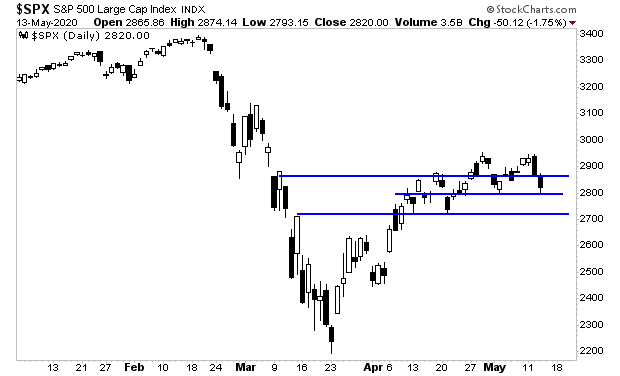
The key lines of support for the S&P 500 are draw on the chart below.

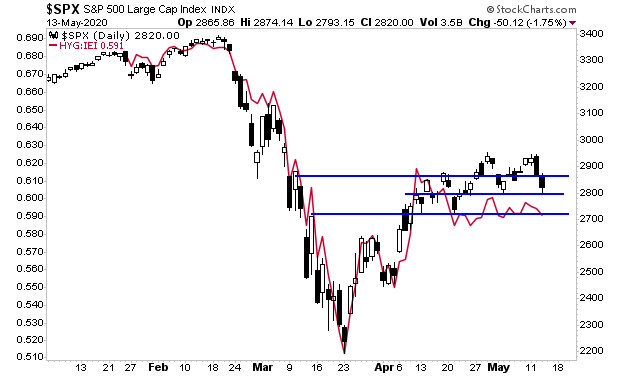
As I write this Thursday morning, stocks are attempting to hold 2,800. If that line goes, the next real support level is 2,730.

This is also where high yield credit suggests stocks are heading.

Again, remember your levels, and ignore the financial media. They operate based on emotions and will lose you money. 

If you’re sick of narratives and want to focus on how to actually make money from the markets, join our FREE e-letter Gains Pains & Capital.

https://gainspainscapital.com/

Graham Summers

Chief Market Strategist
Phoenix Capital Research

Posted by Phoenix Capital Research in stock collapse?

The Three Charts Traders Are Watching Today

Ever since stocks bottomed on March 23rd, the big question has been: 

Can the Fed negate the economic damage caused by the shutdown by throwing trillions of dollars at the financial system?

The market is beginning to show us.

I’ve mentioned time and again that the 61.8% retracement of the March meltdown is key to the market entering a new bull market. If it can break above this line, we’re in a new bull market. If it can’t then the entire rally was just a bear market bounce.

With that in mind, note that stocks have failed to break above this level twice now. Each time it has failed we’ve had a ~5% correction.

Does this mean the top is in? Why bother trying to predict that? Let’s focus on the what the markets are actually telling us instead of trying to be psychic!

The key lines of support for the S&P 500 are draw on the chart below.

As I write this Thursday morning, stocks are attempting to hold 2,800. If that line goes, the next real support level is 2,730.

This is also where high yield credit suggests stocks are heading.

Again, remember your levels, and ignore the financial media. They operate based on emotions and will lose you money. 

If you’re sick of narratives and want to focus on how to actually make money from the markets, join our FREE e-letter Gains Pains & Capital.

https://gainspainscapital.com/

Graham Summers

Chief Market Strategist
Phoenix Capital Research

Posted by Phoenix Capital Research in stock collapse?

Stocks Drop Hard, These Are the Levels to Watch Today


Ever since stocks bottomed on March 23rd, the big question has been: 

Can the Fed negate the economic damage caused by the shutdown by throwing trillions of dollars at the financial system?

The market is beginning to show us.

I’ve mentioned time and again that the 61.8% retracement of the March meltdown is key to the market entering a new bull market. If it can break above this line, we’re in a new bull market. If it can’t then the entire rally was just a bear market bounce.

With that in mind, note that stocks have failed to break above this level twice now. Each time it has failed we’ve had a ~5% correction.

Does this mean the top is in? Why bother trying to predict that? Let’s focus on the what the markets are actually telling us instead of trying to be psychic!

The key lines of support for the S&P 500 are draw on the chart below.

As I write this Thursday morning, stocks are attempting to hold 2,800. If that line goes, the next real support level is 2,730.

This is also where high yield credit suggests stocks are heading.

Again, remember your levels, and ignore the financial media. They operate based on emotions and will lose you money. 

If you’re sick of narratives and want to focus on how to actually make money from the markets, join our FREE e-letter Gains Pains & Capital.

https://gainspainscapital.com/

Graham Summers

Chief Market Strategist
Phoenix Capital Research

Posted by Phoenix Capital Research in stock collapse?