stock collapse?

The Fed Is About to Start Playing with Matches Next to a $30 TRILLION Debt Bomb

The Fed Is About to Start Playing with Matches Next to a $30 TRILLION Debt Bomb

By Graham Summers, MBA

Let’s cut through the narratives and media “BS.”

The Fed is trapped.

Inflation is soaring. And the Fed has signaled that it is shifting its focus from growth (employment) to inflation. Specifically, after 20 months of claiming inflation is “transitory” and not a problem, Fed Chair Jerome Powell has publicly stated that he no longer believes inflation is “transitory” and that the Fed can consider wrapping up its taper “a few months sooner.”

This means the Fed will be tapering QE and hiking interest rates sooner than expected.

There’s just one small problem.

As Lawrence McDonald recently noted, there is over $30 TRILLION more in debt trading at yields lower than 2% than there was the last time the Fed attempted to raise rates.

For bonds with yields this low, every time the Fed raises rates, there is a dramatic impact. Remember, the yield on U.S. Treasuries are the “risk free” rate of return against which the entire financial system is valued.

So, when the Fed raises rates, all debt, including that $30+ trillion must adjust accordingly. This means those bond prices FALL and their yields RISE. And if they rise enough, the investors begin to default.

Put another way, this time around, there is a $30 TRILLION+ ticking bomb sitting there. And the Fed is going to start playing with matches right next to it… hoping the fuse doesn’t light by mistake.

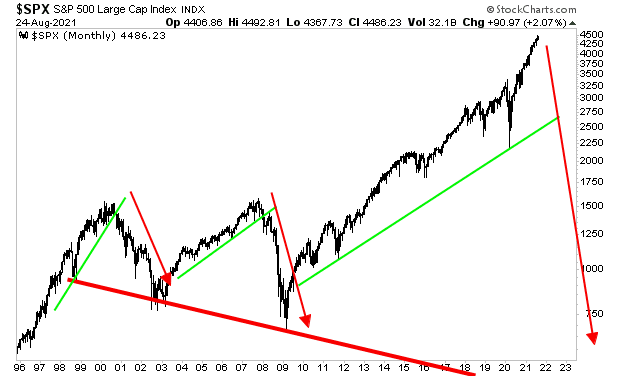
Given that Fed’s attempt in dealing with the Tech Bubble and the Housing Bubble resulted in full-scale crises…what are the odds the Fed can successfully deflate this current Everything Bubble… which is exponentially larger than the first two?

Look at the below chart and you tell me.
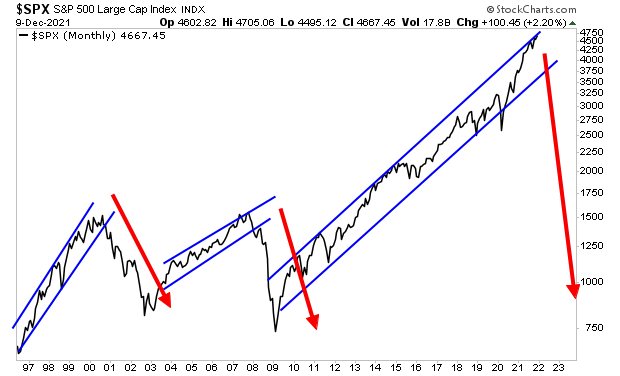
It is HIGHLY likely another bloodbath is coming to the markets.

It’s quite possible the markets will be entering a prolonged BEAR MARKET… a time in which stocks lose 50% or more over the course of months.

The coming bust is going to be life-changing for many people. Most will lose much if not everything. But a small number of investors will generate LITERAL FORTUNES.

Let me be blunt here, if you’re not taking steps to prepare for what’s coming, NOW is the time to do so.

For those looking to prepare and profit from this mess, our Stock Market Crash Survival Guidecan show you how.

Within its 21 pages we outline which investments will perform best during a market meltdown as well as how to take out “Crash insurance” on your portfolio (these instruments returned TRIPLE digit gains during 2008).

To pick up your copy of this report, FREE, swing by:

https://phoenixcapitalmarketing.com/stockmarketcrash.html

Best Regards,

Posted by Phoenix Capital Research in stock collapse?
Why Are the Manipulators So Desperate? These Charts Tell Us!

Why Are the Manipulators So Desperate? These Charts Tell Us!

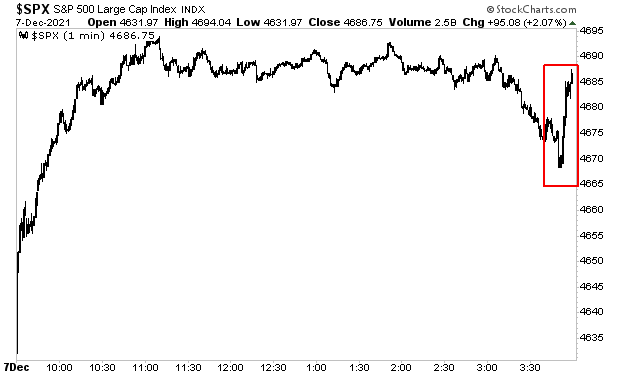
As I’ve been outlining over the last few days, “someone” is aggressively manipulating stocks higher.

Large financial institutions do NOT attempt to move markets. In fact, the traders charged with executing these institutions’ trades are graded based on their ability to buy and sell large chunks of stocks without moving the tape.

So, we can be certain that the “investor” who is doing this…

…isn’t a large financial institution looking to open a legitimate position. No, the kind of ramp in a matter of minutes on no news is the work of “someone” looking to manipulate the markets higher. 

Why are they doing this?

Because the market is forward-looking… and next year, the Fed will be ending its $120 billion QE program, and the U.S. government will be ending its stimulus programs.

This means a total of $4-$5 TRILLION in free money/ liquidity will no longer be funneled into the financial system.

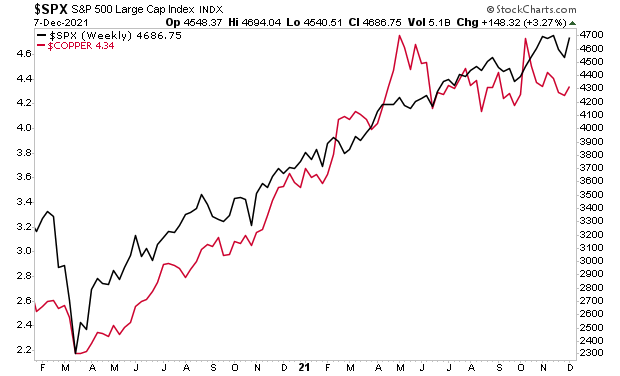
Why do you think copper, the commodity with so many industrial uses, it’s called “Dr. Copper, the commodity with a PhD in economics,” has broken down?

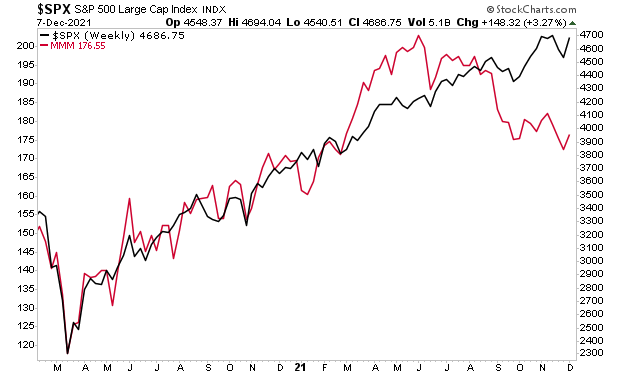
Or how about stocks that are closely tied to the REAL ECONOMY like 3M?

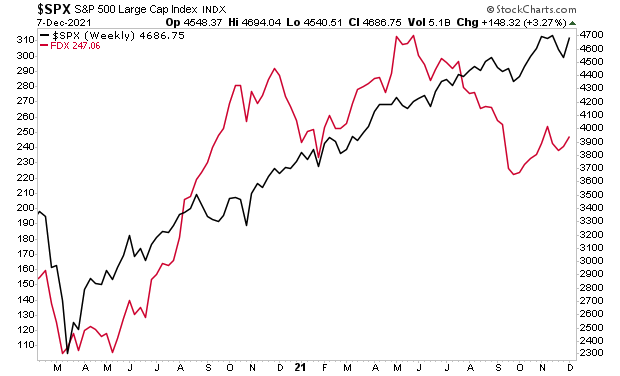
Or how about FedEx (FDX), which is even MORE sensitive to economic developments?

In simple terms, the signs are clear: the economy will be collapsing in 2022. And a bloodbath is coming to the markets. 

The losses will be staggering.

And it’s just the beginning. It’s quite possible the markets are entering a prolonged BEAR MARKET… a time in which stocks lose 50% or more over the course of months.

The coming bust is going to be life-changing for many people. Most will lose much if not everything. But a small number of investors will generate LITERAL FORTUNES.

Let me be blunt here, if you’re not taking steps to prepare for what’s coming, NOW is the time to do so.

For those looking to prepare and profit from this mess, our Stock Market Crash Survival Guidecan show you how.

Within its 21 pages we outline which investments will perform best during a market meltdown as well as how to take out “Crash insurance” on your portfolio (these instruments returned TRIPLE digit gains during 2008).

To pick up your copy of this report, FREE, swing by:

https://phoenixcapitalmarketing.com/stockmarketcrash.html

Best Regards

Posted by Phoenix Capital Research in stock collapse?
The Fed is NOT Coming to the Rescue This Time… Are You Paying Attention?

The Fed is NOT Coming to the Rescue This Time… Are You Paying Attention?

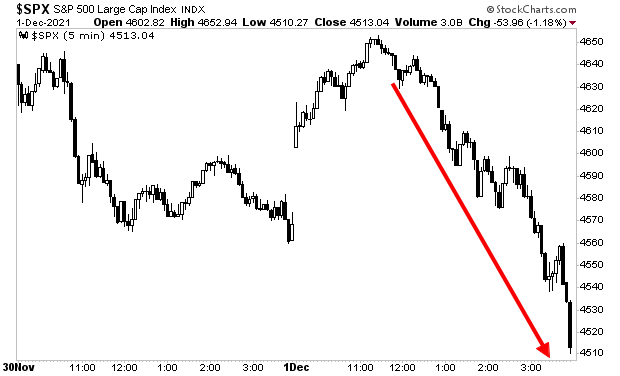
The dip buyers got annihilated yesterday.

Stocks started the day up as traders “bought the dip” expecting that once again the Fed would intervene to prop the markets up.

They were wrong, and stocks rolled over a dropped hard into the close.

Chart

Description automatically generated

What is going on here?

What is going on is that the Fed is no longer in the business of propping the markets up with more easing. As I noted yesterday, the Fed has completely shifted its focus from growth to inflation.

This means the Fed will be TIGHTENING, not easing going forward.

If you don’t believe me, maybe you’ll believe Fed Chair Powell who told a Senate panel yesterday: “The risk of persistently higher inflation has clearly risen, and I think our policy has adapted.”

“Policy has adapted” = we are tightening to crush inflation.

So, if you think the Fed is coming to the rescue anytime soon, you are mistaken. Stocks have NOT bottomed. If anything, this mess has just gotten started.

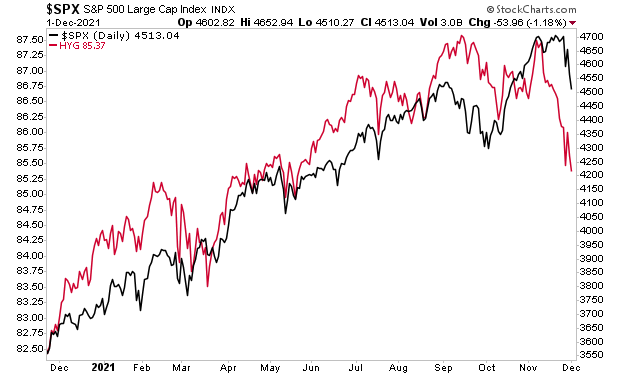
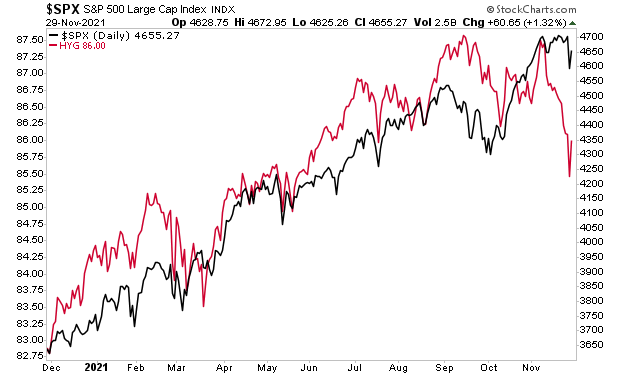
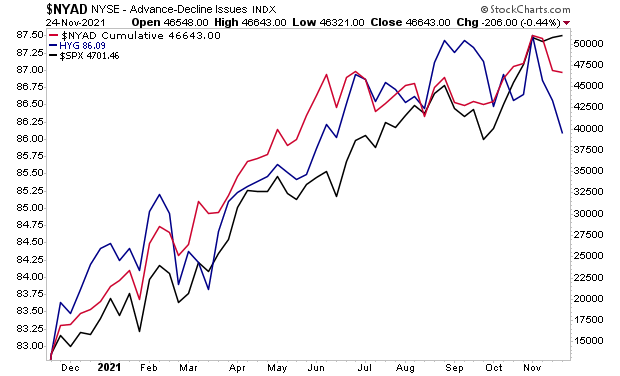
High yield credit (red line) has already figured this out. Stocks are only just starting to “get it.”

Chart, line chart

Description automatically generated

For those looking to prepare and profit from this mess, our Stock Market Crash Survival Guidecan show you how.

Within its 21 pages we outline which investments will perform best during a market meltdown as well as how to take out “Crash insurance” on your portfolio (these instruments returned TRIPLE digit gains during 2008).

To pick up your copy of this report, FREE, swing by:

https://phoenixcapitalmarketing.com/stockmarketcrash.html

Best Regards,

Posted by Phoenix Capital Research in stock collapse?
The Market is Telling Us It’s VERY Sick… Is Another Puke Coming?

The Market is Telling Us It’s VERY Sick… Is Another Puke Coming?

Let’s cut through the BS here.

You cannot predict the future. No one can. Not me. Not Warren Buffett. No one.

We cannot predict if omicron will prove to be a devastating mutation of the virus. Similarly, we cannot predict if world leaders will shut-down the economy again, regardless of the “science” behind that policy.

We also cannot predict if this hiccup will force the Fed to abandon its tightening policy. Nor can we predict what the impact will be on growth. Even if there are NOT shutdowns, we have no idea how another mutation will impact human behavior as far as spending, demand, and the like.

So what can we do?

Focus on price and let the market show us.

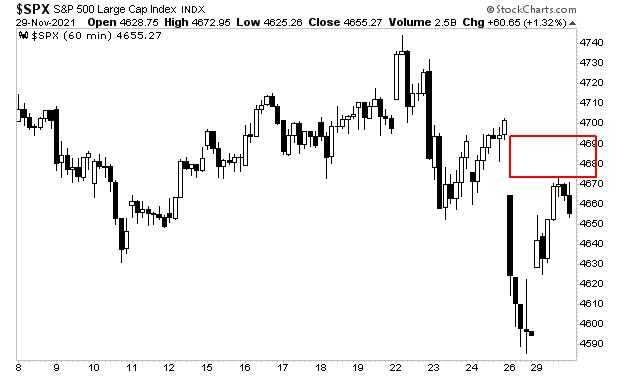
Yesterday’s price action was awful. You’d think after a dump like Friday’s we’d get a major bounce. NOPE. Stocks didn’t even “close the gap” created by that drop.

A picture containing text, antenna, screenshot

Description automatically generated

Moreover, high yield credit, which leads stocks, hasn’t recovered much if at all. If anything, it’s telling us that stocks are due for another bloodbath shortly.

As I said yesterday, I didn’t trust yesterday’s bounce…at all. Another puke is coming. And this time around, smart investors will be using it to get rich, instead of getting taken to the cleaners.

For those looking to prepare and profit from this mess, our Stock Market Crash Survival Guidecan show you how.

Within its 21 pages we outline which investments will perform best during a market meltdown as well as how to take out “Crash insurance” on your portfolio (these instruments returned TRIPLE digit gains during 2008).

To pick up your copy of this report, FREE, swing by:

https://phoenixcapitalmarketing.com/stockmarketcrash.html

Best Regards,

Posted by Phoenix Capital Research in stock collapse?
The Bloodbath Has Arrived

The Bloodbath Has Arrived

For weeks I’ve been pounding the table that the market is in serious trouble.

I’ve shown that four out of the market’s five most heavily weighted stocks have begun breaking down.

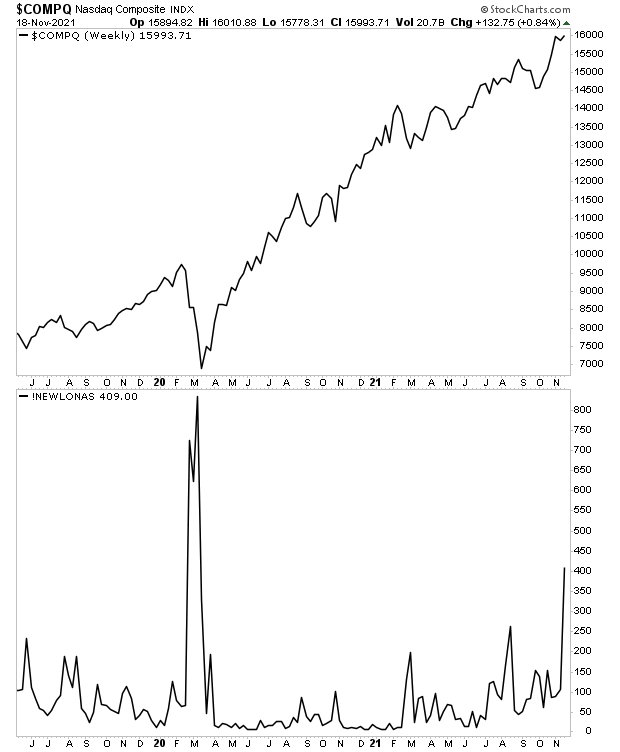
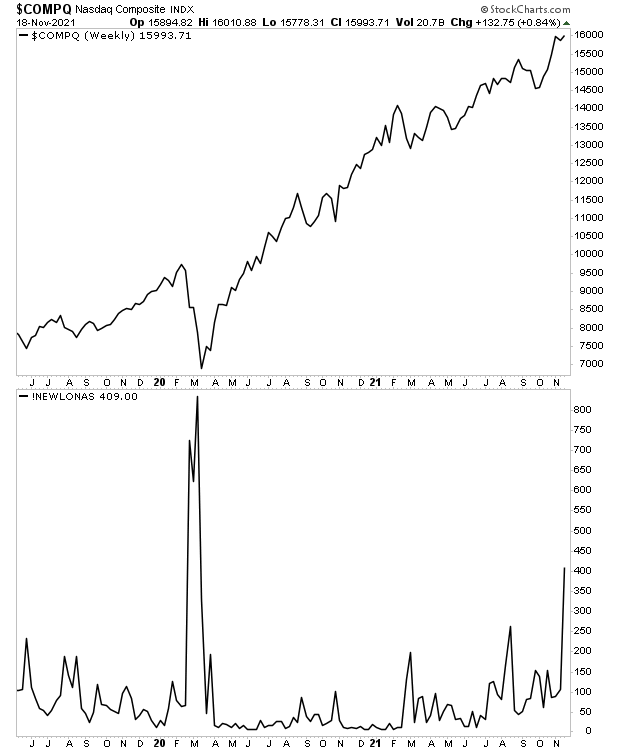
I’ve shown that only a handful of stocks are holding up the entire market as the number of NASDAQ stocks hitting new lows is approaching levels associated with the fastest 30% market crash in history.

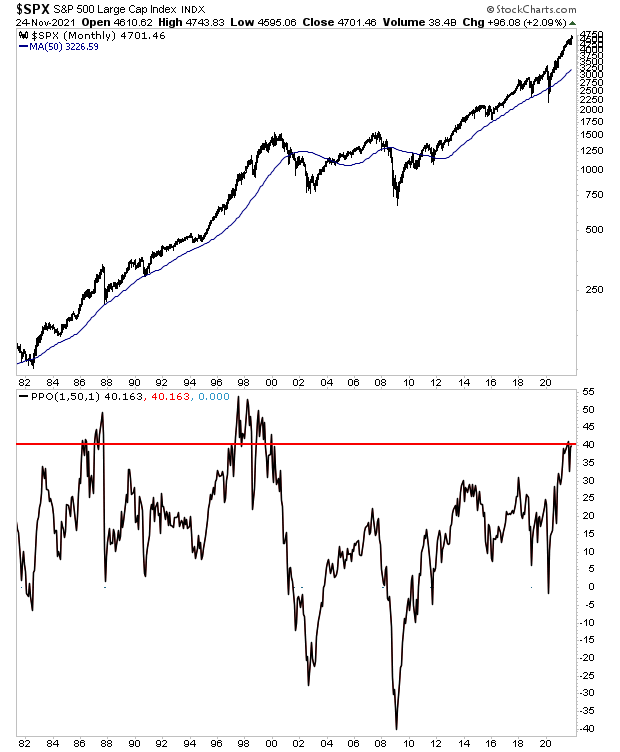
I’ve explained in great detail that the market is extremely stretched to the upside. Indeed, the only time it has been this stretched or more was right before the 1987 crash and during the Tech Bubble.

Chart, histogram

Description automatically generated

I’ve even shown that leading market indicators such as high yield credit and breadth had rolled over and were dropping hard.

Chart, histogram

Description automatically generated

Now the bloodbath has arrived.

For those looking to prepare and profit from this mess, our Stock Market Crash Survival Guidecan show you how.

Within its 21 pages we outline which investments will perform best during a market meltdown as well as how to take out “Crash insurance” on your portfolio (these instruments returned TRIPLE digit gains during 2008).

To pick up your copy of this report, FREE, swing by:

https://phoenixcapitalmarketing.com/stockmarketcrash.html

Best Regards,
Posted by Phoenix Capital Research in stock collapse?

Is the Everything Bubble About to Burst?

We are getting DARN close to a top of some kind.

The market is being propped up by fewer and fewer stocks. This week, the NASDAQ has had more stocks making new lows than at any time in since the March 2020 CRASH.

And the NASDAQ is at all-time highs.

Again, the NASDAQ is at all-time highs, but the number of NASDAQ stocks hitting new lows is approaching levels associated with the fastest 30% market crash in history.

A picture containing chart

Description automatically generated

This is truly incredible, and it tells us that just a handful of stocks are holding up the entire market. And this is during the greatest stock market bubble of all time… a bubble so massive that it makes the Tech Bubble look like a joke in terms of speculation.

The coming bust is going to be life-changing for many people. Most will lose much if not everything. But a small number of investors will generate literal fortunes.

If you’re interested in becoming one of them, you need to check out the signals that I rely on to tell me when a crash is about to hit.

I detail them, along with what they’re currently saying about the market today in a Special Investment Report How to Predict a Crash.

To pick up a free copy, swing by

https://phoenixcapitalmarketing.com/predictcrash.html

Best Regards

Posted by Phoenix Capital Research in stock collapse?, The Everything Bubble
The Next Fed Chair is Irrelevant… But This Sure As Heck Isn’t!!!

The Next Fed Chair is Irrelevant… But This Sure As Heck Isn’t!!!

The markets are waiting on President Biden who will announce his nominee for the new Fed Chair in three days’ time (over the weekend).

Will current Fed Chair Jerome Powell land a second term… or will the President hand the reins to Lael Brainard or some other Beltway insider?

Or… more importantly… does it even matter?!?!

The Fed has created the largest bubble in financial history… a situation so out of control that:

  1. Crypto currencies that were created as jokes are worth tens of billions of dollars.
  2. People are selling NFTs of farts.
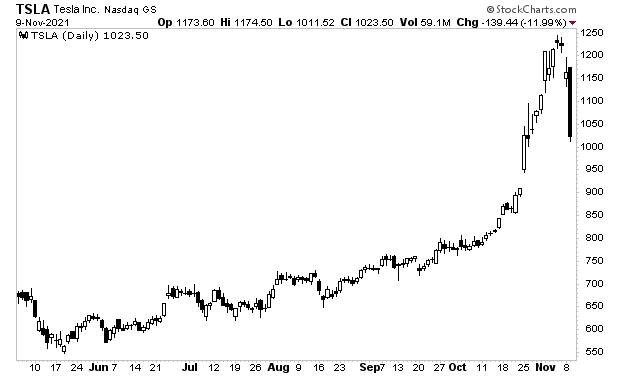
  3. Tesla (TSLA), a $1 trillion company, is trading like a penny stock.
  4. SPACs with NO ACTUAL BUSINESS OPERATIONS being valued at billions of dollars.
  5. Clean energy automobile companies with ZERO REVENUE are valued as being worth more than Volkswagen.

The bubble is massive even using normal metrics.

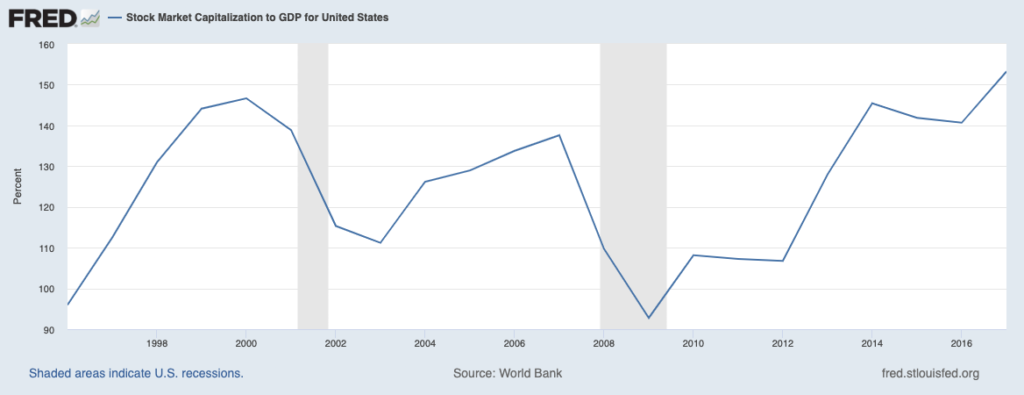
Warren Buffett’s favorite indicator (stock market capitalization vs. GDP) is at an all-time high, indicating this bubble is even larger than the Tech Bubble.

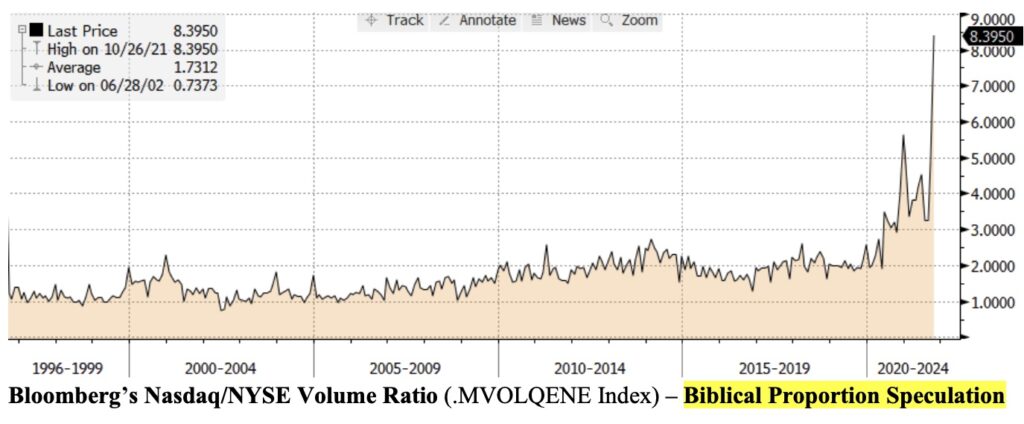
Options trading volume (a sign of speculation) also dwarfs that of the Tech Bubble. As Bill King noted, this is truly biblical in scope.

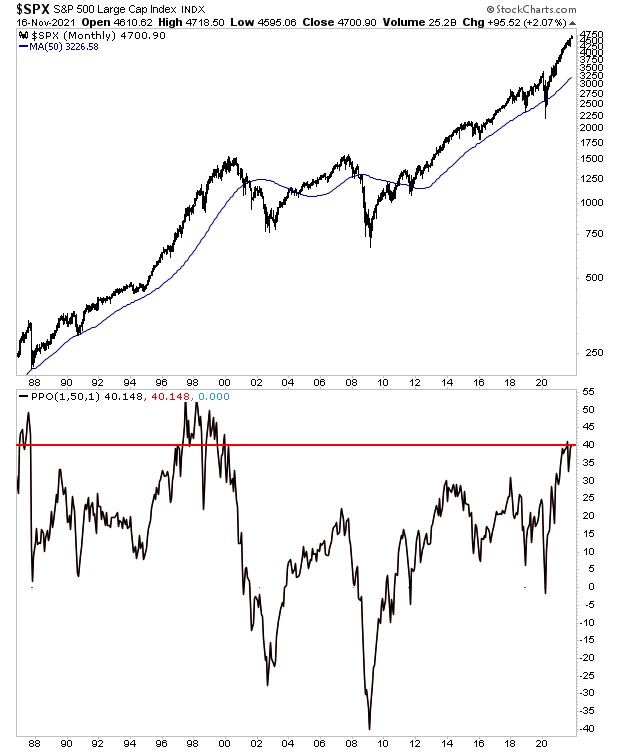
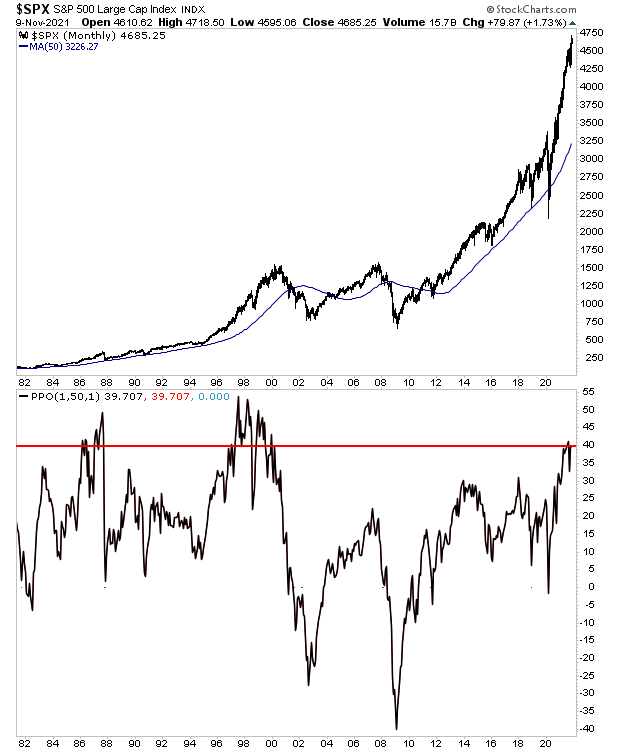
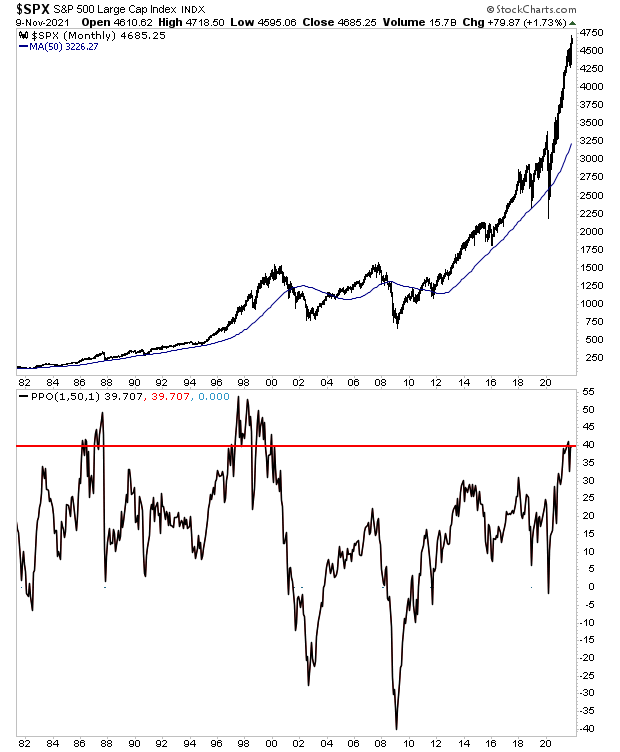
And then there’s the fact that the market is stretched a full 40% above its 50-month moving average (MMA). The only times in the last 35 years that it’s been stretched higher than this was right before the 1987 Crash and during the Tech Bubble’s final run to its peak before bursting.

So, whoever President Biden chooses as the next Fed Chair doesn’t really matter. Whoever it is, the bubble is still there, and is still going to burst, triggering the next major crisis.

So forget about the next Fed Chair. What you should be asking yourself is, “how can I avoid THIS?”

To figure this out, I rely on certain key signals that flash before every market crash.

I detail them, along with what they’re currently saying about the market today in a Special Investment Report How to Predict a Crash.

To pick up a free copy, swing by

https://phoenixcapitalmarketing.com/predictcrash.html

Best Regards​

Posted by Phoenix Capital Research in stock collapse?, The Everything Bubble
What’s Coming Will Be Worse Than 2008. Here’s Why…

What’s Coming Will Be Worse Than 2008. Here’s Why…

The great inflationary tidal wave continues to worsen. If anything, all signs indicate an absolute bloodbath is coming to the markets.

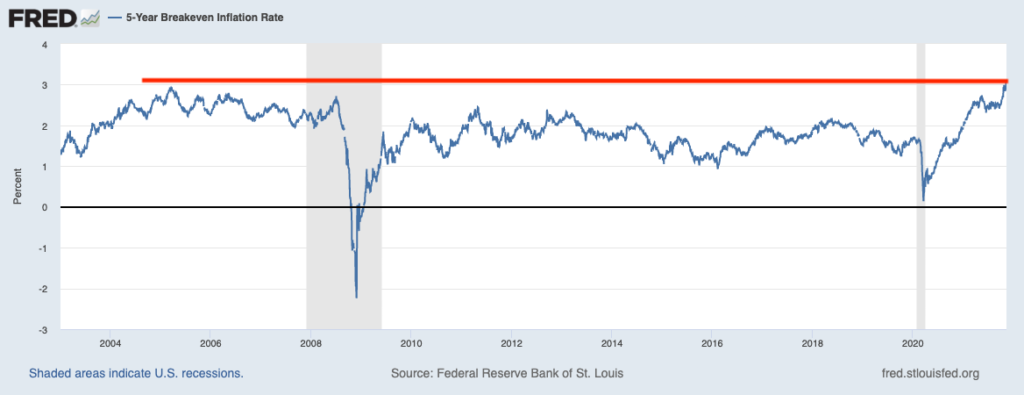
Five-year inflation breakeven’s just hit 3.11%. This is the highest reading running back to a least 2003. It’s higher than in 2011, when inflation triggered a food crisis around the globe. It’s also higher than in 2005-2006 when housing was in the largest bubble of all time and oil was about explode higher to $150 a barrel.

Put simply, the financial system is telling us that investors are terrified of inflation and that something truly horrific is coming our way. Worse still, by the look of things, the Fed will have a real problem on its hands trying to stop this. 

Think of it this way… the last time five-year inflation break-evens were even close to this level was in 2005-2006 and the economy and financial system were about to begin the worst recession and financial crisis in 80+ years.

This time around, the situation is far worse. Back then, the economy was growing by 5%-6% and the Fed had interest rates at 5%+ so it had plenty of room to ease to cushion the collapse.

Today the economy is structurally crippled due to the after-effects of the 2020 lockdown while the Fed still has rates at ZERO. If you think the economy is strong, consider that the Fed has admitted it doesn’t believe it can raise rates until the second quarter of 2022 (at the earliest). 

What kind of economy needs rates at zero to function?

Another key difference between the 2005-2006 period and today is that back then the Fed had yet to launch a single QE program. So, the impact of QE was still quite strong.

Today, the Fed is already engaged in a $120 billion QE program which it won’t fully end until mid 2022. 

Put simply, in 2005/ 2006 the Fed was in a much better position to combat a collapsing economy/ financial crisis. This time around, the Fed has already used every tool at its disposal, including some tools (buying corporate debt, municipal debt, etc.) that it technically shouldn’t be allowed to buy at all!

What will the Fed be forced to do when this happens? Cut rates into negative territory? Monthly QE of $250 billion? $500 billion? And what’s going to happen to the markets when this insane bubble bursts and this happens?

Even more importantly for investors…HOW DO WE AVOID THIS? 

To figure this out, I rely on certain key signals that flash before every market crash.

I detail them, along with what they’re currently saying about the market today in a Special Investment Report How to Predict a Crash.

To pick up a free copy, swing by

https://phoenixcapitalmarketing.com/predictcrash.html

Best Regards

​​

Posted by Phoenix Capital Research in stock collapse?, The Everything Bubble

This is the Real Reason the Fed is Terrified of Raising Rates From Zero

Why is the Fed so worried about tapering QE and raising rates?

Think about it… The Fed launched this current version of QE in a single day. Why does it take SIX months for the Fed to end it… especially since stocks are at all-time highs and the COVID-19 induced recession technically ended in June of 2020?

Moreover, this is the LARGEST QE program the Fed has ever run. The prior record was set by QE 3 in 2012 which saw the Fed printing $80 billion in new money per month. The Fed is currently printing $120 billion per month and has been doing so since March of 2020. And because it’s only tapering this program at a pace of $15 billion per month, this current QE will STILL BE larger than the prior largest QE ever a full two months into the taper!

Bear in mind, we’re only talking about QE here. The Fed is terrified of raising rates a full 15 months after the recession supposedly ended… at a time when there are truly INSANE signs of froth in the financial system

Some of the more egregious examples include:

  1. Crypto currencies that were created as jokes worth tens of billions of dollars.
  2. People selling NFTs for farts.
  3. Tesla (TSLA) a $1 trillion company trading like a penny stock.
  4. Options trading volume dwarfing that of the Tech Bubble.
  5. SPACs with NO ACTUAL BUSINESS OPERATIONS being valued at billions of dollars.
  6. Stocks at or recently at all-time highs across the board.
  7. Home prices at all-time highs and rising by 20% year over year.

And the Fed is SCARED of raising rates from ZERO!?!?! We’re not even talking about raising them by 2% or more… we’re talking about raising them from 0.25%!!!

What is going on here?

What’s going on is that this entire “recovery” is based on the Fed manipulating bond yields to extraordinarily low levels.

Our current financial system is based on debt, not gold or some other hard asset. U.S. government debt, called Treasuries, are the bedrock of this financial system. The yields on these bonds represent the “risk free” rate of return against which all risk assets (stocks, commodities, real estate, crypto, etc.) are valued.

The only reason you’ve got stocks at all-time highs is because the Fed has kept rates so low while pumping over $4 trillion in new money into the system. Take that away, and the whole mess is a house of cards.

You can see this everywhere, though you might not be able to connect the dots.

The whole situation is not a real recovery, it’s just a massive band-aid over deep structural wounds that policymakers forced on the economy and financial system when they pushed to shut the economy down.

You can tell the whole thing is total BS based on the stock market alone. Notice how this latest bubble is so extreme it actually exploded out of an uptrend in ways that neither the Tech Bubble nor the Housing Bubble ever did?

Diagram

Description automatically generated

That’s why the Fed is so terrified of normalizing monetary policy. Because it threw the kitchen sink at the financial system to create this bubble.

So what happens when the bubble bursts as all bubbles do? $250 billion in QE per month? $500 billion in QE per month?

At the end of the day, this is coming whether the Fed wants it or not. It’s just a matter of when.

The big question for investors is… HOW DO WE AVOID THIS? 

To figure this out, I rely on certain key signals that flash before every market crash.

I detail them, along with what they’re currently saying about the market today in a Special Investment Report How to Predict a Crash.

To pick up a free copy, swing by

https://phoenixcapitalmarketing.com/predictcrash.html

Best Regards

Posted by Phoenix Capital Research in Debt Bomb, stock collapse?, The Everything Bubble
The Fed is Trapped and a Crash is Coming

The Fed is Trapped and a Crash is Coming

The Fed is now trapped.

Consider:

  • Stocks were just at or are currently at all-time highs, trading at multiples that exceed even those of the Tech Bubble in 1999 (Market Cap/ GDP).
  • There are truly INSANE levels of froth in the markets:
    1. Options trading volume (a sign of speculation) is exponentially higher than it was during the Tech Bubble.
    2. Crypto currencies that were invented as jokes trade at tens of billions of dollars.
    3. Tesla (TSLA) a $1 trillion company, trades like a penny stock rising 15% in a single day.
    4. People are selling Non-Fungible Tokes (NFTs) of farts, and other garbage… and making significant money.
    5. “Meme stocks” or stocks that are traded for ironic/ humorous purposes rise triple digits in a single day.
    6. Former President Trump’s Special Purpose Acquisition Company (SPAC) rose to a value of $5 billion despite having no business or operations.
  • Real estate is on fire. Home prices are up 20% across the board, while apartment rents are up 7%-15%.
  • Gasoline prices are up 122% year over year, while protein prices (meat, fish, eggs) are up 10.5% year over year.

Despite all of this, the Fed has only just begun to taper its $120 billion Quantitative Easing (QE) program at a pace of $15 billion per month. Even at this pace, QE will STILL be above its former peak for another two and a half months (QE 3 was the prior record set in 2012 at $80 billion per month).

Put another way, the Fed’s idea of tightening monetary policy today is that it will run QE at emergency levels for another six months at least. It will only finally be DONE with QE in June of 2022.

Which is 24 months after the recession ended!

Oh, and the Fed doesn’t plan to start raising rates until around then either.

Meanwhile, inflation is ROARING. The Consumer Price Index (CPI) and Core Consumer Price Index (Core CPI) just hit their highest year over year readings since 1990 and 1991 respectively.

This is happening at a time when stocks are more stretched above historic metric than all but a few times in the last 40 years. The only times the market was MORE stretched than this was right before the 1987 crash and during the Tech Bubble.

So, the Fed is facing a conundrum. 

Either it starts tightening a lot more aggressively, thereby bursting this INSANE stock market bubble… or it continues down its current projected path, inflation destroys the economy and stocks crash anyway.

Simply put, one way or another, the following is coming.

The big question for investors is… HOW DO WE AVOID THIS? 

To figure this out, I rely on certain key signals that flash before every market crash.

I detail them, along with what they’re currently saying about the market today in a Special Investment Report How to Predict a Crash.

To pick up a free copy, swing by

https://phoenixcapitalmarketing.com/predictcrash.html

Best Regards,

​​

Posted by Phoenix Capital Research in stock collapse?
It’s Officially the Biggest Bubble of All Time… When Does It Burst?

It’s Officially the Biggest Bubble of All Time… When Does It Burst?

The market is on THIN ice.

This is the single largest stock market bubble in history. It’s larger than the Tech Bubble in multiple metrics including:

  1. Market cap/ GDP (Warren Buffett’s favorite metric).
Chart, line chart

Description automatically generated
  • Options trading volume (a sign of speculation). As Bill King has noted, this is BIBLICAL levels of speculation.
Chart

Description automatically generated
  • Tesla (TSLA) a $1 Trillion company (the size Mexico’s GDP) is trading like a penny stock, moving over 10% to the upside or downside on a given day.
Chart

Description automatically generated

Moreover, stocks are stretched some 40% above their 50-month moving average. It’s only been MORE stretched three times in the last 40 years: right before the 1987 Crash and during the Tech Bubble in the late ‘90s.

Chart, histogram

Description automatically generated

This whole mess is going to come crashing down in spectacular fashion… just as all bubbles do. In chart form, it’s only a matter of time before we experience this:

The big question for investors is… HOW DO WE AVOID THIS? 

To figure this out, I rely on certain key signals that flash before every market crash.

I detail them, along with what they’re currently saying about the market today in a Special Investment Report How to Predict a Crash.

To pick up a free copy, swing by

https://phoenixcapitalmarketing.com/predictcrash.html

Best Regards

Posted by Phoenix Capital Research in stock collapse?
Not One Sector Is in an Uptrend… Is A Crash About to Hit?

Not One Sector Is in an Uptrend… Is A Crash About to Hit?

Stocks are now on the edge of a cliff.

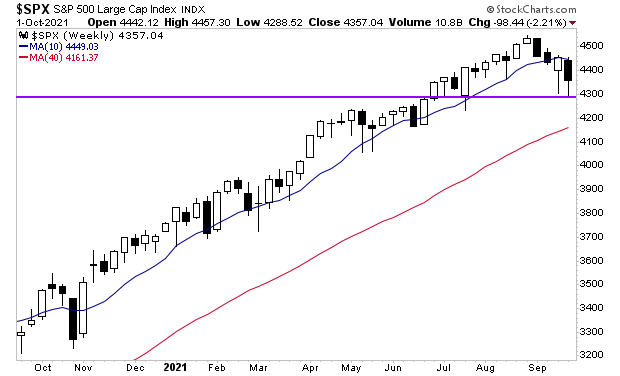
The S&P 500 broke below its 50-DMA two weeks ago. It has since failed to reclaim this line. That is the first time this has happened this year.

The good news is that 4,300 (purple line in the chart below) served as support last week for the market. But if the bulls cannot rally here and now, we’ll likely see a drop to the 200-DMA (currently at 4,161).

Chart, histogram

Description automatically generated

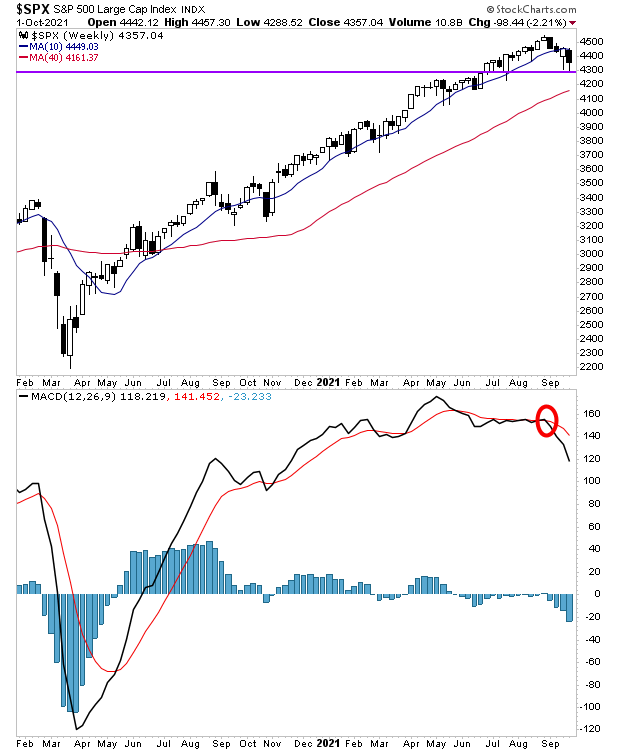
To make matters worse, the weekly MACD is on a “sell signal” (red circle in the chart below). You’ll note that this sell signal is quite different from previous signals in its depth and violence.

Chart, histogram

Description automatically generated

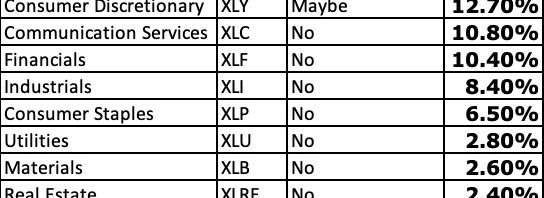
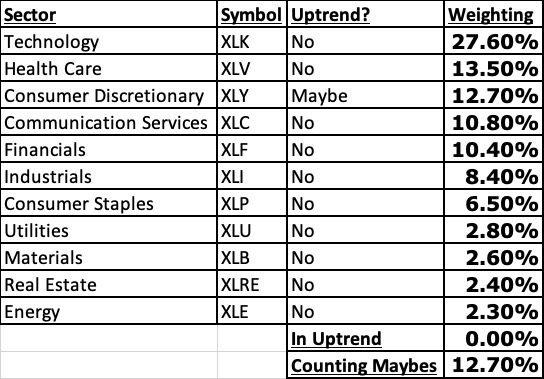
And finally, as of Friday, we had a new slew of weekly candles. Not one sector of the S&P 500 is in an uptrend. At best we have one that might be in an uptrend. The other 10 sectors are all in confirmed downtrends, meaning over 87% of the market’s weighting is in downtrends.

A picture containing text, receipt

Description automatically generated

This is all REALLY bad news. With this much of the market’s weight in downtrends, the door is open to some REAL fireworks!

This has many investors asking…

IS A CRASH ABOUT TO HIT!?!?

To figure this out, I rely on certain key signals that flash before every market crash.

I detail them, along with what they’re currently saying about the market today in a Special Investment Report How to Predict a Crash.

To pick up a free copy, swing by

https://phoenixcapitalmarketing.com/predictcrash.html

Best Regards

Posted by Phoenix Capital Research in stock collapse?
Stocks Are Sitting on the Ledge of a Cliff

Stocks Are Sitting on the Ledge of a Cliff

Stocks are now on the edge of a cliff.

The S&P 500 broke below its 50-DMA two weeks ago. It has since failed to reclaim this line. That is the first time this has happened this year.

The good news is that 4,300 (purple line in the chart below) served as support last week for the market. But if the bulls cannot rally here and now, we’ll likely see a drop to the 200-DMA (currently at 4,161).

Chart, histogram

Description automatically generated

To make matters worse, the weekly MACD is on a “sell signal” (red circle in the chart below). You’ll note that this sell signal is quite different from previous signals in its depth and violence.

Chart, histogram

Description automatically generated

And finally, as of Friday, we had a new slew of weekly candles. Not one sector of the S&P 500 is in an uptrend. At best we have one that might be in an uptrend. The other 10 sectors are all in confirmed downtrends, meaning over 87% of the market’s weighting is in downtrends.

A picture containing text, receipt

Description automatically generated

This is all REALLY bad news. With this much of the market’s weight in downtrends, the door is open to some REAL fireworks!

This has many investors asking…

IS A CRASH ABOUT TO HIT!?!?

To figure this out, I rely on certain key signals that flash before every market crash.

I detail them, along with what they’re currently saying about the market today in a Special Investment Report How to Predict a Crash.

To pick up a free copy, swing by

https://phoenixcapitalmarketing.com/predictcrash.html

Best Regards

Posted by Phoenix Capital Research in stock collapse?
September Ends BADLY… is a Crash About to Hit?

September Ends BADLY… is a Crash About to Hit?

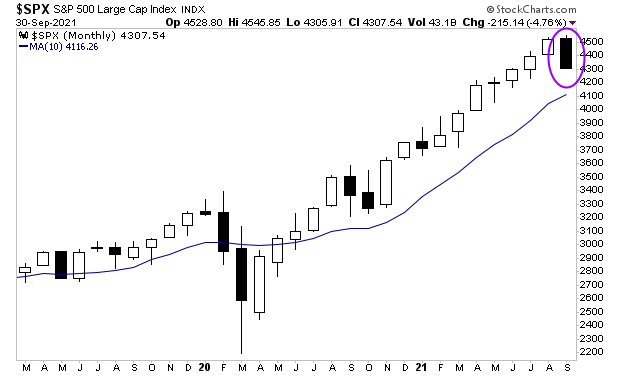
Stocks ended the month with an extremely ugly candle.

As the below chart shows, September ended outside the range of August (purple circle in the chart below). Historically, these developments usually resolve with the stock market testing its 10-month moving average (MMA).

As I write this Friday that line is at 4,116, however, we can expect it to rise to 4,1150 or so in the coming weeks. So, we’re talking about stocks dropping another 5% from here, which would bring the total correction to 10% or so.

Chart, waterfall chart

Description automatically generated

The bigger question is if stocks will stop there.

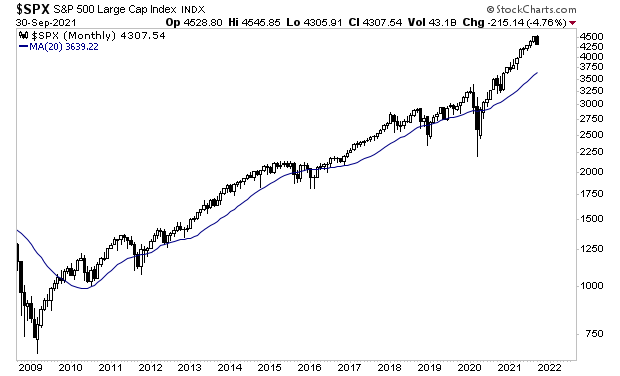
Despite the recent drop, stocks are still extremely stretched above their 20-MMA (some 13% to be precise). Historically any time the market has been this stretched, we’ve seen a drop to the blue line.

Chart

Description automatically generated

This has many investors wondering if a crash is about to hit.

To figure this out, I rely on certain key signals that flash before every market crash.

I detail them, along with what they’re currently saying about the market today in a Special Investment Report How to Predict a Crash.

To pick up a free copy, swing by

https://phoenixcapitalmarketing.com/predictcrash.html

Best Regards

Posted by Phoenix Capital Research in stock collapse?
The Market is in Serious Trouble

The Market is in Serious Trouble

The markets are bouncing today, but nothing has been resolved.

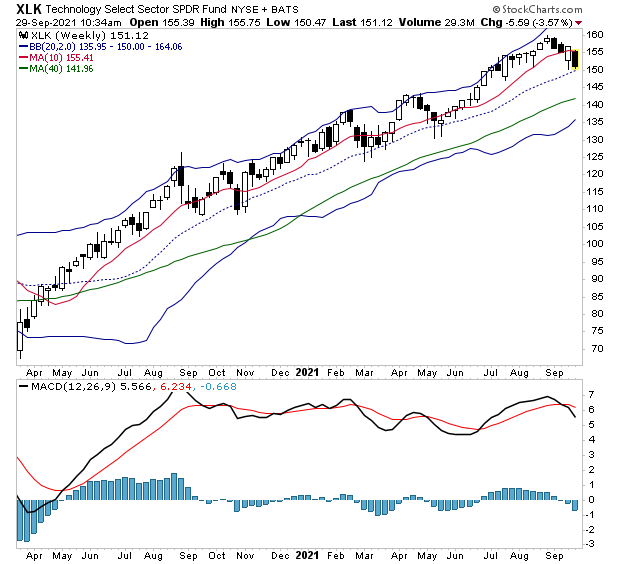
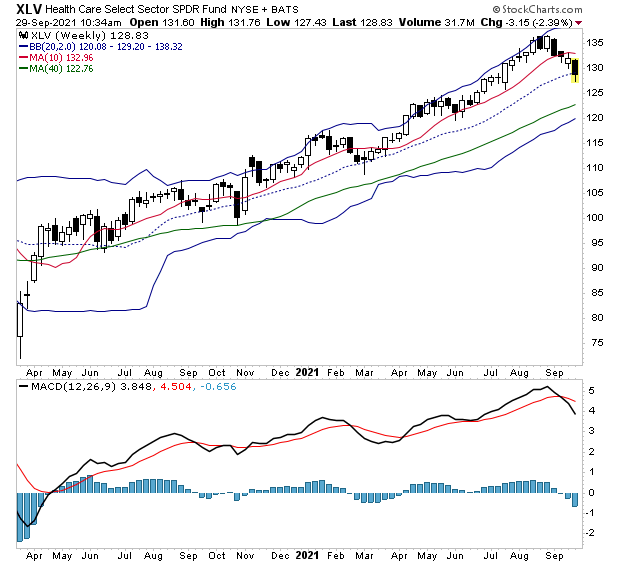
The technical damage from the last few weeks has been horrific. The two most heavily weighted sectors in the S&P 500 (Tech and Healthcare) are in confirmed downtrends.

Tech (XLK) has broken below its 50-DMA. It also as a sell on its weekly MACD.

Diagram

Description automatically generated with low confidence

It’s the same story for Healthcare (XLV).

Chart, histogram

Description automatically generated

These two sectors alone count for 40% of the S&P 500’s weighting. With both breaking down like this, the market is under significant duress. Throw in the fact that all but three sectors are in a similar situation, and we have some 85% of the market’s weighting in DOWNTRENDS.

This is the kind of environment in which fireworks can hit.

But is a crash about to hit?

To figure this out, I rely on certain key signals that flash before every market crash.

I detail them, along with what they’re currently saying about the market today in a Special Investment Report How to Predict a Crash.

To pick up a free copy, swing by

https://phoenixcapitalmarketing.com/predictcrash.html

Best Regards

Posted by Phoenix Capital Research in stock collapse?
Bonds Just Called the Fed’s Bluff… Stocks Are on Borrowed Time

Bonds Just Called the Fed’s Bluff… Stocks Are on Borrowed Time

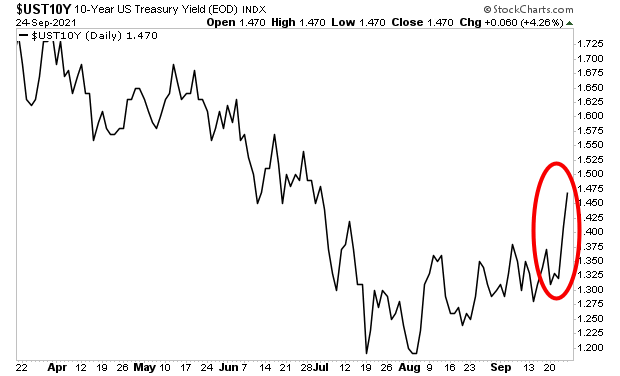
The biggest development last week was the breakout in the 10-year U.S. Treasury.

The 10-year US Treasury is arguably the single most important bond in the world. The yield on this bond represents the risk-free rate of return against which all risk assets (stocks, corporate bonds, mortgages, real estate, etc.) are valued.

Now, this yield moves based on a slew of issues: economic growth, portfolio balancing, Fed monetary policy, what’s happening in international bond markets… and inflation.

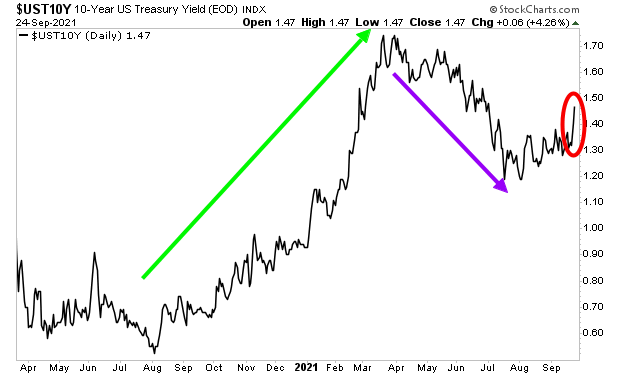
I mention all of this, because the yield on the 10-year US Treasury SPIKED sharply higher last week.

Chart

Description automatically generated

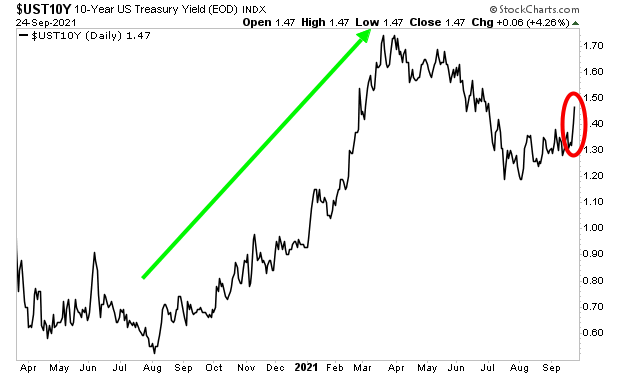
Let’s put this spike in a larger context.

From August of last year (2020) until March of this year (2021), the yield on the 10-Year Treasury spiked rose rapidly as inflation entered the US financial system. I’ve illustrated this spike with a green arrow in the chart below.

Chart, line chart

Description automatically generated

Then, in March of 2021, the Fed began to suggest that it was planning to tighten monetary policy. This hurt inflation expectations as the financial system began to believe the Fed would act quickly enough to stop inflation before it became a real problem. As a result of this, the yield on the 10-year Treasury dropped from March of 2021 until July.

I’ve illustrated this with a purple arrow in the chart below. This was, effectively, the bond market giving the Fed the benefit of the doubt when it came to monetary policy.

Chart, line chart

Description automatically generated

In this context, last week’s spike in the yield on the 10-year US Treasury represents the first time since March that the bond market began to freak out about inflation again.

This is a MASSIVE deal. It tells us that the market has called the Fed’s bluff: that the Fed won’t act to stop inflation in time and that the economy and financial system are heading towards a crisis in the near future.

If the Fed acts now, by tightening monetary policy aggressively, it will crash stocks. After all, the primary driver of this insane stock market bubble has been the Fed keeping rates at zero and pumping $120 billion per month into the financial system.

And if the Fed DOESN’T act now, inflation will rage, leading to a stag-flationary collapse in the economy… and stocks will still crash as inflation destroys profits in the corporate sector.

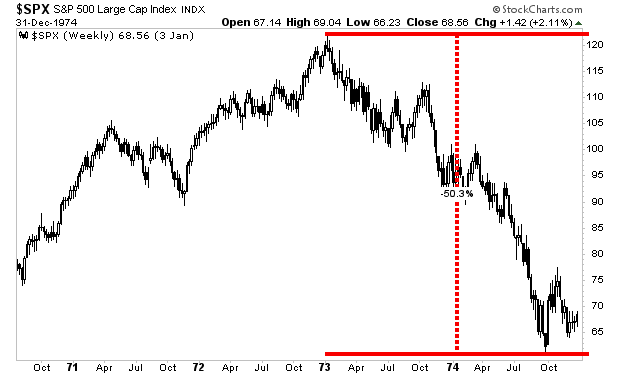
Just like in the mid-1970s, when stocks dropped 50% as inflation crippled the economy.

Put simply: a crisis is coming no matter what the Fed does.

The big question is “WHEN”!?!?

To figure this out, I rely on certain key signals that flash before every market crash.

I detail them, along with what they’re currently saying about the market today in a Special Investment Report How to Predict a Crash.

To pick up a free copy, swing by

https://phoenixcapitalmarketing.com/predictcrash.html

Best Regards

Posted by Phoenix Capital Research in stock collapse?
Anyone Who Understands Risk Management Is Watching This Like a Hawk

Anyone Who Understands Risk Management Is Watching This Like a Hawk

By Graham Summers, MBA

Was it a dead cat bounce… or something else?

On Monday, the markets were melting down due to fears of contagion from Evergrande, China’s second largest real estate company, going bankrupt.

Since that time, the market has bounced hard… despite the fact nothing has changed about Evergrande, or its $300 billion in debt, or the contagion issues that it presents to the financial system (commodities, EU banks, Australian miners, etc.).

So, the big question for stocks is: was this a dead cat bounce or the start of a new major rally?

Let’s find out.

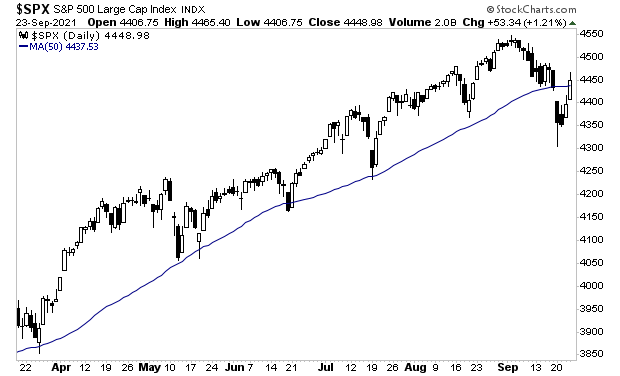
The S&P 500 is attempting to reclaim its 50-day moving average (DMA). As the below chart shows, this line has acted as major support throughout much of 2021. So, the fact we broke below it is significant. If the S&P 500 cannot reclaim this level and stay there… then stocks are in MAJOR trouble.

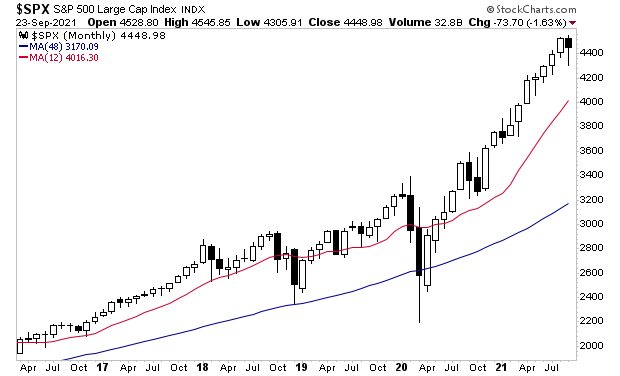
For anyone who understands risk management, the below chart has been a MAJOR concern for the last few months. On a monthly basis, the S&P 500 is EXTREMELY overstretched to the upside. At a minimum, you would expect a drop to the 12-month moving average (MMA) to occur sometime this year.

This would mean a 10% drop in stock prices. 

Note in the above chart that every drop to the 12-MMA started with a significant black candle. We’ve got one week left in September, but it looks like we could be getting our first black candle of the year.

However, given that stocks are in their largest bubble of all time by some measures… that leverage levels are obscene, and that we are seeing the kind of mania associated with major tops… smart investors are asking…

“Is a Crisis about to hit?”

To figure this out, I rely on certain key signals that flash before every market crash.

I detail them, along with what they’re currently saying about the market today in a Special Investment Report How to Predict a Crash.

To pick up a free copy, swing by

https://phoenixcapitalmarketing.com/predictcrash.html

Best Regards

Posted by Phoenix Capital Research in stock collapse?
An Urgent Update on China’s Black Swan

An Urgent Update on China’s Black Swan

By Graham Summers, MBA

The markets have rallied hard on news of a potential Evergrande debt payment.

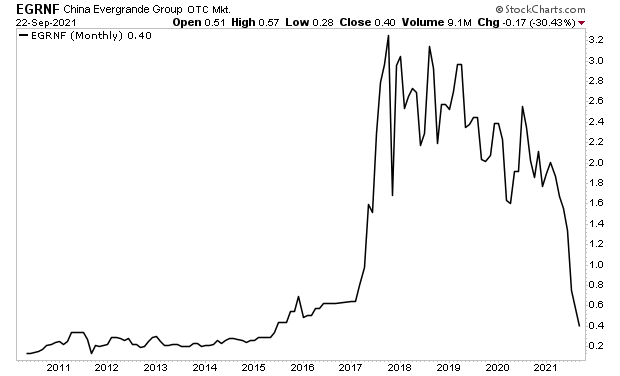
In case you’ve missed this story, Evergrande is a massive property developer in China. The company is effectively insolvent, and with $300 billion worth of debt many analysts were predicting this would lead to China’s “Lehman moment.”

We had some fireworks on Monday, but the markets have since rallied hard on news that Evergrande would make a payment on one of its Yuan-denominated bonds. 

That payment is expected to be made today.

Regardless of what happens with this specific payment, the fact remains that Evergrande is effectively insolvent. The chart says it all.

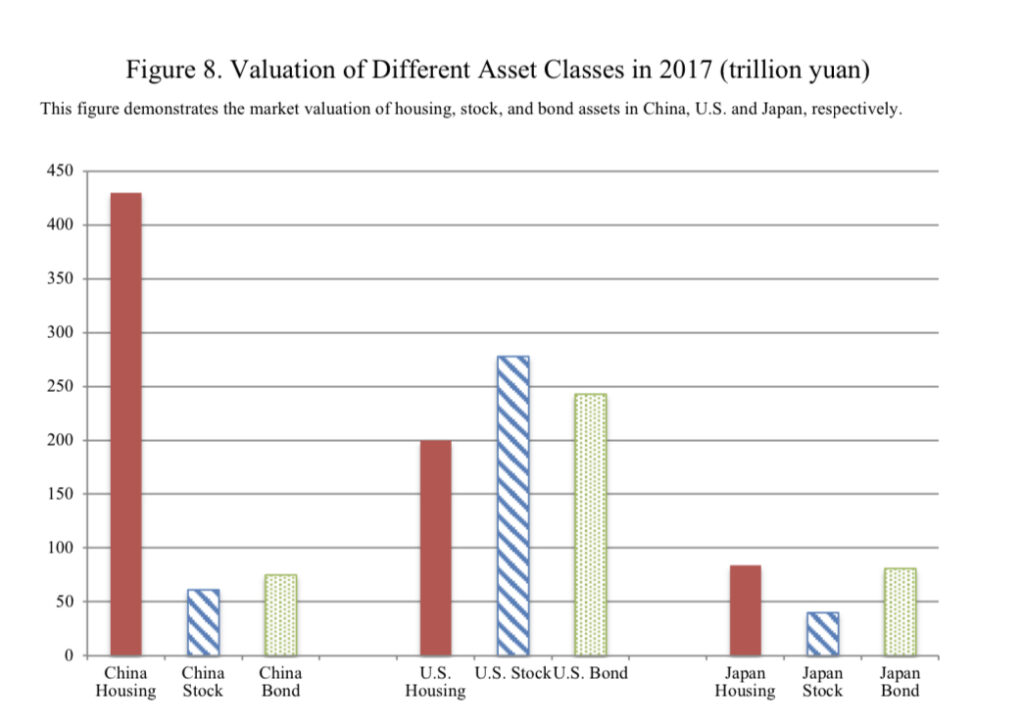
Moreover, this company is not an isolated situation. China’s government has made it clear it wants the real estate sector to deleverage, which means many of the over-indebted property developers are at risk of similar issues. Real estate and construction account for 16% of China’s ~$15 trillion economy… so this is not a small problem.

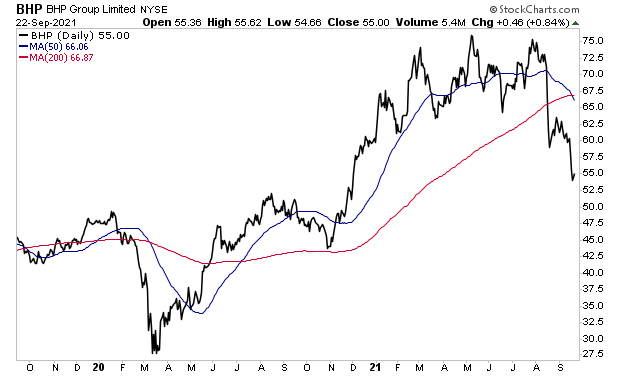
Keep an eye on BHP Group limited (BHP). As one of the largest Australian mining companies responsible for supplying China’s construction/real estate sectors, it’s a decent litmus test for whether or not this issue is really resolved or not.

As I write this, BHP is staging a VERY small bounce. The chart is profoundly ugly.

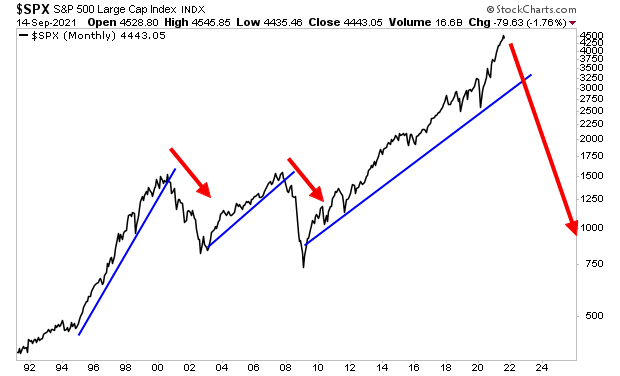
At the end of the day, whether Evergrande pays its bond or not today is just one paragraph in the book of bad debts that are floating around the financial system. The fact the Fed has spent over $4 trillion propping things up since 2020 doesn’t mean this whole mess won’t come crashing down.

In chart terms, it’s only a matter of time before this happens.

The multi-trillion dollar question is…

WHEN?!?!

To figure this out, I rely on certain key signals that flash before every market crash.

I detail them, along with what they’re currently saying about the market today in a Special Investment Report How to Predict a Crash.

To pick up a free copy, swing by

https://phoenixcapitalmarketing.com/predictcrash.html

Best Regards,
Posted by Phoenix Capital Research in stock collapse?
At Some Point, We Are Revisiting That Blue Line

At Some Point, We Are Revisiting That Blue Line

All eyes are on the Fed today.

The Fed is expected to announce its tapering schedule for its current $120 billion per month Quantitative Easing (QE) program. The Fed has been hinting at its plan for months, via both Fed officials and media proxies.
The current proposal appears to be a $10-$15 billion per month tapering program, starting in November 2021. This is a very rapid scheme that would bring its QE program to a complete end by mid-2022.

By way of comparison, during the Fed’s last QE taper (that pertaining to QE 3 in 2017), the Fed reduced the pace of its then-QE program by $10 billion every THREE months, with the pace stopping at $30 billion per month.

Again, the current proposed tightening is much faster and aggressive than the last.

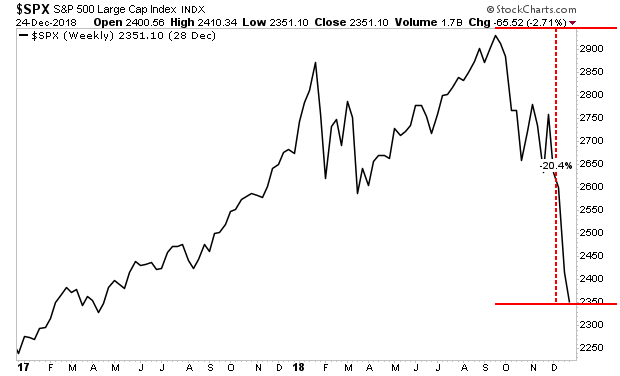
The big question is how the markets digest this. The last time the Fed attempted to taper a major QE program, it ultimately blew up the corporate debt markets resulting in stocks collapsing 20% in a matter of weeks.

Chart

Description automatically generated

Will the Fed blow things up again?

It’s quite possible, particularly when you consider that stocks are currently in their largest bubble in history by some measures… financial leverage is extraordinarily high… and we are seeing the types of mania associated with major market tops.

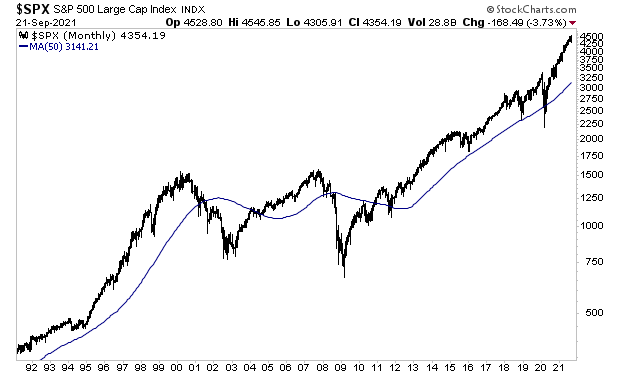
At the end of the day, the stock market is EXTREMELY overstretched above its 50 -month moving average. The only time it’s been more stretched was before the 1987 Crash and during the Tech Bubble.

Chart

Description automatically generated

At some point we are revisiting that blue line. The market always does.

By the way, the 50-MMA is currently at 3,141 while the S&P 500 is at 4354.

The big question is WHEN will this happen?

To figure this out, I rely on certain key signals that flash before every market crash.

I detail them, along with what they’re currently saying about the market today in a Special Investment Report How to Predict a Crash.

To pick up a free copy, swing by

https://phoenixcapitalmarketing.com/predictcrash.html

Best Regards

Posted by Phoenix Capital Research in stock collapse?
This is the Kind of Environment In Which Crashes Can Happen

This is the Kind of Environment In Which Crashes Can Happen

Stocks got creamed yesterday, but thanks to late day manipulation, they ended up well off the bottom.

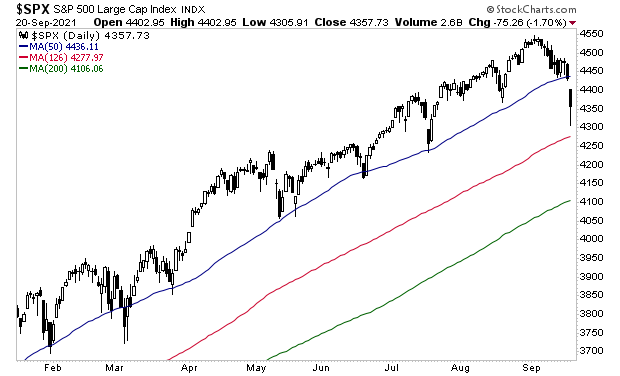
From a purely technical perspective, the S&P 500 has broken below its 50-day moving average (DMA) for the first time since March 2021. Stocks then bounced hard off the 126-DMA (six month moving average).

Chart, line chart, histogram

Description automatically generated

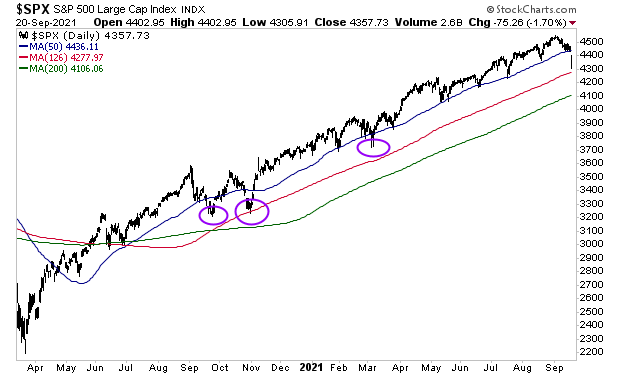
It will be crucial to see how the markets act the next few days. We’ve had three significant breaks below the 50-DMA since the March 2020 bottom: one in September ’20, October ’20 and March ’21 (purple circles in the chart below). All of those were resolved in a little over a week.

Chart

Description automatically generated

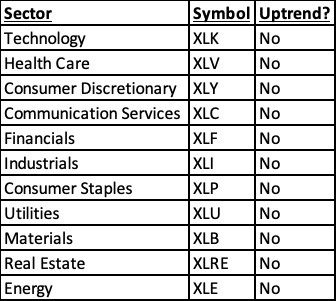
On the surface things don’t look that bad. But “underneath the hood” things are terrible. None of the S&P 500’s sectors are in uptrends.

Table

Description automatically generated

Moreover, four out of the five most heavily weighted stocks (AAPL, FB, AMZN, and GOOGL) have lost their 50-DMAs and are losing their uptrends.

This is the kind of environment in which actual crashes can happen. 

To figure this out, I rely on certain key signals that flash before every market crash.

I detail them, along with what they’re currently saying about the market today in a Special Investment Report How to Predict a Crash.

To pick up a free copy, swing by

https://phoenixcapitalmarketing.com/predictcrash.html

Best Regards

Posted by Phoenix Capital Research in stock collapse?