The Fed raised rates another 0.25% the week before last.
This marks the 5th rate hike since the Fed embarked on its policy tightening in December 2015 and the fourth rate hike in the last 12 months. The Fed’s latest statement also indicates it plans on raising rates three more times in 2018.
It is easy to gloss over the significance of this, but the Fed’s actions are indeed unusual; other major Central Banks (the Swiss National Bank, Bank of Japan, European Central Bank and Bank of England) are all currently running QE programs (the BoJ, ECB and BoE) or openly printing new money to buy stocks outright (the SNB).
What precisely is the Fed doing? Why the urge to tighten when other banks are all printing new money by the billions?
The following quotes from Fed offer us clues.
Fed Monetary Policy Report, June 2017:
“Forward price-to-earnings ratios for equities have increased to a level well above their median of the past three decades,
Fed minutes, July 2017:
“Since the April assessment, vulnerabilities associated with asset valuation pressures had edged up from notable to elevated, as asset prices remained high or climbed further, risk spreads narrowed, and expected and actual volatility remained muted in a range of financial markets.”
Janet Yellen response to question from IMF Panel, October 2017:
Market valuations “are at high level in historical terms” when assessed on metrics akin to price-earnings ratios,
Fed Minutes, October 2017:
“In light of elevated asset valuations and low financial market volatility, several participants expressed concerns about a potential buildup of financial imbalances,”
Janet Yellen during Fed presser December 13th, 2017:
Stock valuations are at high end of historical levels.
I want to be clear on the significance of these statements.
The Fed’s primary role is to maintain financial stability. This means that the Fed will always downplay risks in its public statements. Indeed, former Fed Chair Ben Bernanke once stated that Fed policy is “98% talk, 2% action.”
With that in mind, the above quotes are astonishing in their clarity: the Fed is explicitly stating (in Fed terms) that the markets are in a bubble. And the Fed didn’t just do this once, the Fed has been warning about asset valuations/froth in the system for six months straight.
So just how “frothy” are things that the Fed is being so explicit?
Try “1999-levels” frothy.
Perhaps the best means of measuring frothiness in stocks is the Price to Sales (P/S) multiple. Most investors prefer to use Price to Earnings (P/E), but I am wary of that method because earnings can easily be fudged via gimmicks (different methods of depreciation, write-offs, reducing loan loss reserves, tax loopholes, etc.).
Sales, on the other hand, are very hard to fudge. Either money came in the door, or it didn’t. And if a company gets caught fudging its revenues, someone goes to jail.
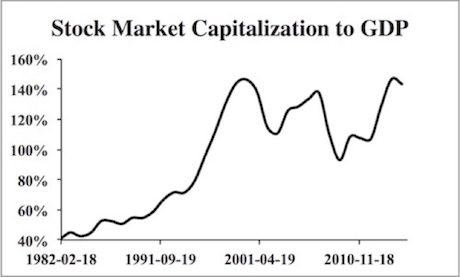
With that in mind, consider that the S&P 500’s current P/S multiple has surpassed its former all time peak from 1999: a period that is now widely considered to be the single largest stock bubble in history.
Put simply, stocks are extraordinarily overvalued by a reliable measure.
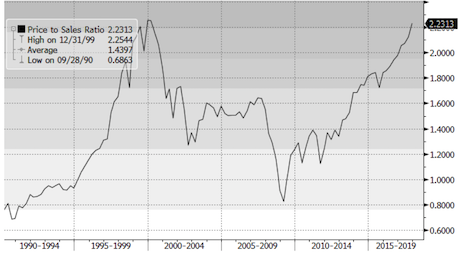
H/T Bill King
However, there is one main difference between 1999 and today…
Namely, that the Fed has been INTENTIONALLY creating bubbles for nearly 20 years today… and it’s out of more senior asset classes to use!
Let me explain…
The late ‘90s was the Tech Bubble.
When that burst in the mid-‘00s, the Fed created a bubble in housing.
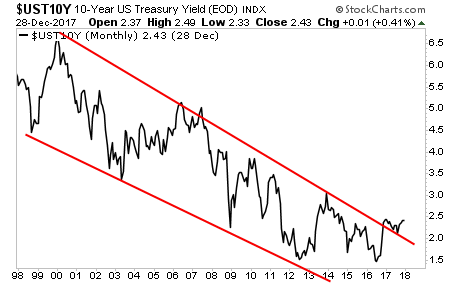
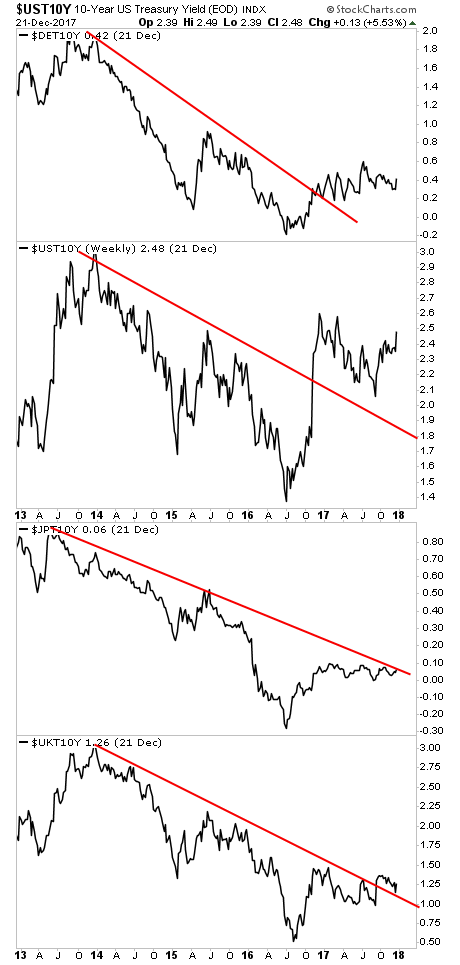
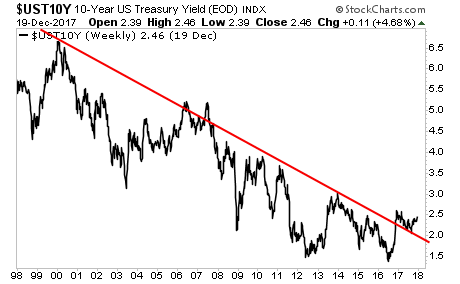
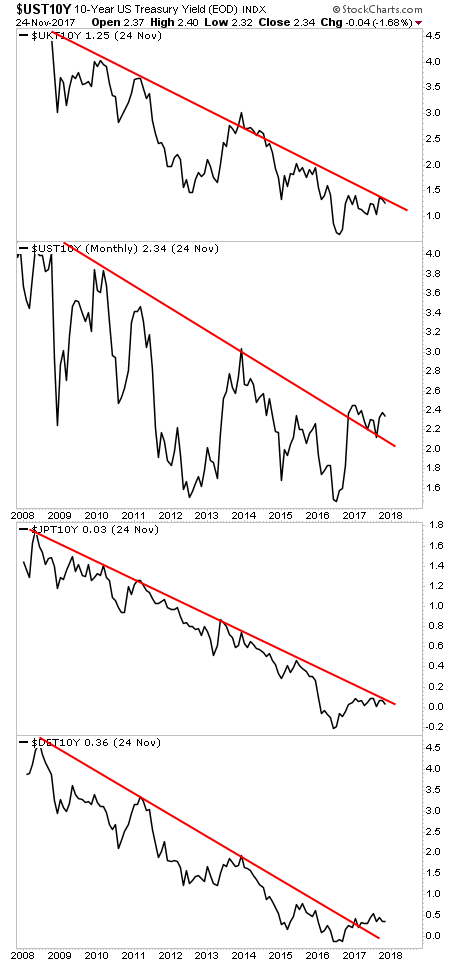
When that burst in ’08 the Fed created a bubble in US sovereign bonds or Treasuries.
And because these bonds are the bedrock of the US financial system, the “risk-free rate” of return against which ALL risk assets are valued, when the Fed did this it created a bubble in EVERYTHING (hence our coining of the term “The Everything Bubble” and our bestselling book by the same name).
On that note, we are putting together an Executive Summary outlining all of these issues as well as what’s to come when The Everything Bubble bursts.
It will be available exclusively to our clients. If you’d like to have a copy delivered to your inbox when it’s completed, you can join the wait-list here:
https://phoenixcapitalmarketing.com/TEB.html
Best Regards
Graham Summers
Chief Market Strategist
Phoenix Capital Research