President Trump is worsening the trade war between China and the US in order to force the Federal Reserve to ease monetary policy.
Before proceeding, I want to stress that none of the following is meant to be political analysis. I’m NOT saying I like any of this. I’m merely pointing out what is going on with the President of the United States and the Federal Reserve.
Since December 2018, President Trump has been harassing the Fed virtually non-stop. According to the President, the Fed is responsible for the US economy not growing more rapidly as well as the US stock market not being higher.
All told, the President has tweeted about the Fed over 30 times in 2019 alone. And he is doing so at an increasing pace, with six tweets concerning the Fed in the last 48 hours alone.
Put simply, the political pressure on the Fed has been truly incredible for the last eight months. Between the President and his advisors, there have been at least two anti-Fed statements made by the current administration almost every week for the last 26 weeks.
Having been berated for the first half of the year, the Fed finally buckled and cut rates in July by 0.25%. At that time, it was clear that the move was due to political pressure, nothing else. The Fed all but admitted this by stating the rate cut was a “mid-cycle adjustment” and not the start of an easing cycle.
The President was livid. For three months straight he and his advisors had been pushing for the Fed to cut rates by at least 0.5%. The fact the Fed only delivered a 0.25% rate cut, and then followed it up by stating it was a “mid-cycle adjustment” was a clear signal that the Fed wasn’t going to deliver in a way the President would have liked.
And so the President changed strategies, and intensified the trade war with China in order to force the Fed to ease.
The weekend after the Fed cut rates by just 0.25%, President Trump announced he was considering raising tariffs by another 10% on $300 billion worth of Chinese goods.
China, in return, has devalued the Yuan and subsequently announced it will hit the US with additional tariffs on $75 billion worth of American goods.
Which brings us to the Fed’s Jackson Hole meeting… and perhaps the most egregious example of the Trump administration using the trade war to force the Fed to ease.
Last Friday at 10AM, Fed Chair Jerome Powell gave a speech. Among other things he said:
1) Events since the Fed’s July meeting have been “eventful”
2) The Fed sees further evidence of a global slowdown, especially in Germany and China.
3) Fitting “trade policy” into the Fed’s framework is a new challenge.
4) The Fed will act “as appropriate to sustain the expansion.”
To top it off, Powell made exactly ZERO reference to the Fed’s recent rate cut being a “mid-cycle adjustment.”
The President obviously thought this was not aggressive enough and immediately tweeted:
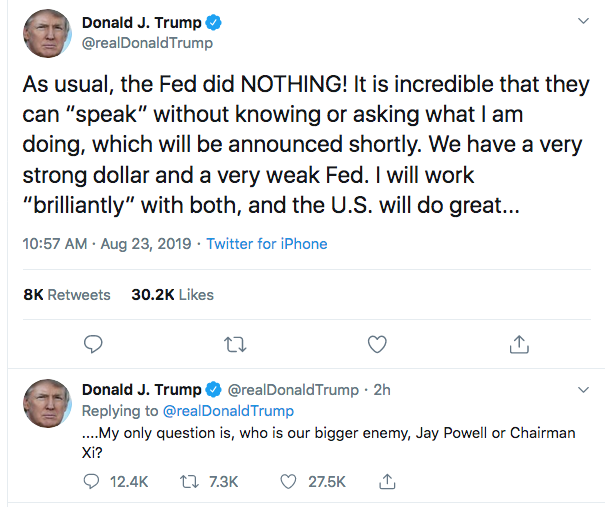
He then followed up this scathing rebuke of the Fed with the following statement on China.
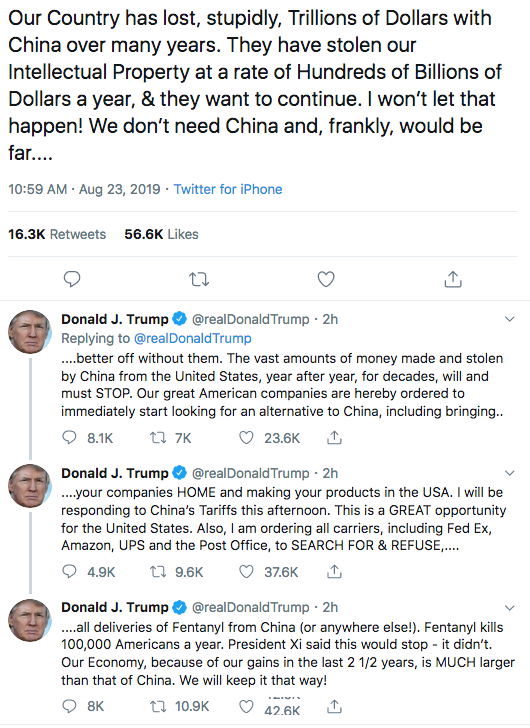
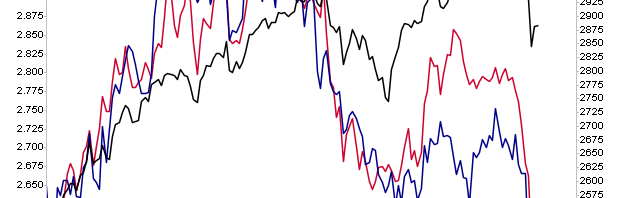
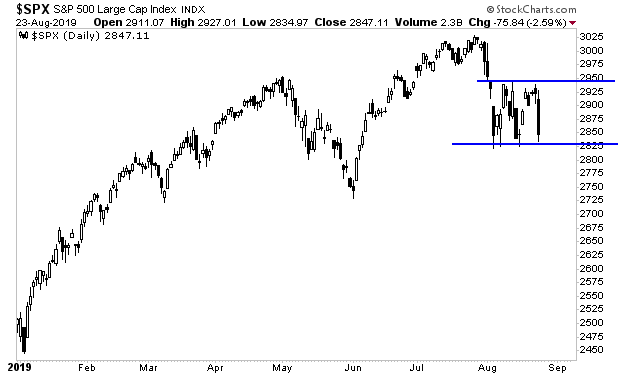
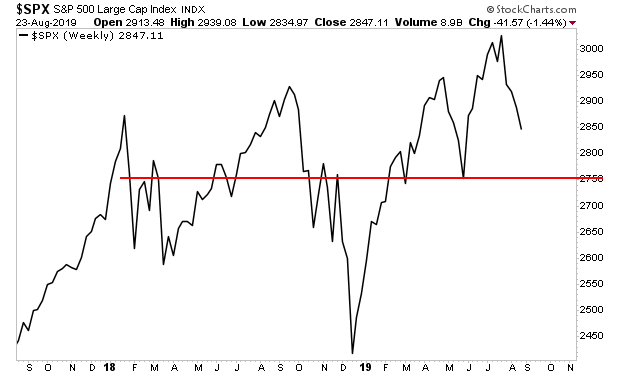
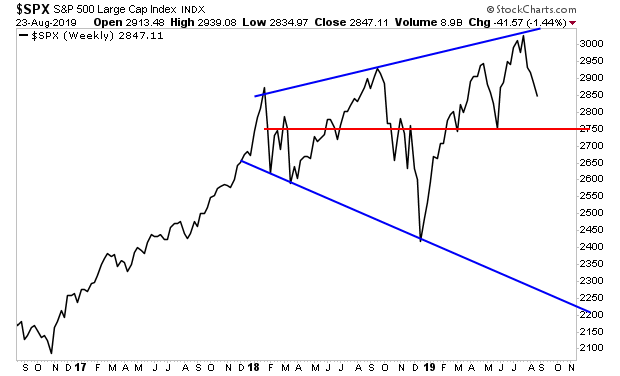
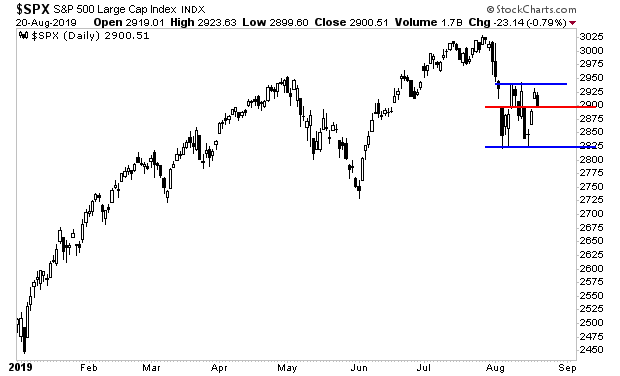
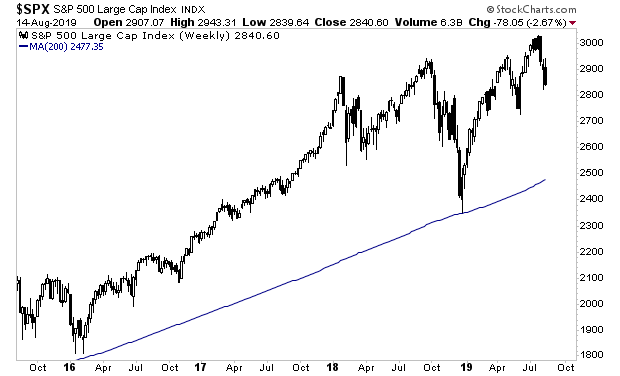
And the markets collapsed.
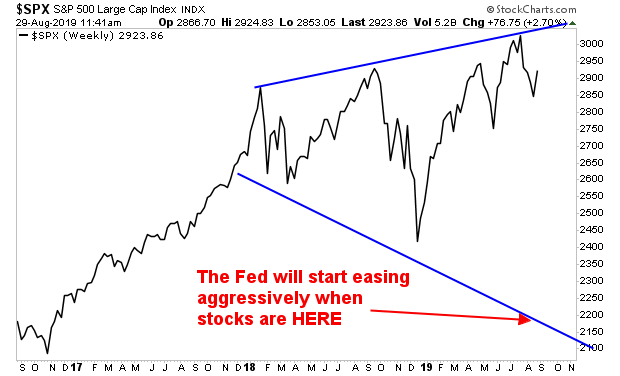
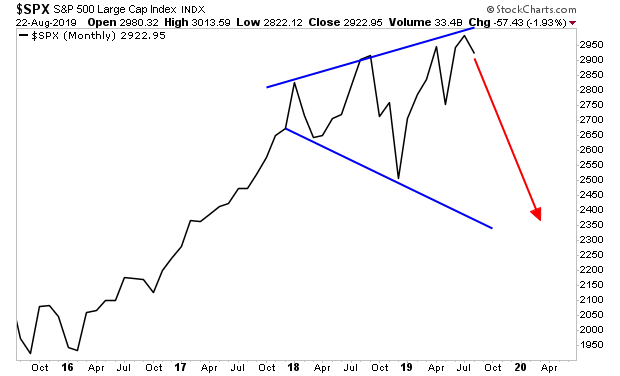
If you think this is over, you’re mistaken. The President is not going to back down on anything trade related until the Fed begins an aggressive campaign of easing monetary policy.
Unfortunately the level at which the Fed will finally do this is MUCH lower than most think.
On that note, we are already preparing our clients for this with a 21-page investment report titled the Stock Market Crash Survival Guide.
In it, we outline the coming collapse will unfold…which investments will perform best… and how to take out “crash” insurance trades that will pay out huge returns during a market collapse.
Today is the last day this report will be available to the general public.
To pick up one of the last remaining copies…
https://www.phoenixcapitalmarketing.com/stockmarketcrash.html
Best Regards
Graham Summers
Chief Market Strategist
Phoenix Capital Research
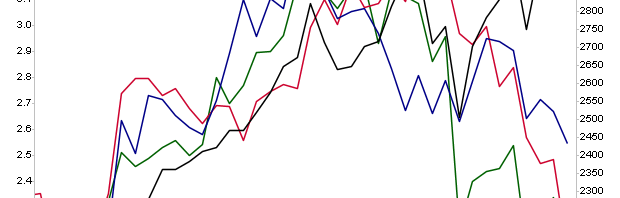
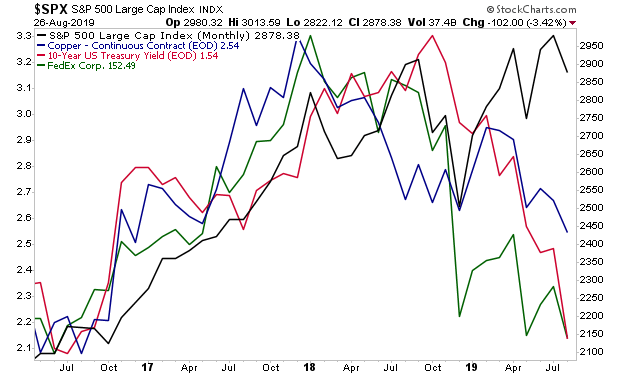
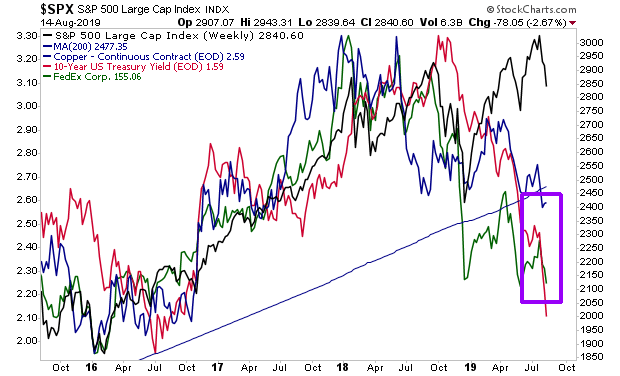
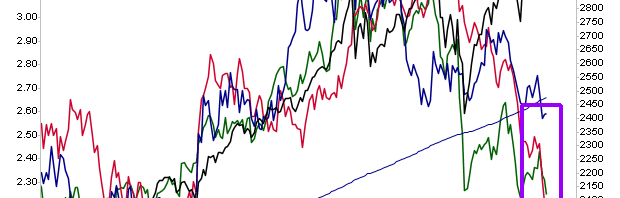
 Unfortunately that’s where Copper, Bond Yields, and Fed Ex, all of them real-world economic indicators, indicate that stocks are heading.