That’s THREE strikes against the Fed.
The Fed cut rates again in September.
At this point, trying to keep track of the Fed’s reasoning for monetary policy is all but impossible. There is no logic or reason behind anything they do.
A year ago, the Fed told us that hiking rates four times a year while running $50 billion in Quantitative Tightening (QT) per month would have no effect on the economy or financial system.
At that time, the Fed told us that even if the financial markets did drop because of Fed policy, the Fed would not change course.
Then, in the span of six weeks, from late November to early January the corporate bond market imploded, and the Fed abandoned its entire strategy for normalization. Stocks suffered a crash and the Treasury had to step in to prop the system up.
That’s Strike #1: the Fed proved its models for projecting the impact of monetary policy on the financial system had no connection to actual reality.
Moreover, anyone who was monitoring the financial system would have seen as early as last July that the Fed’s policy was destroying global growth and would result in a crash (I certainly did).
Strike #2 came later after the Fed spent six months (January to July of this year) pushing for extreme monetary policy including:
1) Introducing Negative Interest Rates
2) Making Quantitative Easing (QE) a permanent, normal policy instead of one used during crises.
3) Targeting bond yields to corner the bond market even more.
4) Using QE to buy assets other than Treasuries (corporate debt, stocks, etc.).
It’s odd because throughout this time period, the U.S. economy was growing and unemployment was falling. And yet, for six months the Fed claimed it was data dependent, while suggesting it should start using these various monetary tools.
Strike #2 hit when the Fed then cut rates in July despite unemployment being below 4%, the economy growing by at least 2% and stocks being within spitting distance of all time highs.
If you’re going to claim you’re data dependent and can’t be influenced politically, why would you then cut rates when ALL of the data is ranging from strong to very strong? The only reason the Fed is that the Fed buckled to political pressure from the Trump administration. So there goes its claim that it is politically independent as well as its claim it focuses on the data.
That’s Strike #2 for the Fed.
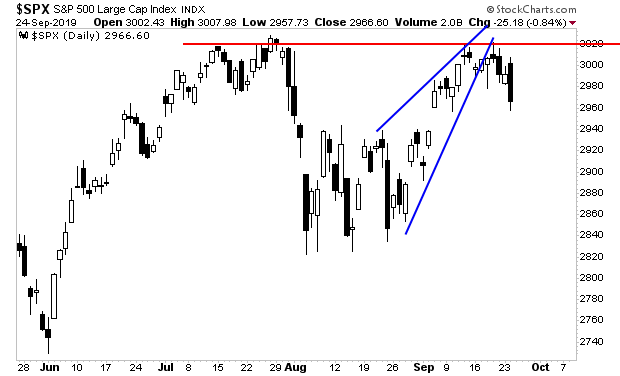
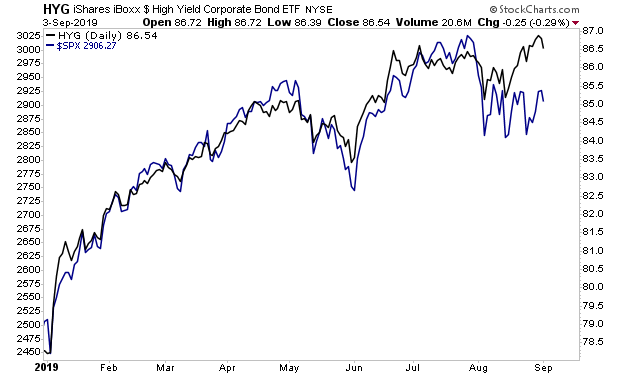
Which brings us to late September, in which the Fed cut rates again despite both economic data and the financial markets strengthening since July, while also ignoring the worst liquidity crisis since 2007.
You’ve probably heard about the “repo crunch” or “liquidity crisis” occurring at the Fed over the last few weeks. A detailed explanation of these issues would require an entire book, so for simplicity’s sake, the best explanation is as follows:
1) Banks park money with the Fed on a daily basis.
2) If banks have extra capital, they lend it to other banks that need it at a particular interest rate.
3) This interest rate is THE interest rate the Fed targets with its rate cuts/rate increases.
4) Banks have suddenly started charging one another a rate of interest that is HIGHER than the Fed’s desired rate. This means capital is in high demand “behind the scenes” which suggests banks are in trouble.
How bad was it?
Overnight lending facilities hit rates as high as 5%+ (remember the Fed’s current desired rate is 2.25%) for capital.
All of this indicates that “someone” or “someones” are in SERIOUS need of money. To address this situation, the Fed has had to stage its first liquidity injections since the 2008 crisis. All told, the Fed will put $275 BILLION into the financial system at the end of September.
So when I saw “someone “ or “someones” are in trouble, I’m not talking about a small hedge fund, I’m talking about large financial institutions that need nearly a over quarter of a trillion dollars in funding over a four day period.
If this sounds a little familiar it is exactly what happened in 2007 during the first phase of the credit crisis.
From August 2007:
The Fed garnered attention last week by adding billions of dollars to the money market to relieve upward pressure on interest rates. How do these operations work? Here’s a primer.
The Fed influences growth and inflation by controlling short-term interest rates. It controls those rates in turn via its monopoly over the supply of reserves to the banking system.
Source: Wall Street Journal
Put simply, the Fed is currently facing the worst funding issue in over a decade. Again, we’re talking $275 billion in liquidity injections occurring.
How did the Fed address this in its FOMC meeting and Powell’s Q&A session?
It didn’t.
There was little if any mention of any of the above issues by the Fed. Fed Chair Jerome Powell completely avoided the topic during his prepared remarks. And during the Q&A portion of his appearance he ducked every question concerning it, instead suggesting that this issue was related to the U.S.’s fiscal condition, which are the “Treasury’s job and Congress’s job.”
Strike 3.
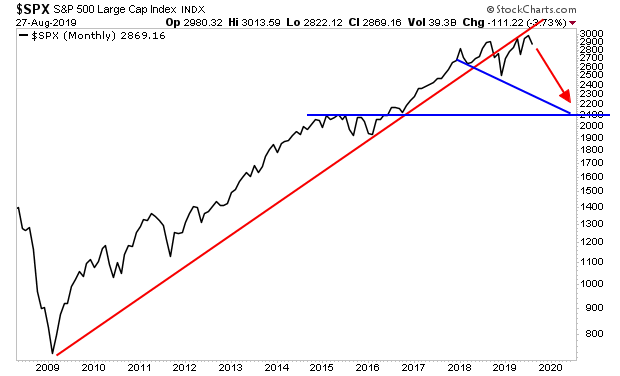
At this point it is clear the Fed no clue what it’s doing. Between this and the desperate efforts to pump money into the system I’d say we’re in “late 2007” when it comes to the next crisis.
A Crash is coming… and smart investors are preparing NOW before it hits.
On that note, we are already preparing our clients for this with a 21-page investment report titled the Stock Market Crash Survival Guide.
In it, we outline the coming collapse will unfold…which investments will perform best… and how to take out “crash” insurance trades that will pay out huge returns during a market collapse.
Today is the last day this report will be available to the general public.
To pick up one of the last remaining copies…
https://www.phoenixcapitalmarketing.com/stockmarketcrash.html
Best Regards
Graham Summers
Chief Market Strategist
Phoenix Capital Research
 This isn’t too much of a surprise…