By Graham Summers, MBA
As I noted in yesterday’s article, if you want to make real money from the markets, you need to ignore what the Fed is saying and focus on price.
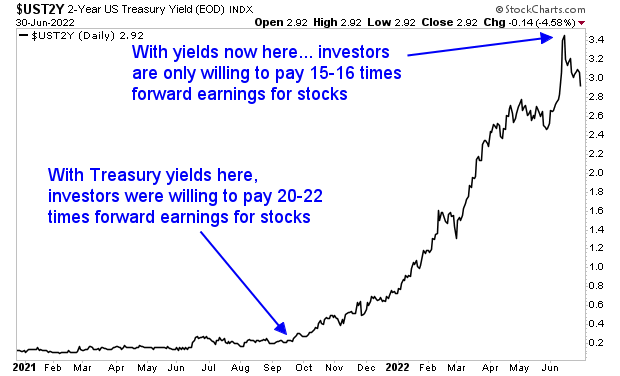
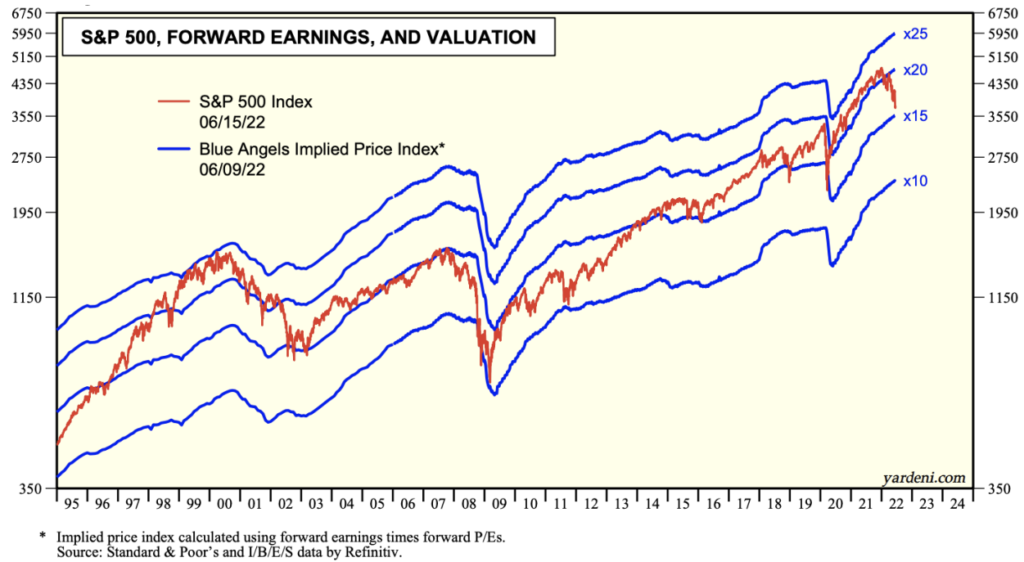
By quick way of review, the Fed and its awful predictions are the primary reason stocks have collapsed so far in 2022. The Fed screwed up with inflation. And inflation is the reason why Treasury yields spiked, forcing stocks to be repriced from 20-22 times forward earnings down to 15-16 times forward earnings (as Ed Yardeni’s fantastic chart below reveals).
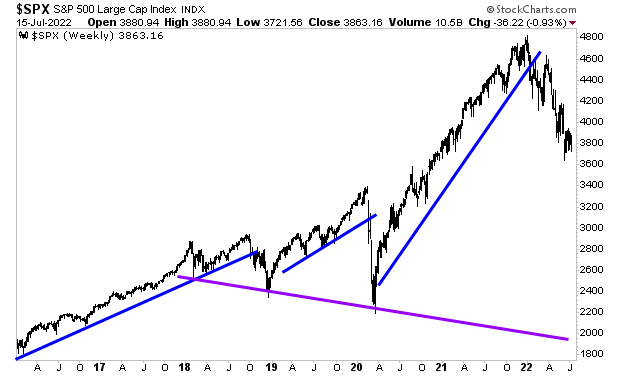
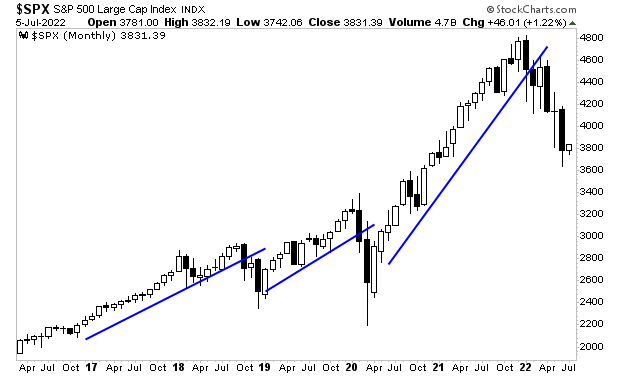
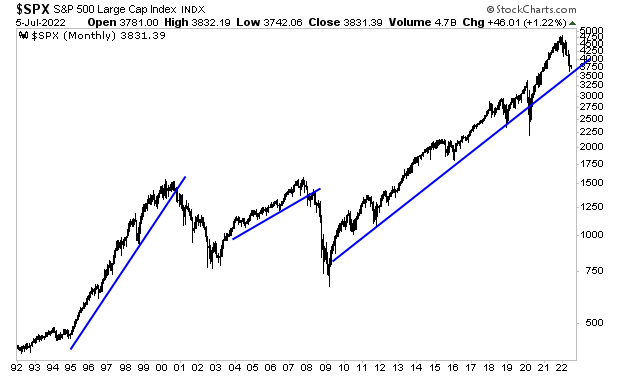
Again, if you are looking to profit from the markets, you’re much better off ignoring the Fed and focusing on price.
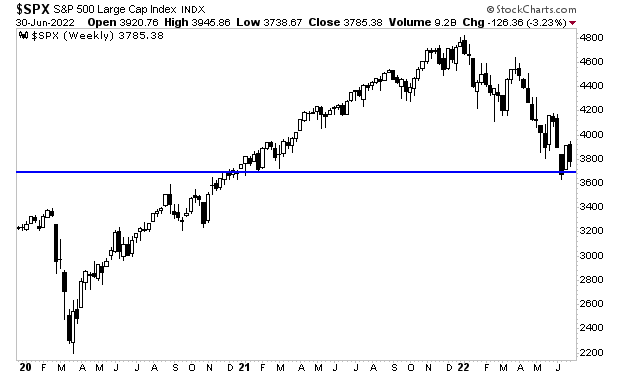
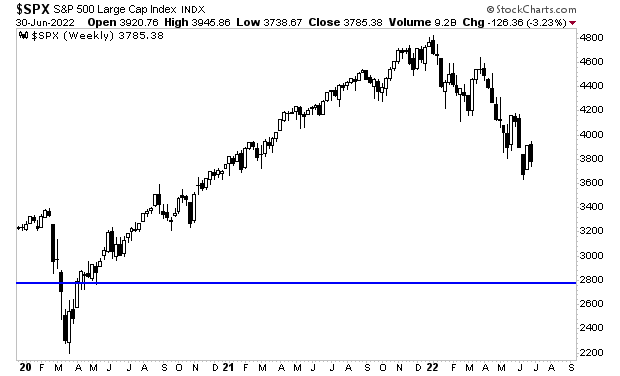
So, what is price telling us now?
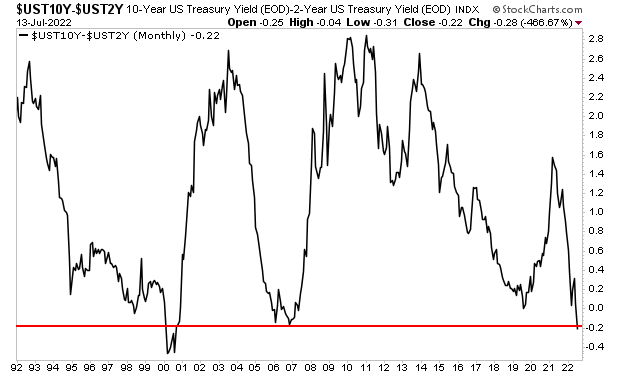
The Treasury yield curve has just inverted. The yield curve is comprised of comparing the yields on various bonds. One of the most common ones used for economic predictions is the 2s10s: what you get when you subtract the yield on the 2-Year Treasury from the yield on the 10-Year Treasury.
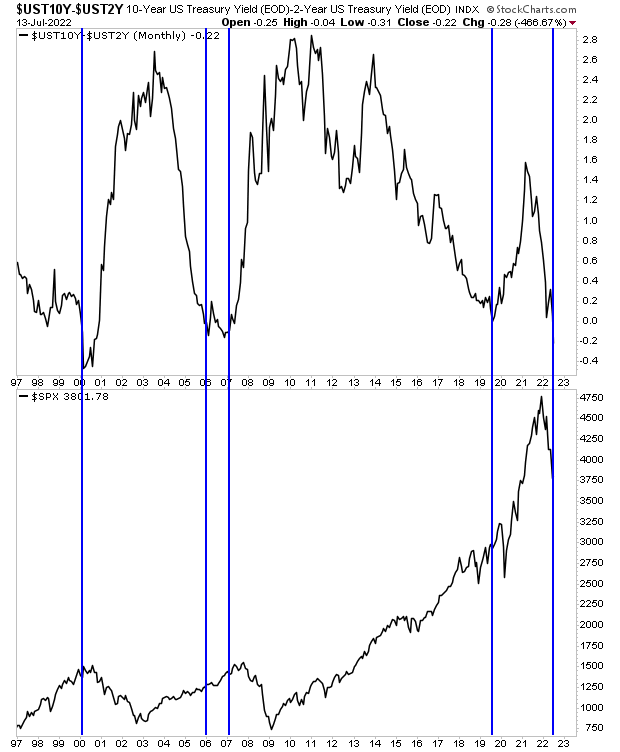
Whenever the yield on the 2-Year Treasury exceeds that of the 10-Year Treasury, the yield curve is inverted. This ONLY happens before a recession. And right now, it is more inverted than at any point since the year 2000.
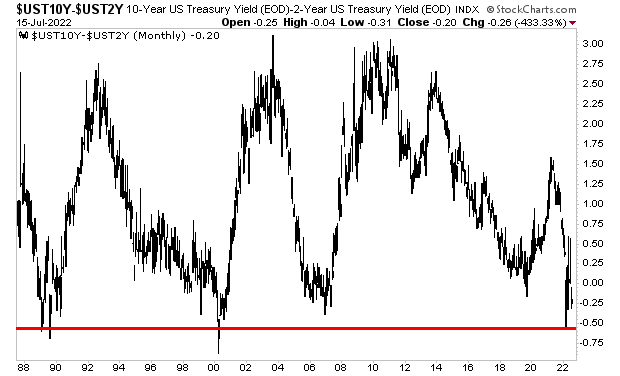
In simple terms, a recession is coming and coming soon.
What does this mean for stocks?
I’ll detail that in tomorrow’s article. In the meantime, if you’re looking to prepare and profit from what’s coming, our Stock Market Crash Survival Guide can show you how.
Within its 21 pages we outline which investments will perform best during a market meltdown as well as how to take out “Crash insurance” on your portfolio (these instruments returned TRIPLE digit gains during 2008).
To pick up your copy of this report, FREE, swing by:
https://phoenixcapitalmarketing.com/stockmarketcrash.html