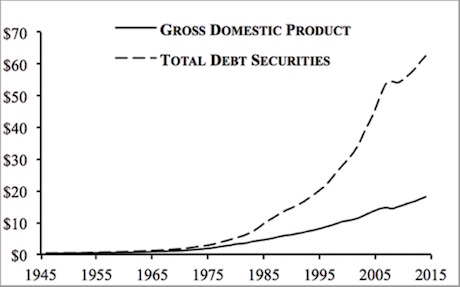
The single most important chart for understanding the current state of the US financial system is the following:
US Gross Domestic Product vs. US Total Debt Securities, Trillions US Dollars (1945-2016).
Note: Data adapted from Federal Reserve Bank of St. Louis (2017).
In simple terms, the above chart reveals that once the US abandoned the Gold Standard completely in 1971, the amount of debt in the US financial system skyrocketed relative to the real economy.
As a result of this, by the time the mid-1990s rolled around, debt levels in the US financial system had become a systemic risk: with this much leverage in the system, even a brief bout of debt deflation (when debt markets deflate) would induce a systemic crisis.
If you don’t believe me, consider that the Great Financial Crisis of 2008, the one during which everyone thought the world was ending, was the small “dip” in the dashed line in the chart above.
Because of this, the US Central Bank, called the Federal Reserve or “the Fed,” has resorted to intentionally creating bubbles in various asset classes in order to keep the financial system solvent.
There’s one big problem with this however.
Asset bubbles ALWAYS burst, triggering crises.
As a result of this, with each success boom and bust, the Fed is forced to engage in more and more extreme monetary policies to prop up the financial system.
Most recently, in response to the Great Financial Crisis of 2008, the Fed cut interest rates to ZERO and held them there for seven years (Zero Interest Rate Policy of ZIRP). It also printed over $3.5 trillion in new money that it then used to buy various assets from the large banks via Quantitative Easing (QE) programs.
The purpose of these policies was to create a bubble in US sovereign bonds, also called Treasuries.
These bonds are the senior most asset class in the US financial system, representing the “risk free” rate against which ALL risk assets are priced. So when the Fed created this bubble, it literally created a bubble in EVERYTHING.
This represents the proverbial Endgame for the Fed; when the Everything Bubble bursts, there isn’t a more senior asset class for it to use to create the next bubble.
So when the Everything Bubble bursts, the Fed will be forced to engage in truly EXTREME monetary policy as it attempts to RE-flate this bubble in bonds.
What’s coming will take time for this to unfold, but as I recently told clients of my Private Wealth Advisory report, we’re currently in “late 2007” for the coming crisis.
On that note, we are putting together an Executive Summary outlining all of these issues as well as what’s to come when The Everything Bubble bursts.
It will be available exclusively to our clients. If you’d like to have a copy delivered to your inbox when it’s completed, you can join the wait-list here:
https://phoenixcapitalmarketing.com/TEB.html
Best Regards
Graham Summers
Chief Market Strategist
Phoenix Capital Research


