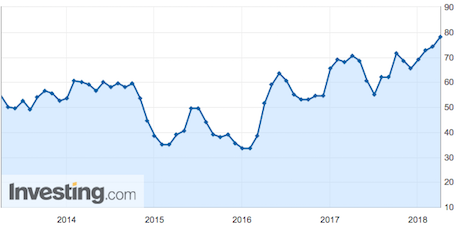
The Prices Paid Index just rose for its fourth straight month to 78.1: its highest level since April 2011.
Why does this matter?
Because it’s a MAJOR warning that inflation is coming.
You see, when inflation hits, it doesn’t hit all at once. Instead it rolls out into the economy in stages.
The first stage occurs at the “production” level of the economy. In this stage, managers at large manufacturers/production companies will see a spike in the cost of goods and services they buy in order to supply their firms.
This cost is measured by the Prices Paid Index. Below is a chart from Investing.com which shows this metric. The trend here is obvious: UP.
Initially, corporations will “eat” these increased costs by continuing to sell their goods and services at the same prices (despite the fact that their costs are increasing).
However, if the Prices Paid Index continues to rise, eventually corporations are FORCED to rise prices on the goods and services they sell.
THAT’s when inflation starts appearing on the retail side of the economy in the price consumers pay for things.
By the look of things, we’re already there. As I noted yesterday, several of the Fed’s OWN in-house inflation measures are roaring.
- The New York Fed’s UIG inflation measure is currently clocking in at 3.06%.
- The Atlanta Fed’s “sticky” inflation measure is growing at an annualized rate of 2.2%.
- Even the Fed’s heavily massaged Personal Consumption Expenditures (PCE) metric is growing at 1.8% on an annualized basis, only slightly below the Fed’s so-called target rate of 2%.
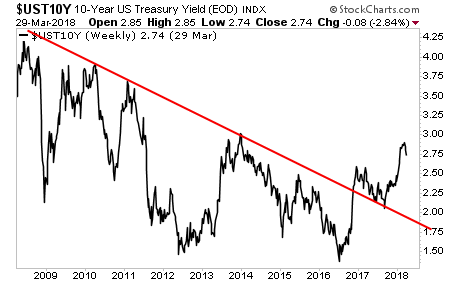
Even worse, the bond market has picked up on this. The yield on the 10-Year Us Treasury (the most important bond in the world.
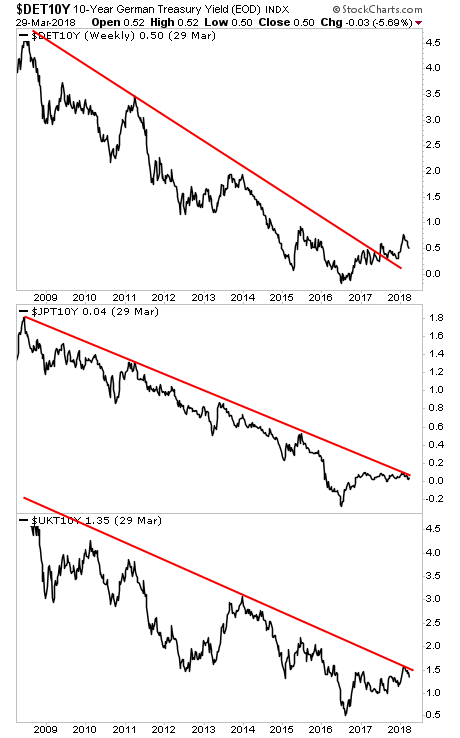
This is not an isolated issue either..
The yields on the 10-Year German Bund, 10-Year Japanese Government Bond, and 10-Year UK Gilt are all rising to test their long-term downtrends.
If these trendlines break (as I expect they will in the coming weeks) it will mark the beginning of the end for The Everything Bubble.
All told, there is over $199 trillion in debt outstanding and an additional $500+ trillion in derivatives trading based on these bond yields.
So when this bubble bursts (as all bubbles do) we will experience a crisis many magnitudes worse than 2008.
Suffice to say, the opportunity to make MASSIVE gains from this trend is HUGE.
On that note, we are putting together an Executive Summary outlining all of these issues as well as what’s coming down the pike when the Everything Bubble bursts.
It will be available exclusively to our clients. If you’d like to have a copy delivered to your inbox when it’s completed, you can join the wait-list here:
https://phoenixcapitalmarketing.com/TEB.html
Best Regards
Graham Summers
Chief Market Strategist
Phoenix Capital Research


