Traders continue to act as though the market is just “correcting” and that we will soon be running to new all-time highs.
That is NOT going to happen. It’s too late for that. The Fed screwed up, and we are already in a bear market.
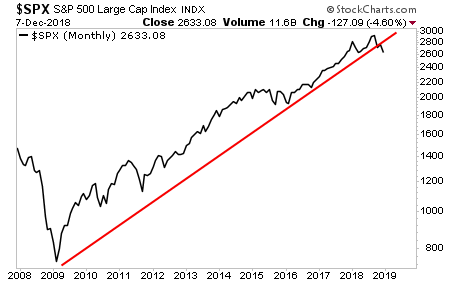
The S&P 500 has broken its bull market trendline on a monthly basis.
This has only happened TWO times in the last 25 years. I’ve labeled them on the chart below. You can see what followed.
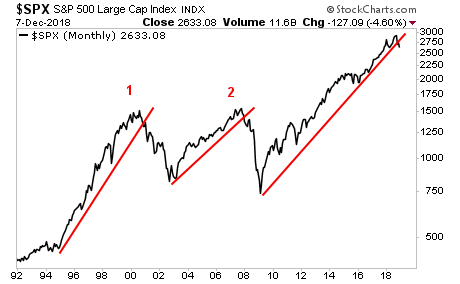
Put another way, EVERY SINGLE TIME this has happened in the last 25 years, the bull market was OVER and a crisis was about to hit.
So what is the crisis this time?
In the ’90s it was the bubble in Tech Stocks.
In the early ’00s it was the bubble in housing.
Today it’s the bubble in DEBT… specifically, sovereign bonds.
And it’s about to go systemic.
Floating rate bonds have already imploded.
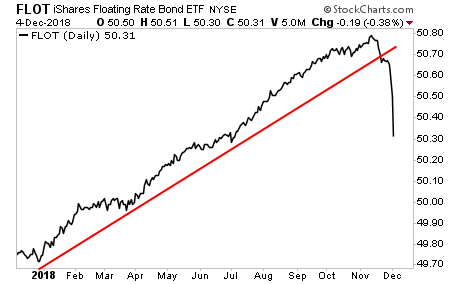
The contagion is now spreading to high yield corporate bonds (the lifeblood for the stock market).
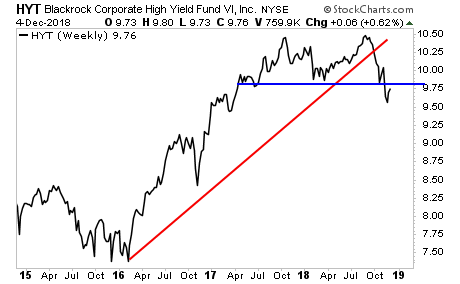
As I recently told clients, if you’re looking for a template for what’s coming… the October meltdown was a “Bear Stearns” moment.
Next comes the “Lehman” moment… at which point we get the panic. It’s no longer a question of IF we CRASH, it’s now a question of WHEN.
If you are not already preparing for this, NOW is the time to do so.
On that note we just published a 21-page investment report titled Stock Market Crash Survival Guide.
In it, we outline precisely how the crash will unfold as well as which investments will perform best during a stock market crash.
Today is the last day this report will be available to the public. We extended the deadline based on yesterday’s sucker rally, but this it IT… no more extensions.
To pick up yours, swing by:
https://www.phoenixcapitalmarketing.com/stockmarketcrash.html
Best Regards
Graham Summers
Chief Market Strategist
Phoenix Capital Research


