The next downturn is now here.
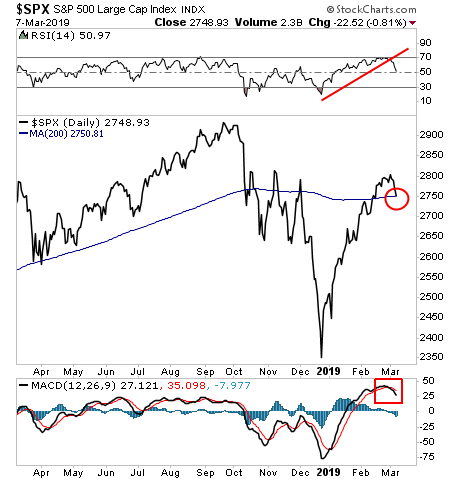
As I warned earlier this week, momentum has turned downward, with the MACD signal on a “SELL” for the first time since December. Even worse, the all important 200-day moving average (DMA) was violated to the downside.

The question now is just how far the markets will fall.
————————————————-
Who said getting rich from trading was hard?
Since inception in 2015, this trading system has produced average annual gains of 41%.
And it’s doing this with just one trade once per week. In fact we just closed a 12% gain last week.
We are closing the doors on this system to new clients on Friday this week.
To lock in one of the last slots…
————————————————-
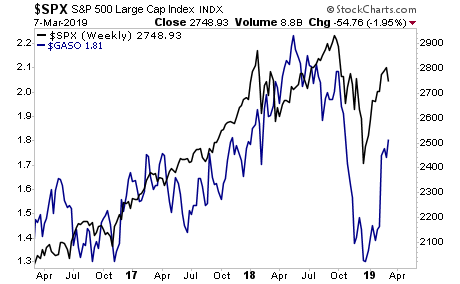
Gasoline tells us that economic realities are down near 2,600 on the S&P 500.

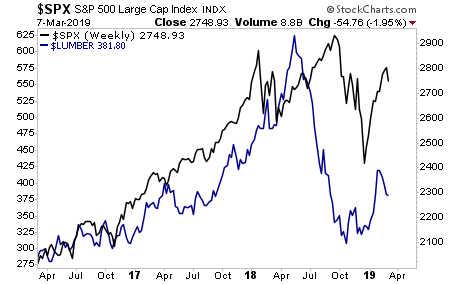
Lumber paints a much uglier picture down near 2,300.

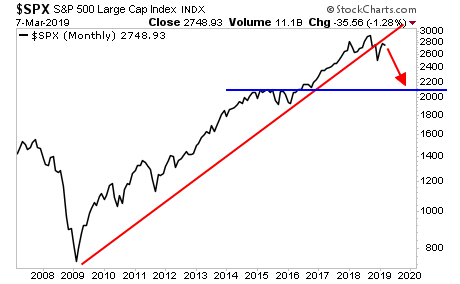
Unfortunately, both might be underestimating the REAL risks. The fact is that the long-term monthly S&P 500 chart shows a CLEAR rejection at its former bull market trendline. There’s really not much but air between here and 2,050 or so on the S&P 500.

If you aren’t actively taking steps to prepare for this, you need to start NOW.
On that note, we are putting together an Executive Summary outlining all of these issues as well as what’s coming down the pike when the Everything Bubble bursts.
It will be available exclusively to our clients. If you’d like to have a copy delivered to your inbox when it’s completed, you can join the wait-list here.
https://phoenixcapitalmarketing.com/TEB.html
Best Regards
Graham Summers
Chief Market Strategist
Phoenix Capital Research


