The bond market is telling us, that the markets… and the economy… are both in very serious trouble.
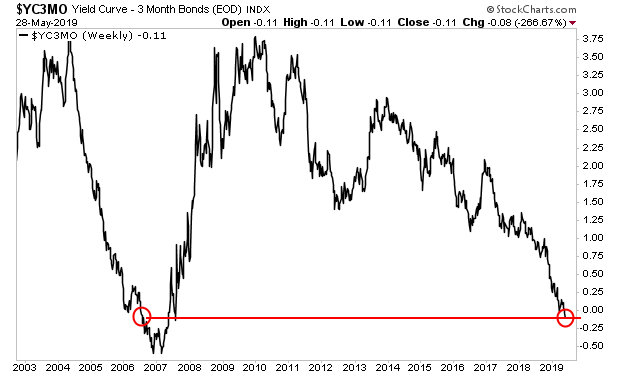
The difference between the yield on the 3-month Treasury and the 10-year Treasury (called the yield curve) is inverted.
What this means is that yield on the 10-Year Treasury is LOWER than the yield on the 3-month Treasury… this ONLY happens when investors get panicked about the near-term… and flock to long-term Treasuries as a safe haven.

What could happen to trigger such an event?
Well, the last time the yield curve hit these levels at the end of a business cycle was in late 2006… right as the housing market rolled over… and the US began its move into the worst recession in decades.
Indeed, an inverted yield curve is almost always a warning that the economy is moving into a recession.
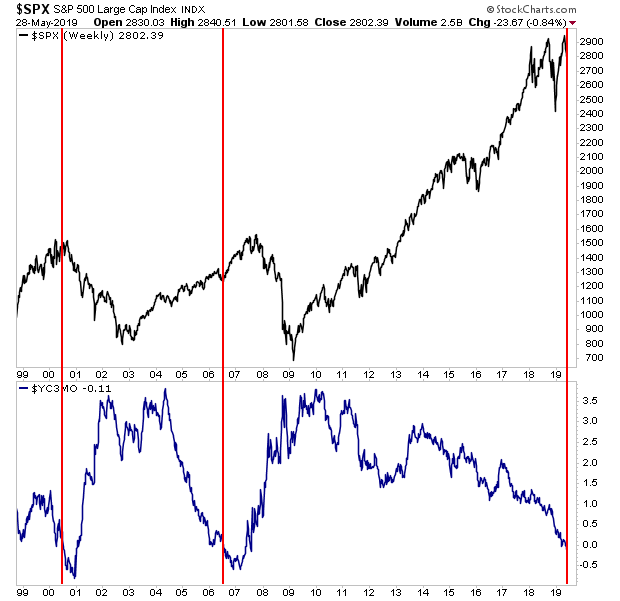
The stock market is usually quick to follow. The last two times the yield curve inverted like this were March 2000… right when the Tech Bubble burst… and late 2006… right as the housing bubble burst… and about 12 months before the Great Financial Crisis…

Put in simple terms, the bond market is telling us: a Crash is coming… either right now… or in the near future…
On that note, we are already preparing our clients for this with a 21-page investment report titled the Stock Market Crash Survival Guide.
In it, we outline the coming collapse will unfold…which investments will perform best… and how to take out “crash” insurance trades that will pay out huge returns during a market collapse.
As I write this, there are only 11 copies left.
To pick up one of the last remaining copies…
https://www.phoenixcapitalmarketing.com/stockmarketcrash.html
Best Regards
Graham Summers
Chief Market Strategist


