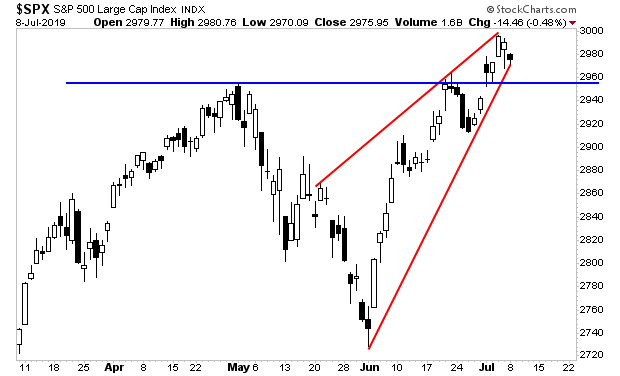
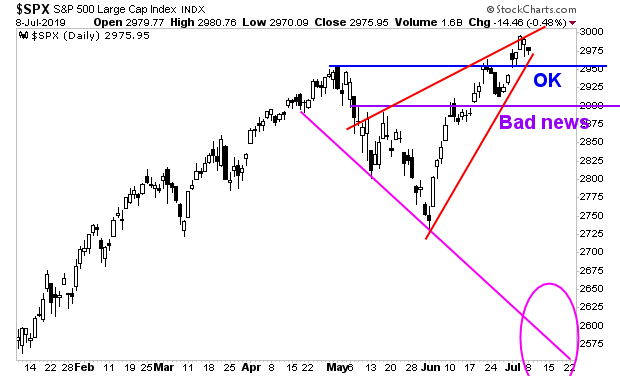
Stocks are breaking down from their rising bearish wedge (red lines in the chart below) as I write this.
The key now is whether or not the market breaks support at 2,955 (blue line in the chart below).

In simple terms, if we hold the blue line, things are OK. If we don’t, it’s bad news we go to the purple line. If that doesn’t hold, then buckle up, the pink line is in play.

BE READY!
On that note, we are already preparing our clients for this with a 21-page investment report titled the Stock Market Crash Survival Guide.
In it, we outline the coming collapse will unfold…which investments will perform best… and how to take out “crash” insurance trades that will pay out huge returns during a market collapse.
Today is the last day this report will be available to the general public.
To pick up one of the last remaining copies…
https://www.phoenixcapitalmarketing.com/stockmarketcrash.html
Best Regards
Graham Summers
Chief Market Strategist
Phoenix Capital Research


