On Friday the markets broke down.
However, given how negative the news was that day, it is quite telling that the collapse was relatively muted.
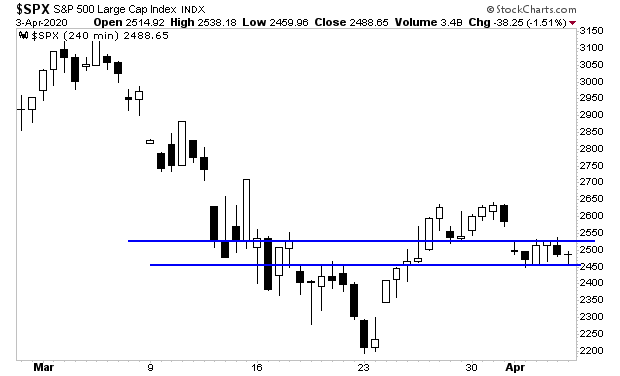
The S&P 500 did break initial support (first blue line) but managed to hold secondary support (second blue line). Given that Dr. Fauci of the NIH suggested a national “stay at home” order on Friday, you’d expect a bigger breakdown here.
The other positive development concerns the Volatility Index or VIX.
———————————————————–
Get a LIFETIME Subscription to All Of Our Products For Just $2,500
An annual subscription to all of our current newsletters costs $1,500.
But today, you can get a LIFETIME subscription to ALL of them, along with every new product we ever launch, for just $2,500.
Today is the last day this offer is available.
To lock in one of the remaining slots…
———————————————————–
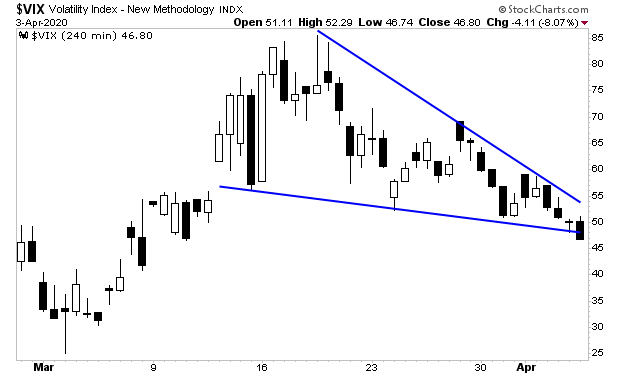
Typically, the VIX rallies when stocks breakdown… which is why it’s odd that the VIX FELL on Friday despite stocks dropping.
What’s even more strange is the VIX actually peaked March 19th and has been in a downtrend ever since. The VIX is a much more complicated investment instrument than the stock market. Is the VIX telling us that the bottom is in?
On that note, if you’re worried about weathering a potential market crash, we’ve reopened our Stock Market Crash Survival Guide to the general public.
Within its 21 pages we outline which investments will perform best during a market meltdown as well as how to take out “Crash insurance” on your portfolio (these instruments returned TRIPLE digit gains during 2008).
To pick up your copy of this report, FREE, swing by:
http://phoenixcapitalmarketing.com/stockmarketcrash.html
Best RegardsParagraph
Graham Summers
Chief Market Strategist
Phoenix Capital Research
