Ever since stocks bottomed on March 23rd, the big question has been:
Can the Fed negate the economic damage caused by the shutdown by throwing trillions of dollars at the financial system?
The market is beginning to show us.
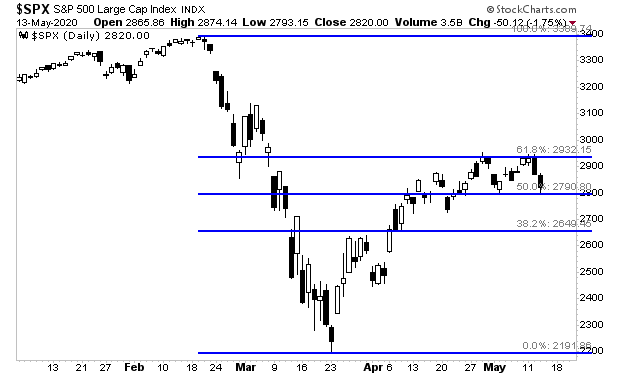
I’ve mentioned time and again that the 61.8% retracement of the March meltdown is key to the market entering a new bull market. If it can break above this line, we’re in a new bull market. If it can’t then the entire rally was just a bear market bounce.
With that in mind, note that stocks have failed to break above this level twice now. Each time it has failed we’ve had a ~5% correction.
Does this mean the top is in? Why bother trying to predict that? Let’s focus on the what the markets are actually telling us instead of trying to be psychic!
The key lines of support for the S&P 500 are draw on the chart below.
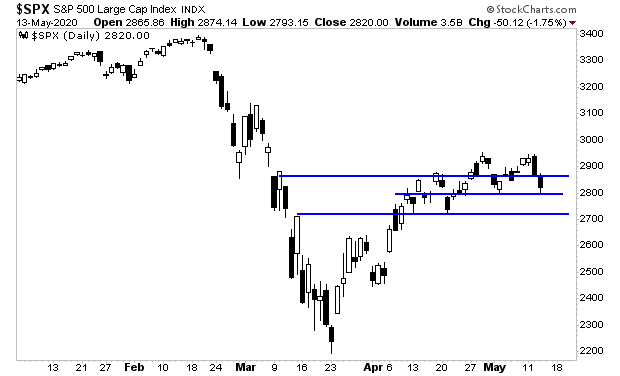
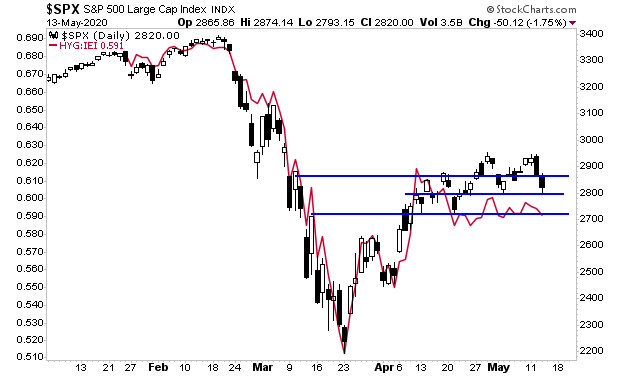
As I write this Thursday morning, stocks are attempting to hold 2,800. If that line goes, the next real support level is 2,730.
This is also where high yield credit suggests stocks are heading.
Again, remember your levels, and ignore the financial media. They operate based on emotions and will lose you money.
If you’re sick of narratives and want to focus on how to actually make money from the markets, join our FREE e-letter Gains Pains & Capital.
https://gainspainscapital.com/
Graham Summers
Chief Market Strategist
Phoenix Capital Research
