Stocks have fallen hard over the weekend again. The media is pinning this drop on the potential for another COVID-19 pandemic, but the facts don’t support that theory.
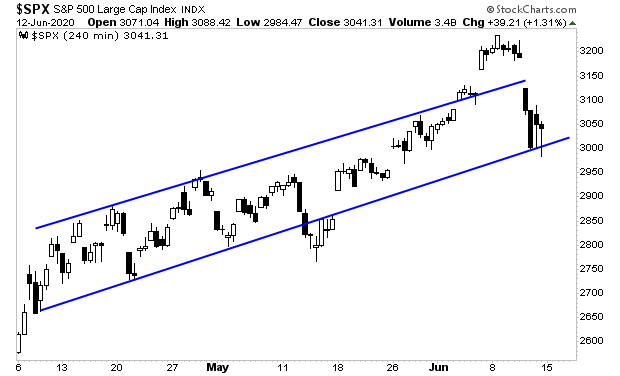
At times like these, it’s essential to ignore narratives, and focus on price. With that in mind, the S&P 500 remains in an uptrend, barely (blue lines in the chart below). Stocks need to hold here for the bull market case to remain intact.
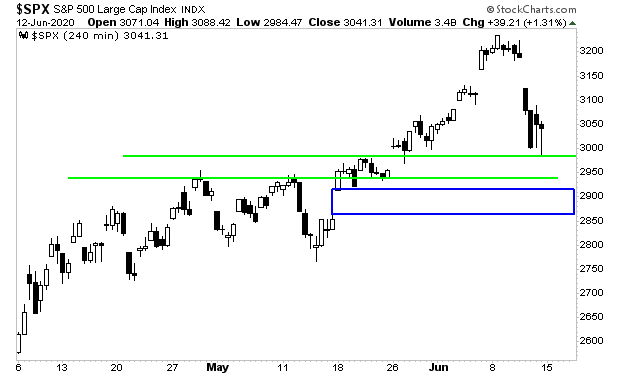
If stocks break down from here, there are two items in play. One is support at 2,940 (lower green line in the chart below). The other is the gap established by the open on May 18th (blue rectangle in the chart below).
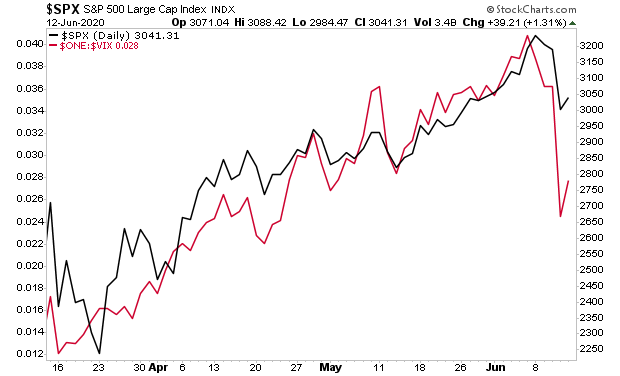
When we plot the S&P 500 against the VIX (inverted), it looks like there’s more downside to go here.
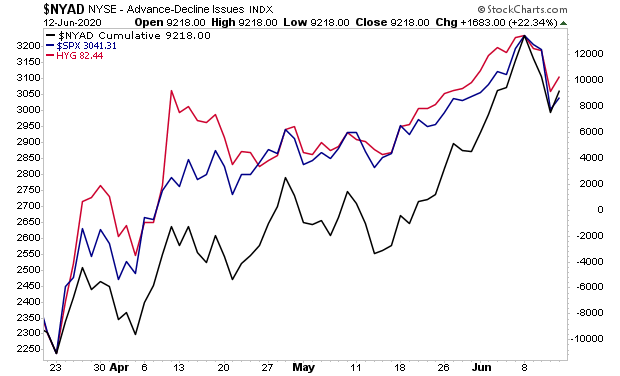
However, both breadth and credit suggest the downside is limited here.
My point with all of this is that today the market is literally a crap shoot. The easy money from the rally has been made, and the next trend is not clear yet. So now is NOT the time to be putting a load of capital to work.
However, if stocks don’t hold here, we could potentially see a crash down to 2,700.

That is a high reward type move. And one we need to consider.
In light of this, we’ve reopened our Stock Market Crash Survival Guide to the general public.
Within its 21 pages we outline which investments will perform best during a market meltdown as well as how to take out “Crash insurance” on your portfolio (these instruments returned TRIPLE digit gains during 2008).
There are only 33 copies available to the public.
To pick up your copy of this report, FREE, swing by:
http://phoenixcapitalmarketing.com/stockmarketcrash.html
Best Regards
Graham Summers
Chief Market Strategist
Phoenix Capital Research


