Stocks are down this morning.
We are due for a retrenchment. Stocks have just staged a breakout to the upside from a triangle formation (blue lines in the chart below). This breakout has brought stocks right into overhead resistance (red line in the chart below). So it’s not strange to see stocks drop here.
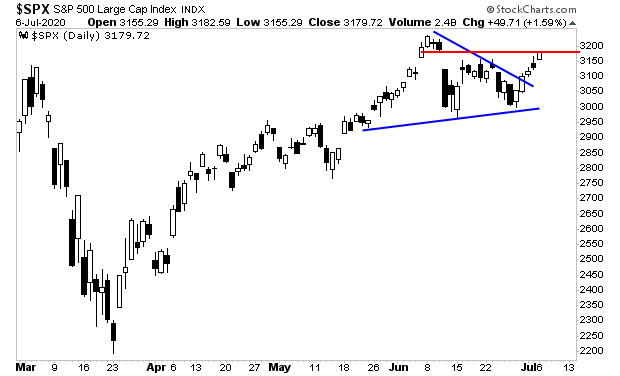
It is perfectly normal to see stocks drop to retest the breakout. The question is how far do they drop… and is this a buying opportunity or not?
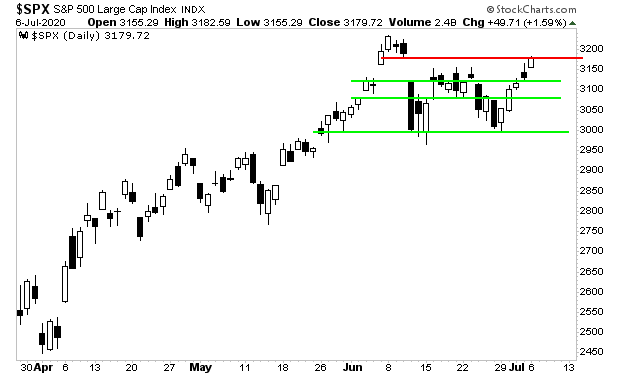
Regarding the first half of that question, I’ve drawn the major lines of support in the chart below (green lines). As I write this Tuesday morning, stock futures are already testing the top green line at 3,148.
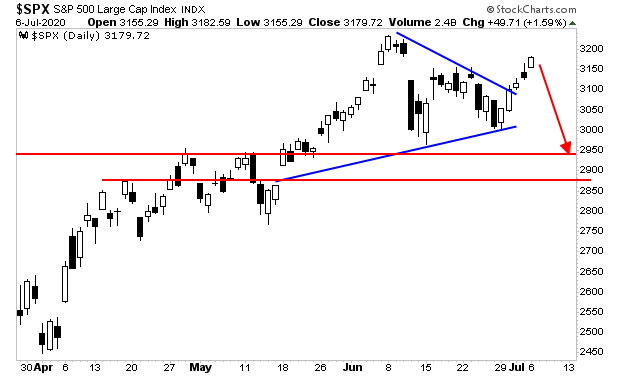
The larger concern is that the upwards breakout didn’t see stocks hit new highs. This opens the door to this being a false breakout. And false breakouts typically lead to sharp violent moves in the opposite direction.
If this proves to be the case, we could easily see stocks drop to test 2,950 or even 2,880 on the S&P 500. That would mean an 8%-10% for the S&P 500 (red lines in the chart below).
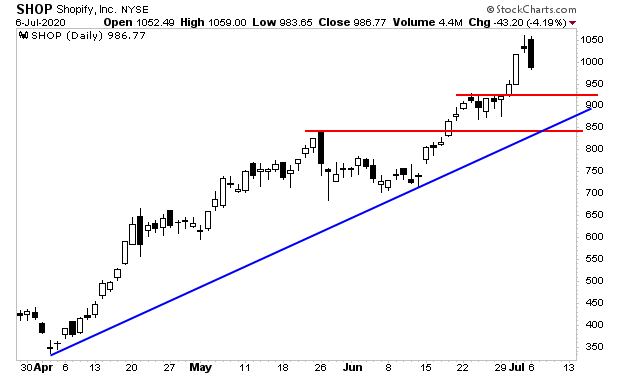
However, the drop would likely feel MUCH worse for many stocks. Take a look at high flying momentum stock Shopify (SHOP) to see what I mean. It’s already down 4% in a single day and the next lines of support are either a 12% drop or a 20% drop.
In light of this, we’ve reopened our Stock Market Crash Survival Guide to the general public.
Within its 21 pages we outline which investments will perform best during a market meltdown as well as how to take out “Crash insurance” on your portfolio (these instruments returned TRIPLE digit gains during 2008).
To pick up your copy of this report, FREE, swing by:
http://phoenixcapitalmarketing.com/stockmarketcrash.html
Best Regards
Graham Summers
Chief Market StrategistParagraph
Phoenix Capital Research
