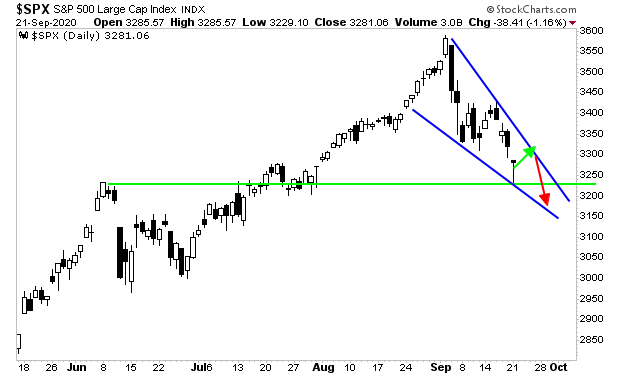
Stocks dropped to the lower level of support (green line in the chart below) I pointed out in yesterday’s missive. They then bounce hard in the intraday session, closing near the highs of the day.
We now have the beginnings of a bullish falling wedge formation (blue lines in the chart below). We should see a move higher to 3,350 or so, before the final drop to perhaps 3,200.
Something like this:
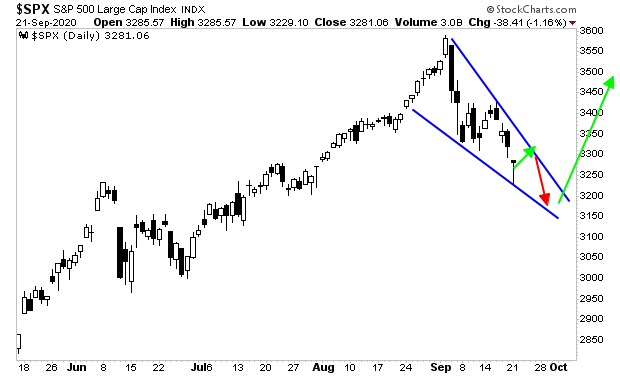
This conforms with my roadmap for the remainder of September: a sideways/ chop fest that favors the downside, before stocks begin their next major leg up in October.
Something like this:
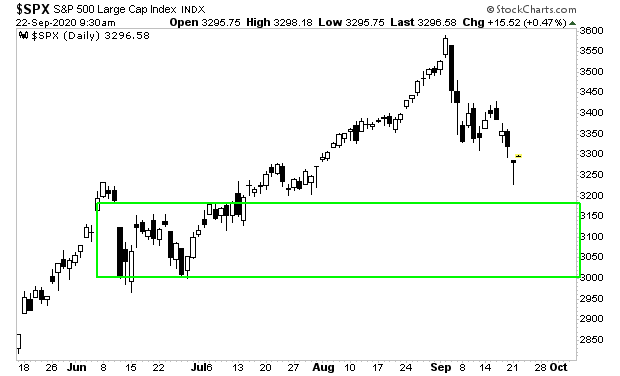
Indeed, anything in this box is a BUY WITH BOTH HANDS for the long-term (not a day trade). We’ll likely be there in the next two weeks.
If you’re looking for this kind of precise guidance on how to trade the markets, I strongly urge you to join our FREE daily e-letter, Gains Pains & Capital. You’ll immediately start receiving our market missives delivered to your inbox every morning.
To do so, go to: https://gainspainscapital.com/
Best Regards
Graham Summers
Chief Market Strategist
Phoenix Capital Research
