Yesterday, I explained why I believe we are due for a period of below average stock market returns.
By quick way of review:
- Inflation is roaring higher. Official inflation measures put it at over 5%. Unofficial, more accurate measures have it clocking in at over 8%. And we are seeing corporations raise prices to deal with this.
- Inflation is NOT good for stocks. During the last major bout of inflation in the 1970s, stocks initially ripped higher for a few years before crashing ~50% erasing all their gains and then some. Even worse, the stock market finished the decade having gained ZERO in 10 years.
- The stock market is now extremely overstretched to the upside. On a monthly chart, the market is 40% above its 50-month moving average (MMA). The only time it has been more stretched above this line was right before the 1987 crash and during the Tech bubble.
So now the big question is… how do we profit from the inevitable collapse?
One method of doing this is the UltraShort S&P 500 ETF (SDS).
SDS was a leveraged play on the U.S. stock market collapsing.
You see, the SDS returns TWO TIMES the inverse of the S&P 500 ETF (SPY).
So, if the SPY falls 5%… the SDS returns 10%. Etc.
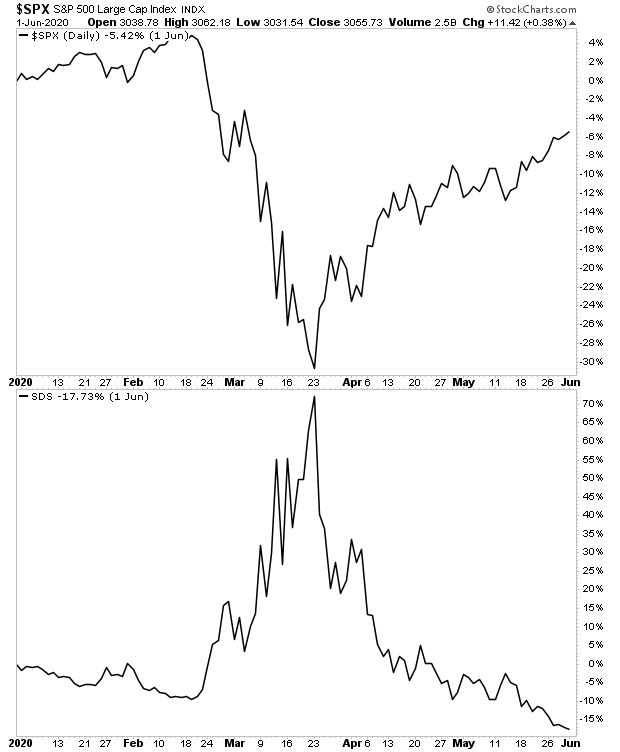
During market meltdowns, SDS is a great means of profiting from stocks collapsing. The below chart shows how it performed during the 2020 meltdown. Note SDS (bottom box) skyrocketed over 70% while the S&P 500 dropped some 30% in the month of March 2020.

However, I want to be clear here, DO NOT go out and buy this investment right now. SDS is a TRADE, not a long-term investment. Put another way, SDS ONLY works when the market is melting down. So, if you buy it at any other time, you’ll lose money.
So how do we know when the market is going to melt down?
To do that, I rely on certain key signals that flash before every market crash.
I detail them, along with what they’re currently saying about the market today in a Special Investment Report How to Predict a Crash.
To pick up a free copy, swing by
https://phoenixcapitalmarketing.com/predictcrash.html


