By Graham Summers, MBA
Was it a dead cat bounce… or something else?
On Monday, the markets were melting down due to fears of contagion from Evergrande, China’s second largest real estate company, going bankrupt.
Since that time, the market has bounced hard… despite the fact nothing has changed about Evergrande, or its $300 billion in debt, or the contagion issues that it presents to the financial system (commodities, EU banks, Australian miners, etc.).
So, the big question for stocks is: was this a dead cat bounce or the start of a new major rally?
Let’s find out.
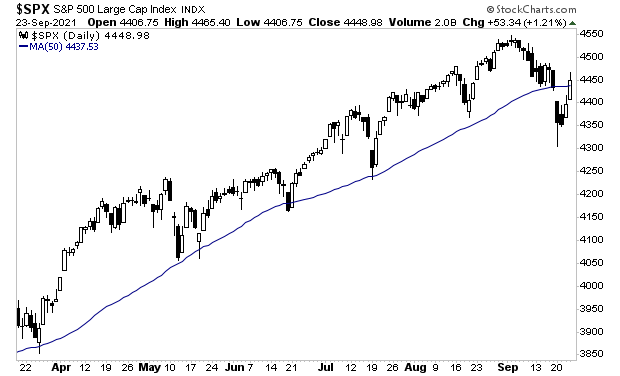
The S&P 500 is attempting to reclaim its 50-day moving average (DMA). As the below chart shows, this line has acted as major support throughout much of 2021. So, the fact we broke below it is significant. If the S&P 500 cannot reclaim this level and stay there… then stocks are in MAJOR trouble.

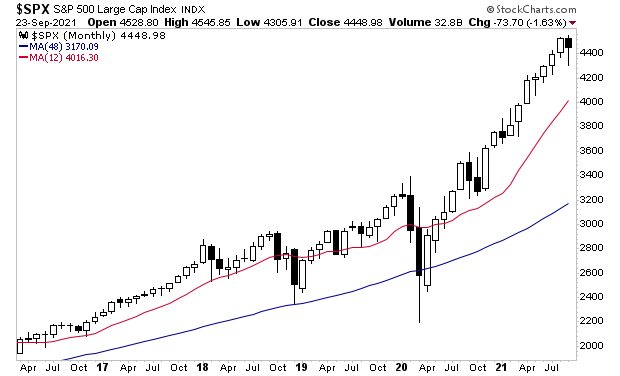
For anyone who understands risk management, the below chart has been a MAJOR concern for the last few months. On a monthly basis, the S&P 500 is EXTREMELY overstretched to the upside. At a minimum, you would expect a drop to the 12-month moving average (MMA) to occur sometime this year.

This would mean a 10% drop in stock prices.
Note in the above chart that every drop to the 12-MMA started with a significant black candle. We’ve got one week left in September, but it looks like we could be getting our first black candle of the year.
However, given that stocks are in their largest bubble of all time by some measures… that leverage levels are obscene, and that we are seeing the kind of mania associated with major tops… smart investors are asking…
“Is a Crisis about to hit?”
To figure this out, I rely on certain key signals that flash before every market crash.
I detail them, along with what they’re currently saying about the market today in a Special Investment Report How to Predict a Crash.
To pick up a free copy, swing by
https://phoenixcapitalmarketing.com/predictcrash.html
Best Regards


