Over the last few weeks, I’ve been outlining the clear evidence that stocks are in a bubble, arguably the largest stock market bubble of all time.
With that in mind, yesterday I asked a critical question…
Are We Setting Up for Another 1987-Type Crash?
It’s often said that you cannot predict a crash.
While predicting the actual day of a crash hitting is impossible, there are certain key warnings that flash before every major crash.
Think of them as BIG warnings, or the FOUR Horsemen that precede a stock market apocalypse.
What are they?
When most heavily weighted companies began to break down badly.
Technically, the S&P 500 is made up of 500 companies. However, each of those 500 stocks don’t receive the same weight from the index. Rather, certain stocks receive a disproportionate weighting giving them a much larger impact on the market’s price action.
Because of this, in order to get a crash, you need the heaviest weighted stocks to break down badly. Put another way, even if most of the 500 companies in the overall market are in a downtrend, if the heaviest weighted stocks DON’T break down, it’s pretty much impossible for the overall market to crash.
So today, let’s review the 1987-Crash: arguably the worst single-day collapse in stock market history.
In 1987, the 10 largest companies by market weight were:
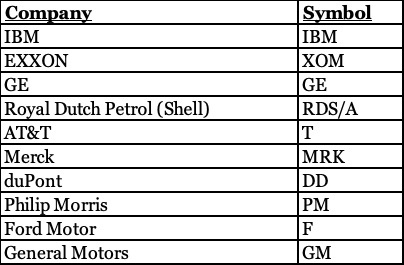
Of these, IBM, XOM, GE and T have charts that are easy to find. So, let’s review them.
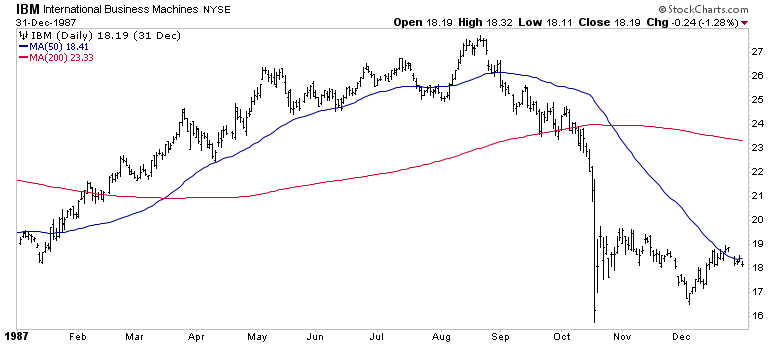
In 1987, IBM had already taken out both its 50-DMA and its 200-DMA before the crash hit. Put another way, the largest company on the index (the equivalent of the tech sector today) had already broken down VERY badly.
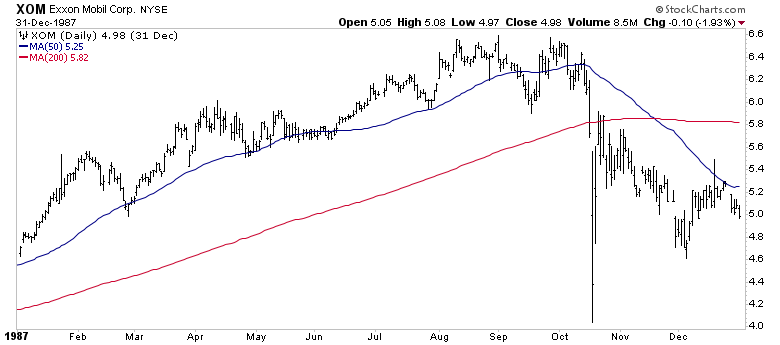
Exxon had yet to look as terrible, but it was clearly struggling, having traded sideways for months before finally breaking down.
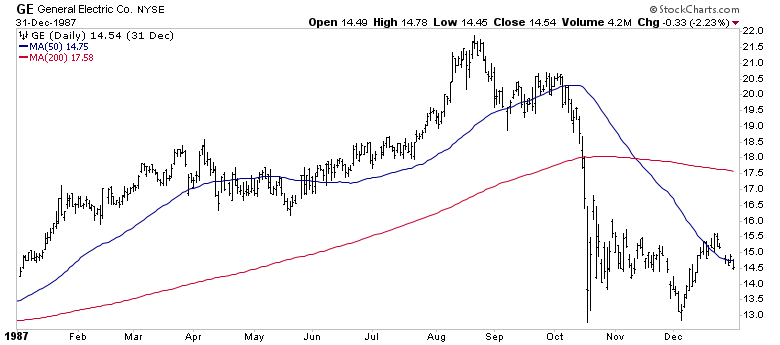
General Electric looked awful, breaking its uptrend and falling below its 50-DMA long before the Crash hit.
AT&T (T) was the only one that looked remotely good, as it was still in something of an uptrend when the crash hit.
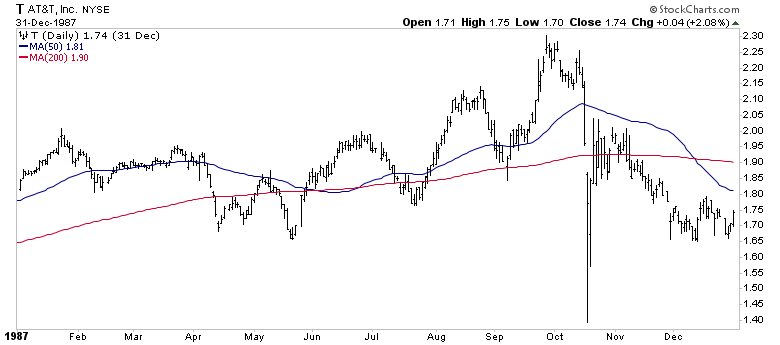
For space reasons, we’re only looking at four of the top 10 companies today. But if you were to look at all 10 charts, you’d quickly see that the majority of them had entered downtrends, and were breaking down badly, weeks before the Crash hit.
But what about the markets today? Are they issuing similar warnings?
To figure this out, I rely on certain key signals that flash before every market crash.
I detail them, along with what they’re currently saying about the market today in a Special Investment Report How to Predict a Crash.
To pick up a free copy, swing by
https://phoenixcapitalmarketing.com/predictcrash.html
Best Regards
