The market is on THIN ice.
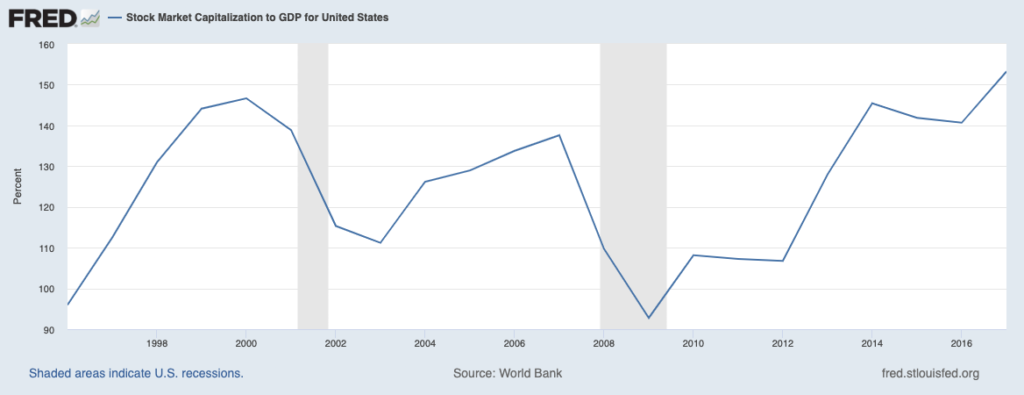
This is the single largest stock market bubble in history. It’s larger than the Tech Bubble in multiple metrics including:
- Market cap/ GDP (Warren Buffett’s favorite metric).
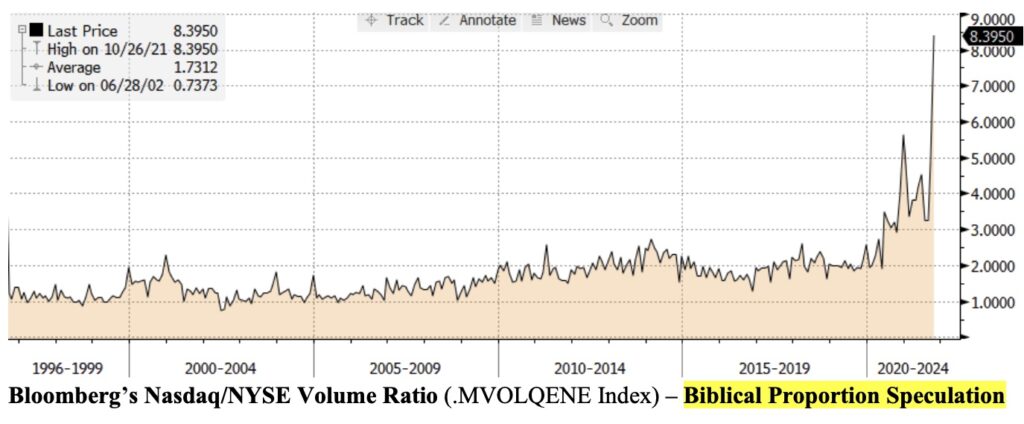
- Options trading volume (a sign of speculation). As Bill King has noted, this is BIBLICAL levels of speculation.
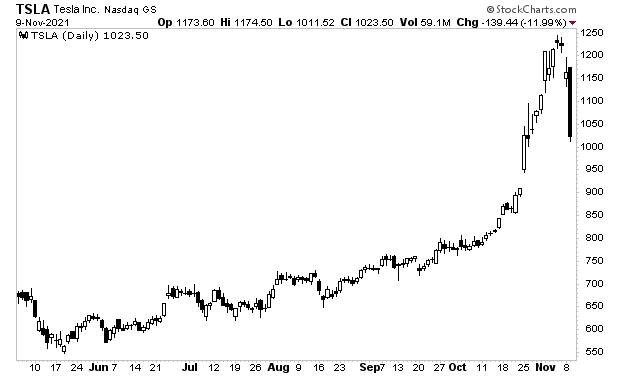
- Tesla (TSLA) a $1 Trillion company (the size Mexico’s GDP) is trading like a penny stock, moving over 10% to the upside or downside on a given day.
Moreover, stocks are stretched some 40% above their 50-month moving average. It’s only been MORE stretched three times in the last 40 years: right before the 1987 Crash and during the Tech Bubble in the late ‘90s.
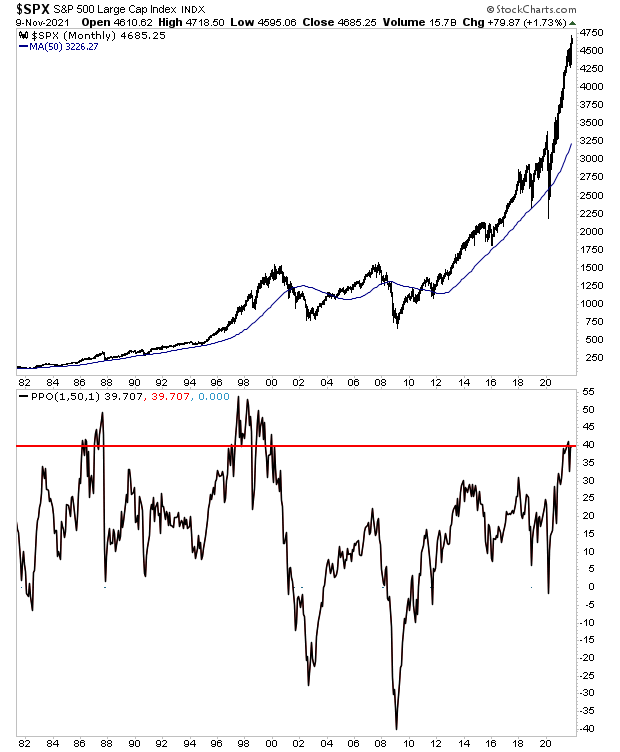
This whole mess is going to come crashing down in spectacular fashion… just as all bubbles do. In chart form, it’s only a matter of time before we experience this:
The big question for investors is… HOW DO WE AVOID THIS?
To figure this out, I rely on certain key signals that flash before every market crash.
I detail them, along with what they’re currently saying about the market today in a Special Investment Report How to Predict a Crash.
To pick up a free copy, swing by
https://phoenixcapitalmarketing.com/predictcrash.html
Best Regards