By Graham Summers, MBA
And there it is: REAL inflation of 9%!
I’ve noted many times in the past that the official inflation measure, the Consumer Price Index, or CPI, is gimmicked to the point of fiction.
The reason for this is simple: this is the number everyone looks at. And if it reflected reality, Americans would realize that “quality of life” in this country has been in decline for the last 40 years as real costs of living have dramatically outpaced the rise in incomes.
Remember, if incomes do not rise at the same pace as inflation, your real cost of living is rising. Ever wonder why back in the 1950s most families got by on one income, while today both parents work and most families have massive mortgages, over $10K in credit card debt, and $50K in student loans?
Wonder no more!
What does this have to do with today?
Well, the official inflation data point, the CPI, claims inflation is at 6.8%. This is a 40 year high. But because CPI is gimmicked to UNDER-state inflation, the REAL rate of inflation is much, much worse.
If you don’t believe me, take a look at the Producer Prices Index (PPI), the CPI’s less known, less watched, but more accurate cousin.
Unlike CPI, which is crafted by bean counters at the government, PPI is based on actual information from actual producers of goods and services who must adjust their costs based on inflation or lose profits in the real economy…
Which is why the latest PPI data point is catastrophically bad, clocking in at 9.6% year over year (YoY) for the month of November.
Yes, 9.6% as in almost double digits.
Suffice to say, the Fed is WAAAAAAAAAYYYY behind the curve on inflation.
How high will the Fed need to raise rates to stop this? 2%? 4%? More?
More importantly for the financial system, how will the mountain of debt that was issued based on interest rates of ZERO, going to react to the Fed tightening monetary conditions.
Some $2 trillion in corporate debt was issued in the U.S. last year alone. The U.S. Government issued another $5+ trillion. So right off the bat, you’ve got $7+ trillion in debt that was issued while rates were effectively at zero.
How is this going to adjust to rates at 1%? 2%? Higher?
For bonds with yields this low, every time the Fed raises rates, there is a dramatic impact. Remember, the yield on U.S. Treasuries represent the “risk free” rate of return against which the entire financial system is valued.
So, when the Fed raises rates, that $7+ trillion must adjust accordingly. This means those bond prices FALL and their yields RISE. And if they rise enough, the investors begin to default.
And we’re just getting started here.
As Lawrence McDonald recently noted, globally there is $30+ TRILLION MORE debt with sub-2% yields than there was the last time the Fed attempted to raise rates.
How is all that debt going to handle higher rates? What if the Fed has to raise rates way over 2% to stop inflation? What happens to the mountain of debt that was created BASED on yields being at 0%?
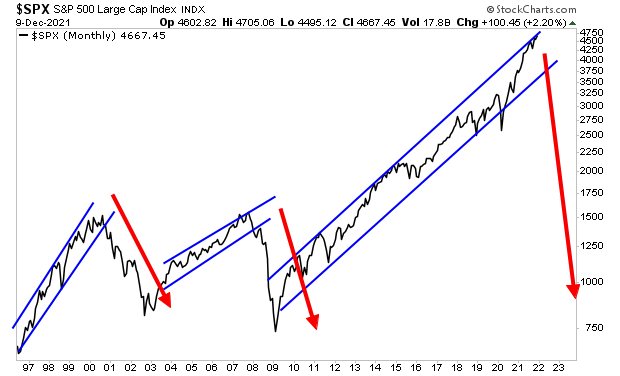
If you think the Fed can navigate this successfully, I would like to point out that the Fed wasn’t able to deflate the Tech Bubble nor the Housing Bubble without creating full-scale crises.
What are the odds the Fed can successfully deflate this current Everything Bubble… which is exponentially larger than the first two?
Look at the below chart and you tell me.

For those looking to prepare and profit from this mess, our Stock Market Crash Survival Guide can show you how.
Within its 21 pages we outline which investments will perform best during a market meltdown as well as how to take out “Crash insurance” on your portfolio (these instruments returned TRIPLE digit gains during 2008).
To pick up your copy of this report, FREE, swing by:
https://phoenixcapitalmarketing.com/stockmarketcrash.html
Best Regards,


