By Graham Summers, MBA
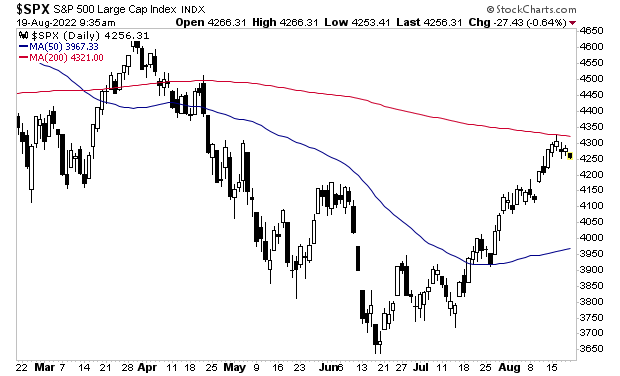
Judging from last week, the bear market rally ended right at the 200-day moving average (DMA) for the S&P 500.
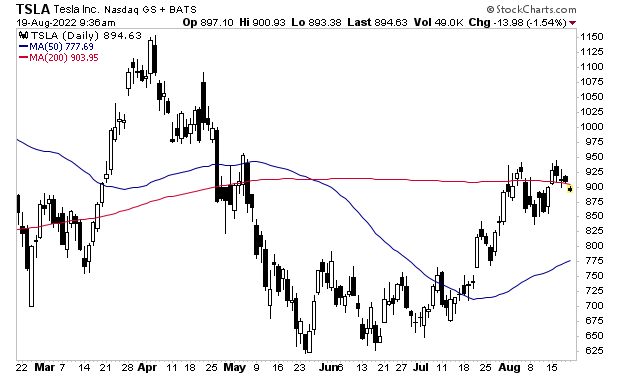
This was right where market leaders such as Tesla (TSLA) had suggested we’d see a top. Indeed, one of the first signs that the market would be topping out was the fact TSLA struggled to remain above its 200-DMA once it initially broke above that line in mid-July.
So where do we go from here?
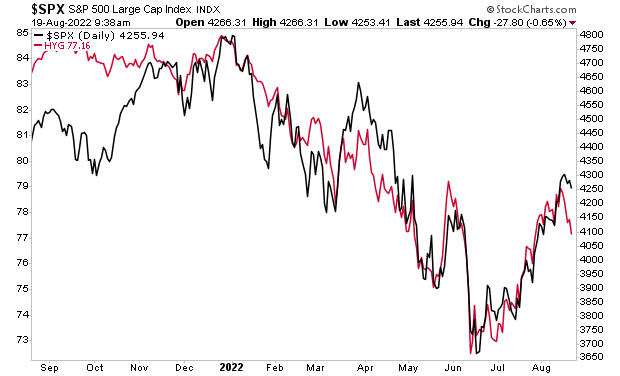
High yield credit, which leads stocks, suggests the S&P 500 is going to 4,100 in the near-term.
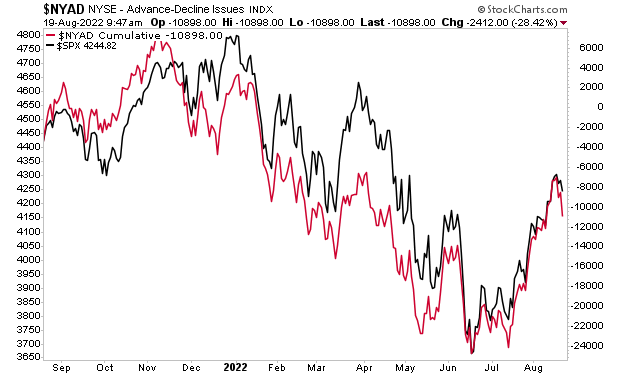
It’s a similar story for breadth, which also leads stocks.
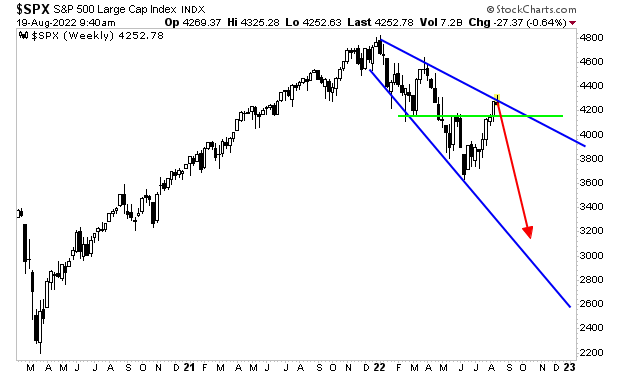
However, if the S&P 500 cannot maintain support (green line in the chart below) around 4,100, things could get UGLY fast.
For those looking to prepare and profit from this mess, our Stock Market Crash Survival Guide can show you how.
We are making just 100 copies available to the general public.
As I write this there are 39 left.
To pick up your FREE copy, swing by:
https://phoenixcapitalmarketing.com/stockmarketcrash.html