By Graham Summers, MBA
The big news this week is that stocks lost their 200-Day Moving Average (DMA) again.
Historically, November and December are two of the most bullish months for stocks. Only April is better from a single month perspective. So, the fact the market was unable to reclaim its 200-DMA and remain there is EXTREMELY bearish.
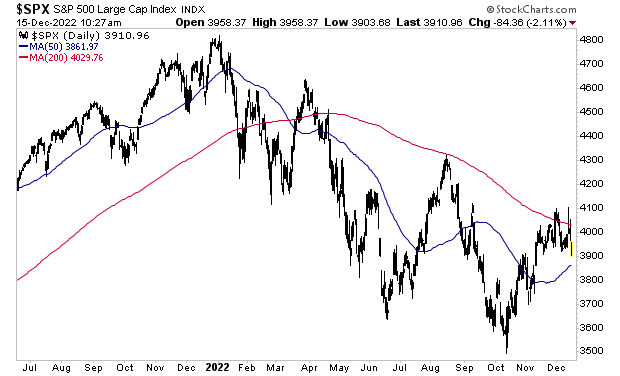
The price action was feeble to say the least.
The bulls have everything going for them: the Fed has reduced the pace of its interest rate hikes, the economy is not yet in recession, and we are in one of the best months for stock market returns: the famed Santa Rally of December.
So the fact that the bulls were unable to get stocks above their 200-DMA indicates that this recent market rally was nothing more than a Bear Market Rally, NOT the start of a new Bull Market.
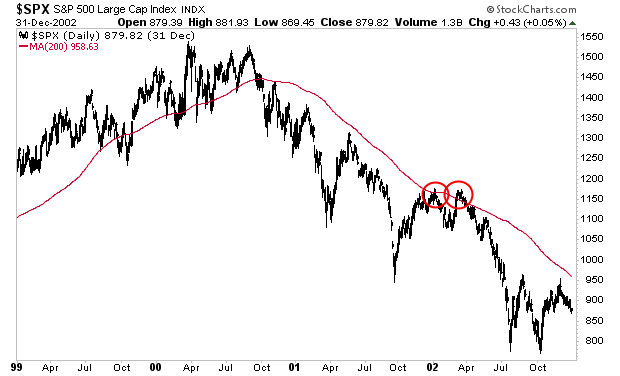
Below is a chart of what happened to stocks when they failed to maintain their 200-DMA during the Bear Market of 2000-2003. I’ve highlighted this in red circles. Stocks dropped another 30%.
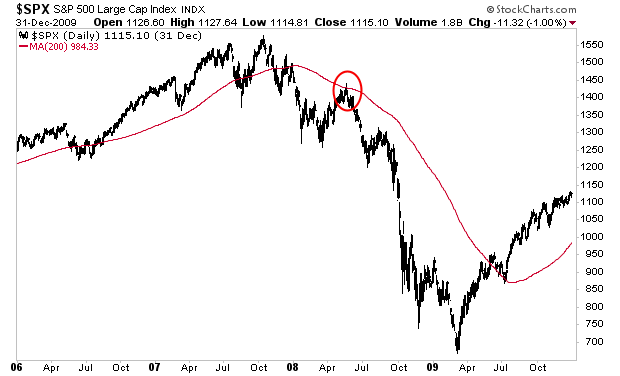
Here’s the same item during the bear market of 2007-2009. This time around stocks lost 50%.
Unfortunately for anyone who is buying into this narrative that stocks are in a new bull market, the bear market is NOT over. With a recession just around the corner, stocks will soon collapse to new lows.
If you’ve yet to take steps to prepare for this, we just published a new exclusive special report How to Invest During This Bear Market.Paragraph
It details the #1 investment to own during the bear market as well as how to invest to potentially generate life changing wealth when it ends.
To pick up your FREE copy, swing by:
https://phoenixcapitalmarketing.com/BM.html