By Graham Summers, MBA
Something MAJOR happened last week for Tech Stocks.
That something?
The NASDAQ failed to reclaim its 200-week moving average (WMA).
See for yourself.
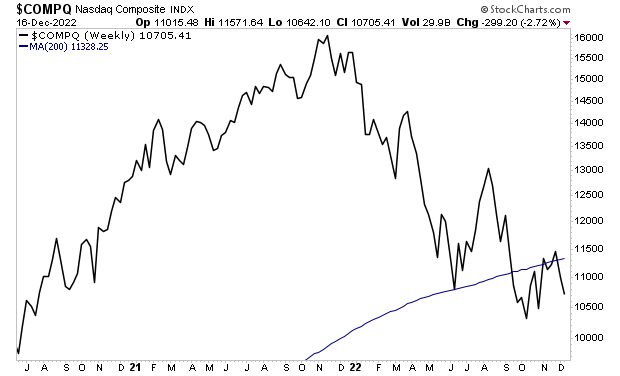
Why does this matter?
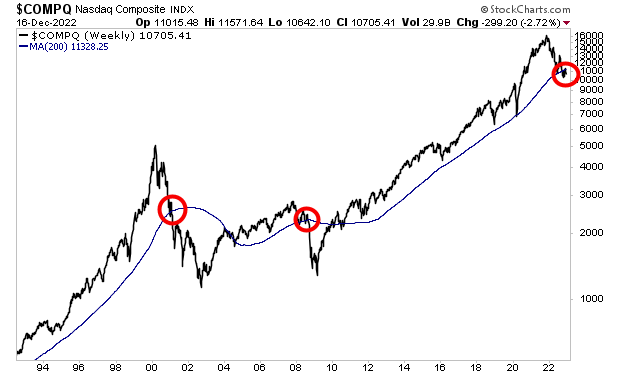
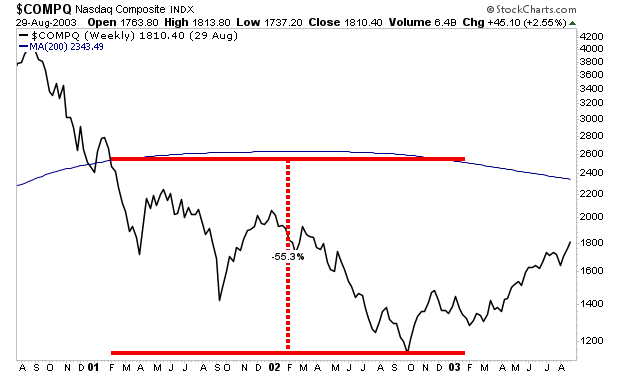
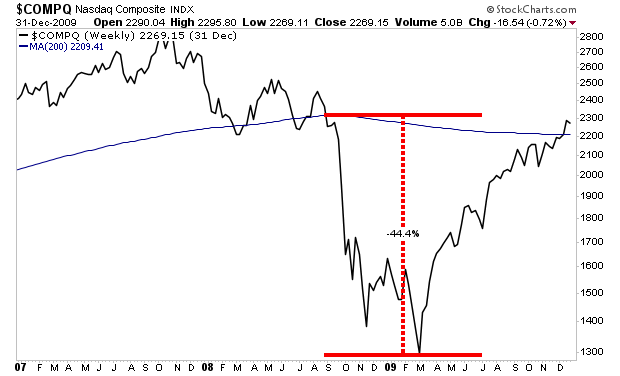
The NASDAQ has only lost its 200-WMA two other times in the last 30 years. Both of these instances (2001 and 2008) were during major bear markets that saw stocks lose an additional 44%-55% of their total value.
I’ve illustrated them in the chart below with red circles. Note that even during the 2020 crash, stocks managed to hold this line.
Not this time.
There is a small chance the bulls might be able to rally here and stop a full-scale collapse. But the clock is ticking.
If they don’t, consider that after the NASDAQ lost its 200-WMA in 2001, stocks lost another 55% in value.
In 2008, when they lost this line, stocks lost another 44%.
Suffice to say, a lot is at stake here. And as I said before… the clock is ticking.
If you’ve yet to take steps to prepare for the next leg down in the markets, we just published a new exclusive special report How to Invest During This Bear Market.
It details the #1 investment to own during the bear market as well as how to invest to potentially generate life changing wealth when it ends.
To pick up your FREE copy, swing by:
https://phoenixcapitalmarketing.com/BM.html