By Graham Summers, MBA
The stock market sure look bullish, doesn’t it?
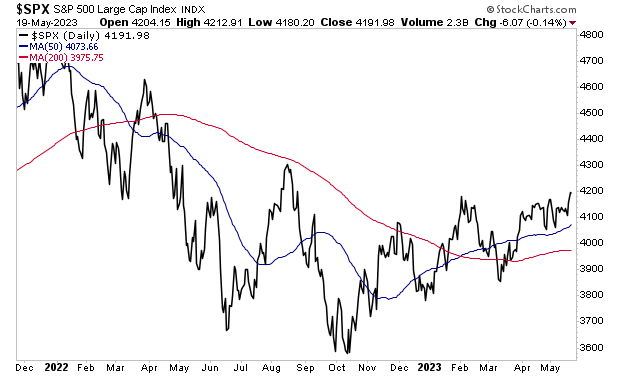
The S&P 500 has managed to start turning its 200-day moving average (DMA) upwards. This is a significant development is at it indicates that the intermediate to long-term trend is on the verge of becoming “up.”

As positive as this seems, beneath the surface of the markets there are a lot of glaring divergences developing.
Divergences occur when two assets that typically trade in line with each other start to diverge. These kinds of developments tell us that something unusual is happening in the market. Sometimes it’s not a bit deal. Other times, like in late 2007 or just before the shut-downs in 2020, these divergences serve as a warning that a crash or black swan event is about to hit.
On that note, let’s consider some of the more glaring divergences taking place today.
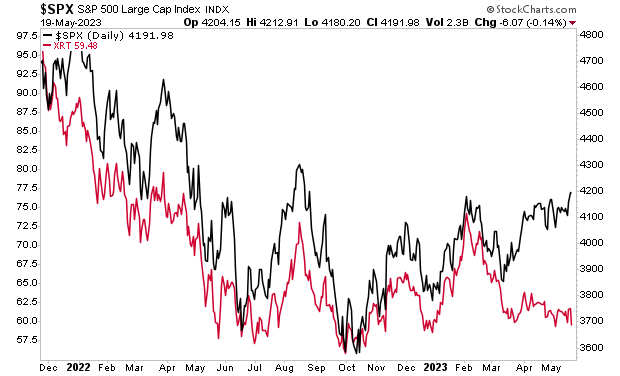
The Retail ETF (XRT) tracks the performance of 90 retailers in the U.S. As such it serves as a decent proxy for the consumer. And XRT has NOT participated in this rally at all. In fact, it’s rapidly approaching its October 2022 lows.

There are other, similar divergences all over the markets.
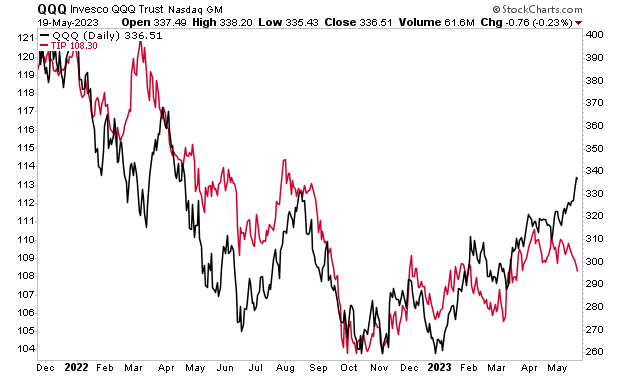
Tech stocks usually trade in line with inflation-adjusted Treasuries. The reason for this is that Tech is priced based on where “real,” or inflation adjusted, Treasury yields are trading. When yields are relatively low, investors pile into tech because it is a high growth sector.
With that in mind, there is a large divergence between tech stocks and inflation-adjusted Treasuries today. Someone is “wrong” here.

These are just two examples of major divergences, but there are literally over a dozen happening in the stock market right now. Something is very, very “off” about this market rally in stocks.
And I think I know what it is.
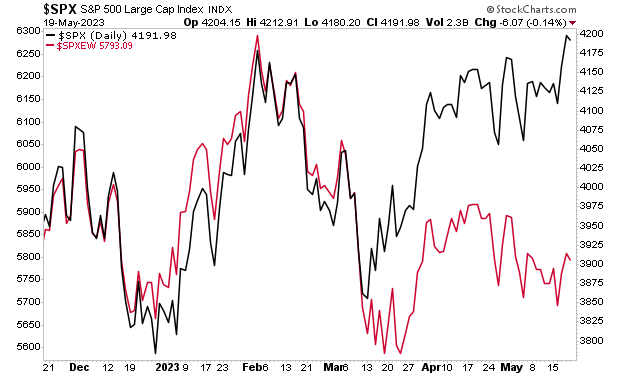
What’s happening is that the overall market is being pushed higher by a handful of large tech companies. Because these companies account for nearly 25% of the S&P 500’s overall weight, their outperformance is forcing the overall market to move higher despite all these divergences.
Indeed, when we strip out the effect of these companies with an “equal weight” stock market index, this dynamic becomes clear. MOST of the companies in the S&P 500 are down. Only a small handful are up. They just happen to be the largest companies both in terms of size and in terms of index weighting.

How will this play out?
Sometimes divergences resolve with the trailing assets playing “catch up.” However, when there are so many divergences occurring across so many different areas of the market, this is unlikely.
What’s far more likely is that the markets nose-dive in the near future. Many analysts will tell you “ no one saw this coming!” but now you know better.
For those looking to prepare and profit from this mess, our Stock Market Crash Survival Guide can show you how.
Within its 21 pages we outline which investments will perform best during a market meltdown as well as how to take out “Crash insurance” on your portfolio (these instruments returned TRIPLE digit gains during 2008).
To pick up your copy of this report, FREE, swing by:
https://phoenixcapitalmarketing.com/stockmarketcrash.html


