By Graham Summers, MBA
The market rally in 2023 has been driven by tech, specifically, Big Tech (Apple, Microsoft, Nvidia, Alphabet, etc.).
While a handful of large companies have driven the stock market gains, the vast majority of stocks are down. Take out the big tech players, and the S&P 500 would have lost money thus far in 2023, as opposed to rising 8%.
Many gurus are suggesting this divergence will resolve with a collapse for the stock market. But that’s not necessarily true. Yes, the big tech players could correct which would be negative for the overall market. But we could also see some of the lagging sectors and companies play “catch up.”
If that happens, then the market will hold up and possibly even rise to new highs.
So how do we assess this?
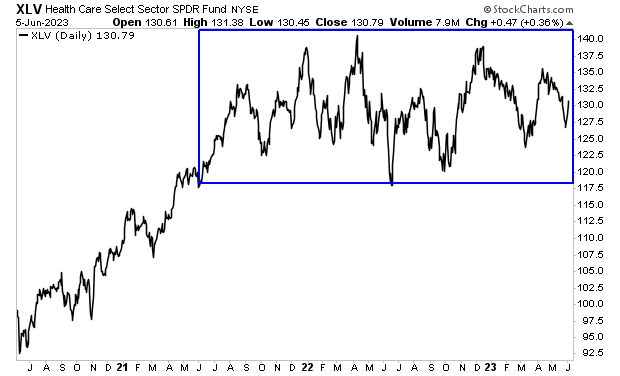
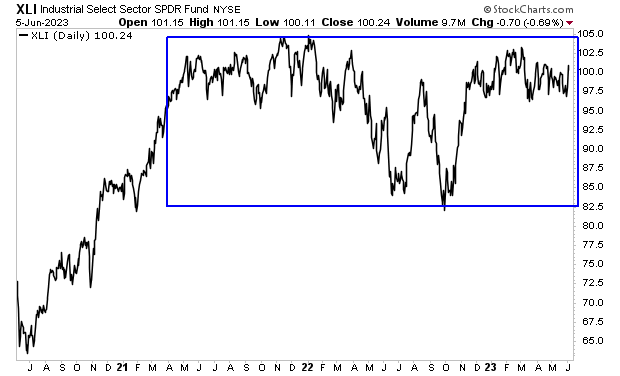
Personally, I’m watching two sectors: Healthcare (XLV) and Industrials (XLI).
Both of these sectors have been lagging big tech, but they’re consolidating or moving sideways as opposed to falling in value. So if they begin to rally, it will dramatically improve market breadth.
Healthcare (XLV) is the second heaviest weighted sector in the market with a weight of 13%. It’s been in a consolidation pattern since mid-2021. Which ever direction this sector finally breaks out will have a significant impact on the overall market.
Industrials (XLI) have a weight of 8% in the S&P 500. This sector, like healthcare, has been in a consolidation pattern for most of the last two years. A breakout to the upside would boost the market and improve the breadth of this rally significantly.
In the simplest of terms, if these sectors begin to participate, then this market rally will have legs and continue longer than most expect.
For more investment insights as well as several special reports outlining how to profit during a bear market, periods of high inflation, and more, swing by:
https://gainspainscapital.com/