By Graham Summers, MBA
Nearly every market collapse follows a particular pattern.
That pattern?
1) Stocks break down below a critical level of support.
2) Stocks rally to “kiss” this former support, failing to reclaim it.
3) Stocks roll over and the real collapse begins.
This pattern is now playing out with the S&P 500.
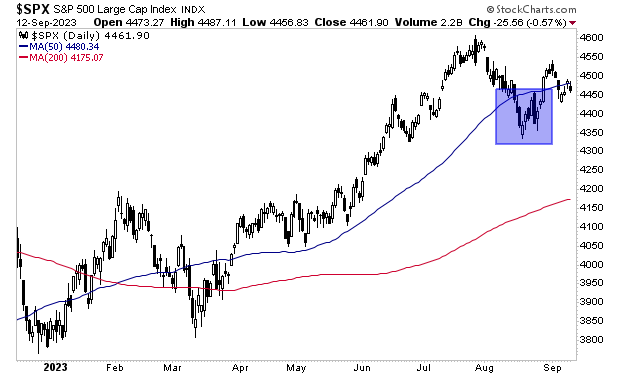
The S&P 500 first broke below its 50-day moving average (DMA) in August of 2023. This was a significant development as it was the first time the S&P 500 had lost this support since the March 2023 lows. I’ve illustrated this with a blue rectangle in the chart below.
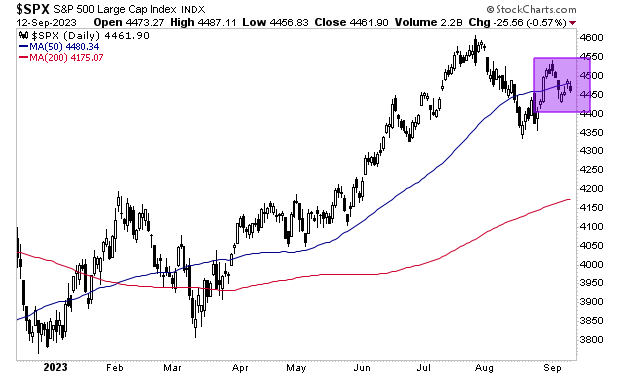
The market then rallied to retest the 50-DMA from below. It briefly broke above this line in early September, but has failed to hold it.This represents the “kiss” as I mentioned earlier: when stocks try to reclaim critical support but fail to do so. I’ve illustrated this with a purple square in the chart below.
What comes next?
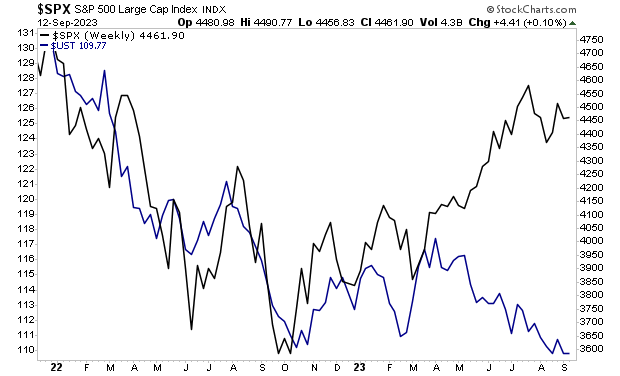
Bonds have been telling us for weeks. It’s just a matter of time before stocks “get it.”
If you’ve yet to take steps to prepare for what’s coming, we just published a new exclusive special report How to Invest During This Bear Market.
It details the #1 investment to own during the bear market as well as how to invest to potentially generate life changing wealth when it ends.
To pick up your FREE copy, swing by:
https://phoenixcapitalmarketing.com/BM.html