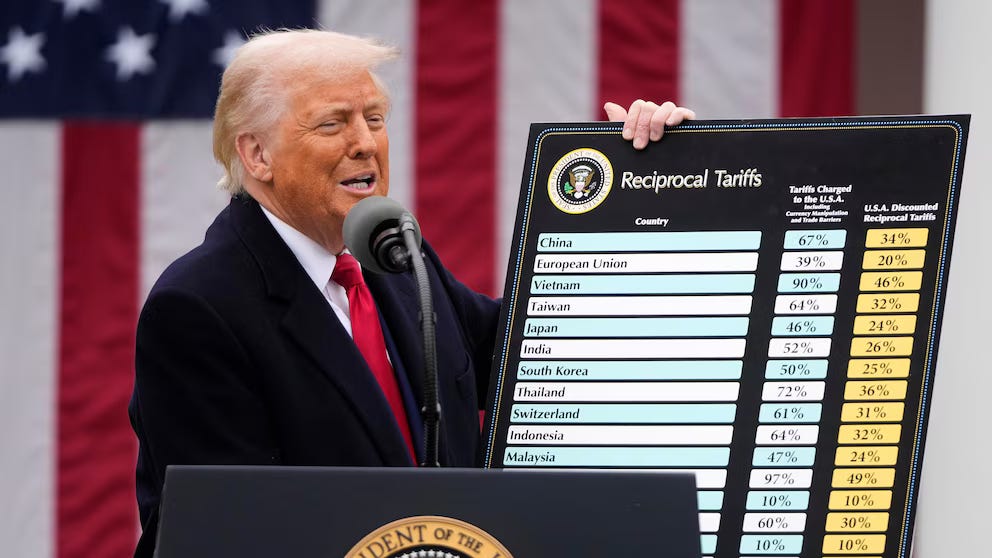
President Trump just unveiled the tariffs the U.S. will be placing on trading partners in the Rose Garden a few moments ago. It’s a YUUUUUUGE chart… and represents a tectonic shift in global trade.
Get a Load of That YUGE Chart!
Remember, 45% of S&P 500 revenues come from abroad. So if you think the U.S. can introduce all these tariffs without it hitting the stock market, I’ve got a bridge I’d like to sell you.
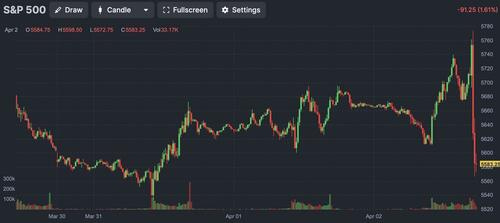
Indeed, the futures market just collapsed on the news. See for yourself, it’s only marginally over the March lows.
Speaking of tectonic shifts, investors are speaking with their money by yanking capital out of stocks for the perceived safety of bonds. And this is a GLOBAL phenomenon.
Bonds Are Crushing Stocks For the First Time in THREE YEARS
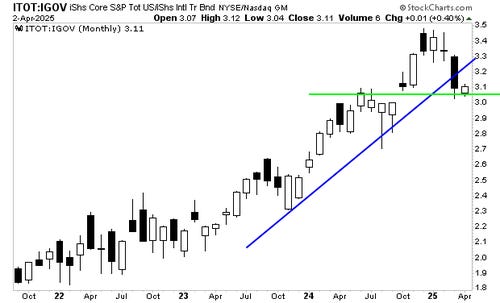
Below is a chart showing the ratio between the totality of stocks vs the totality of bonds. This is THE chart for asset allocators looking for clues as to what the markets are saying about stocks vs. bonds.
This ratio has just taken out its bull market trendline (blue line) as bonds have outperformed stocks for four months straight. Put simply, for the first time in over TWO YEARS, bonds are a better place for capital than stocks.
As I write this, the ITOT:IGOV ratio is sitting at critical support (green line). If it takes out that line, BUCKLE UP because stocks are in for a world of hurt and we could very well see a Crash.
Our Crash Trigger is On Red Alert!
IIndeed, our proprietary Crash Trigger is now on red alert. This trigger went off before the 1987 Crash, the Tech Crash, and the 2008 Great Financial Crisis.
We detail this trigger, how it works, and what it’s saying about the market today in a Special Investment Report titled How to Predict a Crash.
Normally this report is only available to our paying clients, but in light of what’s happening in the markets today, we are making just 99 copies available to the general public.
To pick up one of the remaining copies…
Graham Summers, MBA
Chief Market Strategist
Phoenix Capital Research


