By Graham Summers, MBA
Stocks look to have formed a short-term peak last week.
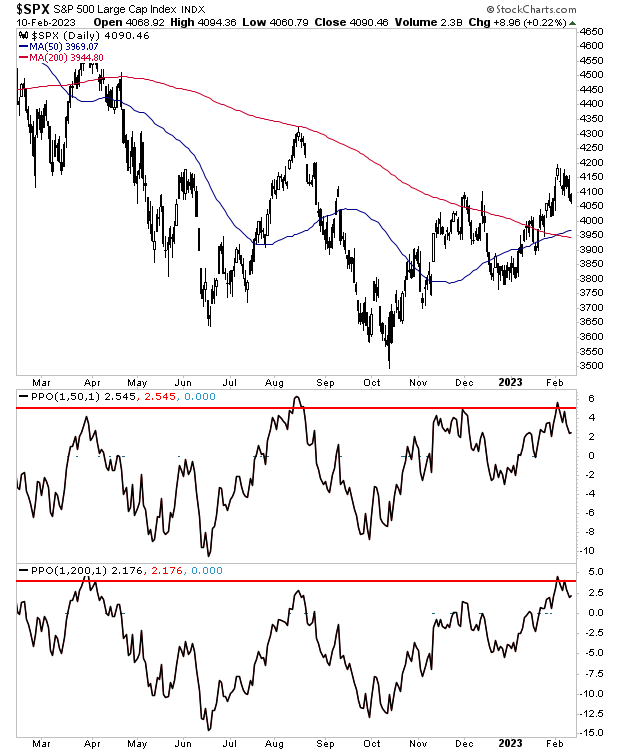
Ever since this bear market began, the S&P 500 has followed certain dynamics. One of them is that it usually peaks around the same levels above its 50- and 200-day moving averages (DMAs).
Specifically, anytime the S&P 500 gets 5% above its 50-DMA and 3% above its 200-DMA, it usually tops out and rolls over. I’ve illustrated this dynamic with red horizontal lines in the chart below. And as you can see, this dynamic was at work during the recent stock market action as well: the S&P 500 rallied right to those levels and then rolled over.
So where do stocks go from here?
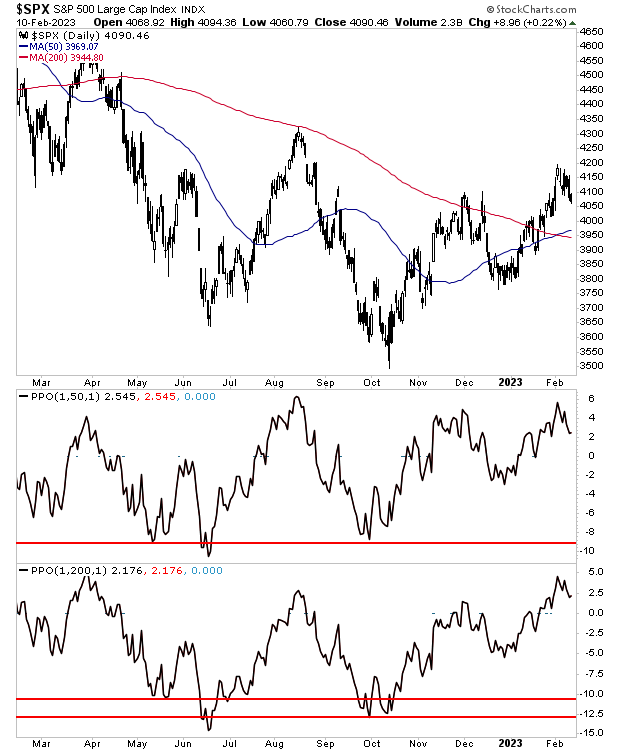
Well, the chart suggests they won’t stop the coming leg down until they are 8% below their 50-DMA and 10%-12% below their 200-DMA. That is where stocks have “bottomed” during the down legs of this bear market thus far.
I’ve illustrated those levels with red horizontal lines in the chart below.
Bear in mind, these kinds of moves can take weeks if not months to play out, so don’t expect a crash here and now. I’m simply sharing these charts with you to give you some idea of the underlying dynamics of this bear market, and where things are likely headed in the weeks to come.
If you’ve yet to take steps to prepare for what’s coming, we just published a new exclusive special report How to Invest During This Bear Market.
It details the #1 investment to own during the bear market as well as how to invest to potentially generate life changing wealth when it ends.
To pick up your FREE copy, swing by:
https://phoenixcapitalmarketing.com/BM.html