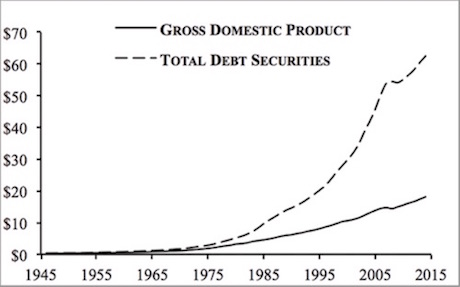
The Powell Fed is playing with matches next to over $60 trillion in $USD-denominated debt.
The $USD is the reserve currency of the world. As such it is the currency of choice if you are going to issue debt. As a result of this, entities around the globe, whether they be corporations or countries will often choose to issue debt denominated in the $USD, even if the $USD is not a currency used in their economy.
When you borrow money in the $USD… you are effectively SHORTING the $USD. You are better/hoping that the $USD will weaken, making your debt servicing/ future debt repayment, cheaper on a relative basis.
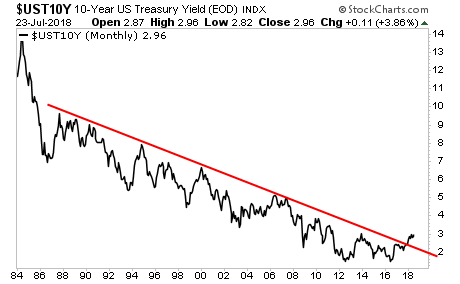
In this environment, when the $USD strengthens, it becomes MORE DIFFICULT to service your debt. This is true even for the US itself. The $20 trillion we owe in public debt is effectively one gigantic $20 trillion $USD short.
Enter Jerome Powell.
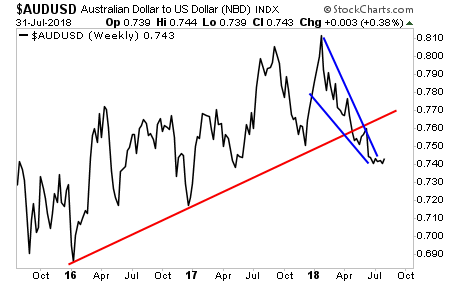
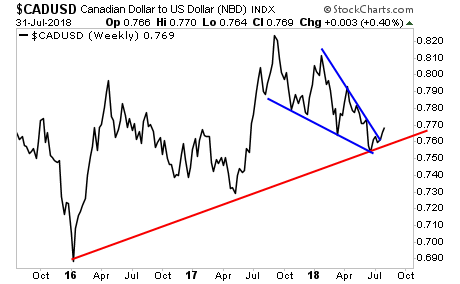
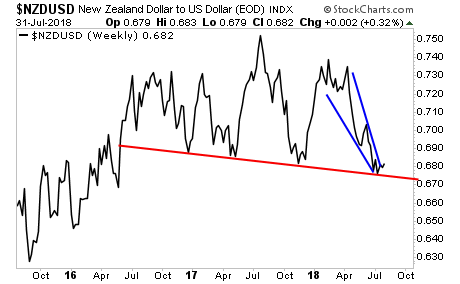
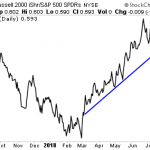
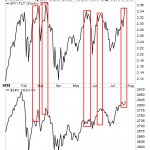
For whatever reason, the Powell Fed has decided to embark on the most aggressively hawkish monetary policy in Fed history. And the currency markets have taken note. The $USD is breaking out of downtrends in Every. Single. Currency. Pair.
The day Jerome Powell became Fed chair is annotated buy the vertical blue line.
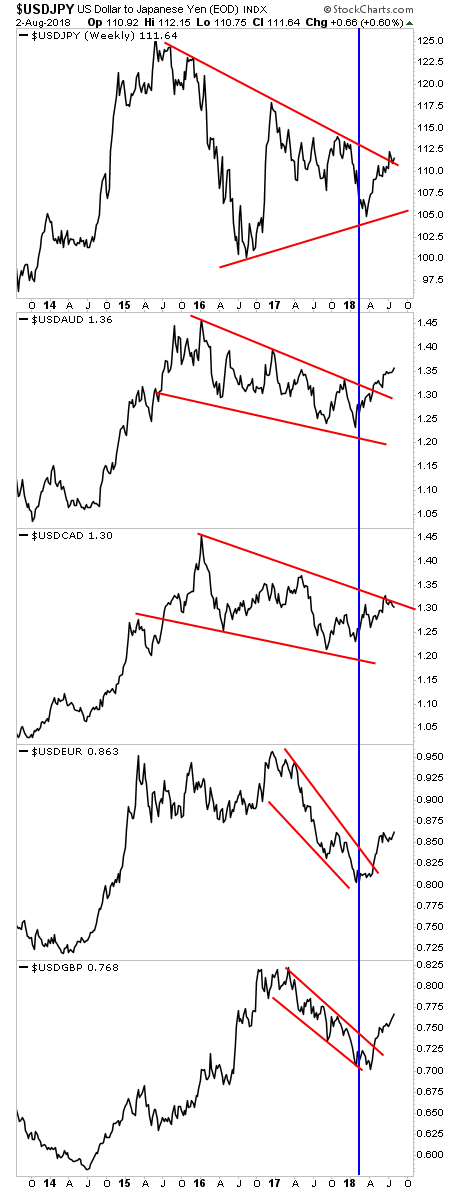
Assuming Jerome Powell DOESN’T want to blow up the $60 trillion $USD-denominated debt bubble… the above chart SCREAMS “policy error.”
I’m not being dramatic here… the last time the $USD rallied like this against every major currency was in 2014. At that time the entire commodity complex implode by over 60% and the Emerging Market came within a hair’s breadth of systemic collapse.
Again, I’m not being dramatic here… within six months of the $USD’s rally in 2014, Brazil’s stock market was down nearly 70%. China’s was down nearly 50%. Emerging Markets across the board dropped over 30%. Oil fell from $105 to $30 and change. Etc.
I don’t see any indication Powell is aware of this… which means
BUCKLE UP. THE EVERYTHING BUBBLE HAS FOUND ITS PIN. AND THE PIN’S NAME IS JEROME POWELL.
On that note, we are putting together an Executive Summary outlining all of these issues as well as what’s coming down the pike when the Everything Bubble bursts.
It will be available exclusively to our clients. If you’d like to have a copy delivered to your inbox when it’s completed, you can join the wait-list here:
https://phoenixcapitalmarketing.com/TEB.html
Best Regards
Graham Summers
Chief Market Strategist
Phoenix Capital Research