Month: July 2021

Is Another Round of Lockdowns Coming? Two Stocks To Watch

Yesterday President Biden suggested that the U.S. might face another wave of lockdowns. Among the various policies he hinted at were:

1)    Mandating that all Americans get the Covid-19 vaccines.

2)    Shutting down businesses, schools, society like in 2020.

The question now is whether this is a political ploy or if the American people will go along with these proposed policies.

After all, the only reason we had lockdowns in 2020 was because people complied.

I’m not a psychic and cannot claim to have answers to this. But I do know that the stock market is forward­-looking and can provide us with some clues.

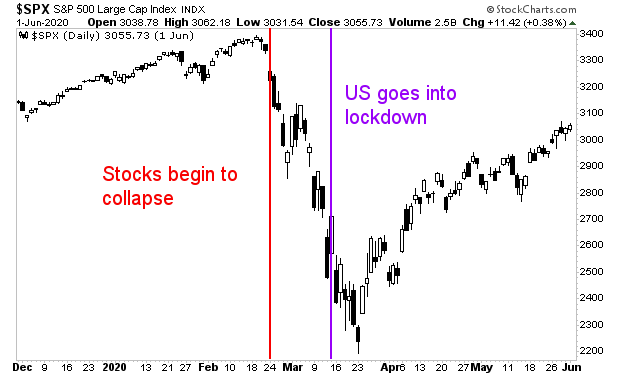
After all, back in 2020, stocks began to collapse in late February, several weeks before the country formally went into lockdown.
Chart

Description automatically generated

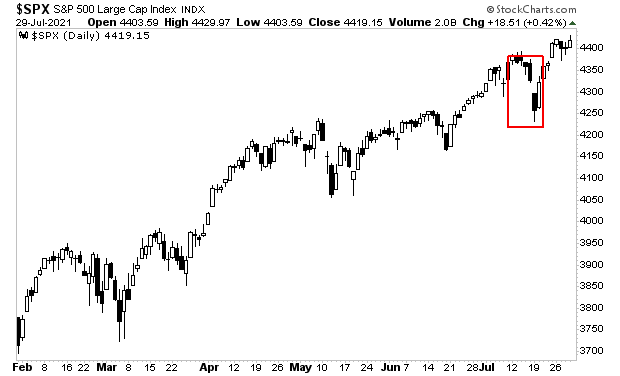
Today, stocks are not collapsing (at least not yet).

We had the beginnings of a breakdown in mid-July, but that quickly reversed and gave way to new all-time highs. Moreover, that particularly breakdown wasn’t distinguishable from other corrections over the last six months.
Chart, histogram

Description automatically generated

Still, it’s always good to keep an eye on things. So below are two stocks I’m watching for signs of whether or not another round of lockdowns is coming.

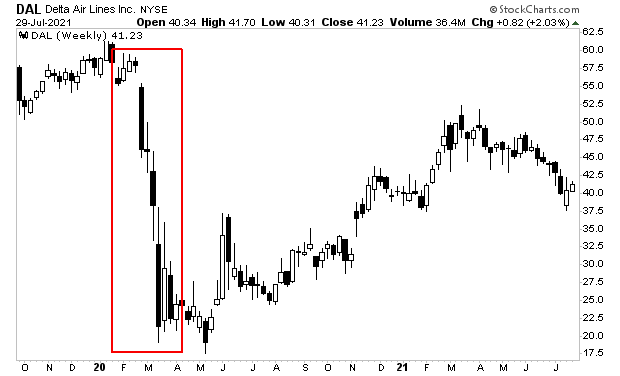
First is Delta Airlines (DAL).

Airlines were one of the hardest hit industries from the 2020 lockdowns. DAL was no exception with shares collapsing over 70% during the first wave of lockdowns (red rectangle).

If we’re heading into another round of lockdowns, I would expect this chart to breakdown BADLY in the coming days. DAL shares have begun to breakdown, but they’ve yet to really nosedive.
Chart, histogram

Description automatically generated

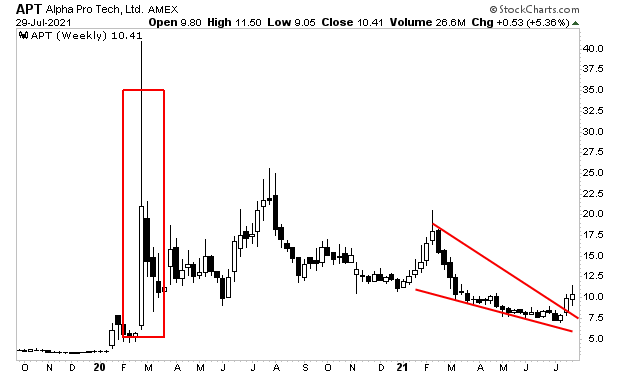
Another company I’m watching is Alpha Pro Tech (APT).

This company makes masks, hazmat suits, shields and other infection control apparel. If we were going towards another round of lockdowns, I would expect to see APT shares start to explode higher as they did in February of 2020 (red rectangle).
Chart, histogram

Description automatically generated

Is another COVID-19 shutdown coming? I don’t know. But if it does, we should experience another financial crisis.

With that in mind, we’ve reopened our Stock Market Crash Survival Guide to the general public.

Within its 21 pages we outline which investments will perform best during a market meltdown as well as how to take out “Crash insurance” on your portfolio (these instruments returned TRIPLE digit gains during 2008).

We are making just 100 copies available to the general public.

To pick up your copy of this report, FREE, swing by:

http://phoenixcapitalmarketing.com/stockmarketcrash.html

Best Regards

Graham Summers

Chief Market Strategist

Phoenix Capital Research

Posted by Phoenix Capital Research in It's a Bull Market

Buckle Up: Jerome Powell “Cut a Deal” And Inflation is Going Roar!

Over the last two days, we’ve outlined how the bond market is predicting a surge in inflation.

By quick way of review:

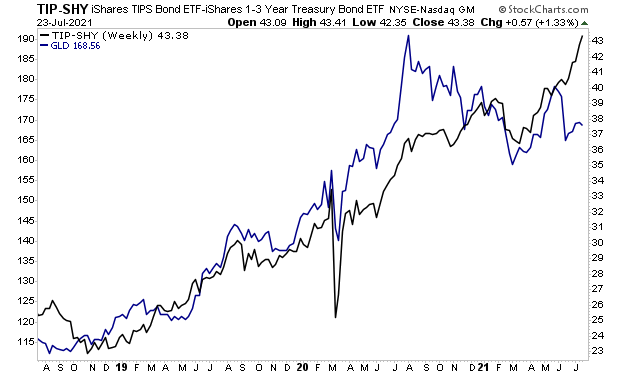
  1. Real rates, as measured by the difference between yields on Inflation Treasury Inflation-Protected Securities or TIPS and regular Treasuries have been surging higher (see the chart below).
  • This means that TIPS are dramatically outperforming Treasuries right now. Since TIPs trade based on inflation expectations, this suggests that the bond market is predicting much higher inflation.

What would cause this?

Another round of massive money printing.

We’ve already noted that the Biden administration hopes to sign a $2-$4 trillion infrastructure program into law in the next few weeks. And after that there is talk of a $1.7 trillion climate change program.

Today, I’d like to tackle the Fed’s role in all of this.

The Fed is currently engaged in a $120 billion per month Quantitative Easing (QE) program. This comes to over $1.4 trillion in month printing per year.

Recently the Fed has been hinting that it intends to taper this program, and possibly start raising rates sometime in 2022/ early 2023. But by the look of things, that will no longer be the case.

Why?

Because the Biden administration recently leaked that it intends to give Jerome Powell as second term as Fed Chair starting in 2022.

The story was leaked via Bloomberg, which has a close relationship with the Biden administration. And it suggests that Jerome Powell has “cut a deal” with Joe Biden to stay on as Fed chair. After all, the only way that Joe Biden would give Jerome Powell a second term would be if the latter “got onboard” with Biden’s agenda.

That agenda?

Keep the economy as strong as possible going into the 2022 mid-terms.

This means NO tapering, NO rate hikes, and NO tightening of monetary conditions for the foreseeable future. Sure, the Fed might jawbone things or stage verbal interventions here and there to provide political cover, but there is no way on earth Jerome Powell can tighten monetary conditions in the near future if he wants to stay on as Fed Chair.

Which means…

Inflation is going to ROAR in the coming months.

On that note, if you’re concerned about inflation, we have published a Special Investment Report concerning FIVE secret investments you can use to make inflation pay you as it rips through the financial system in the months ahead.

The report is titled Survive the Inflationary Storm. And it explains in very simply terms how to make inflation PAY YOU.

We are making just 100 copies available to the public.

To pick up yours, swing by:

https://phoenixcapitalmarketing.com/inflationstorm.html

Best Regards

Graham Summers

Chief Market Strategist

Phoenix Capital Research

Posted by Phoenix Capital Research in Inflation

Why Inflation is About to Get a Whole Lot Worse

Yesterday I outlined how real rates suggest gold will be moving MUCH higher in the coming months.

By quick way of review:

  1. Because we are in a fiat-based monetary regime, gold trades like any other asset.
  • Specifically, gold typically tracks “real rates” or the actual cost of money as illustrated by the difference between yields on Inflation Treasury Inflation-Protected Securities or TIPS and regular Treasuries).
  • Real rates typically lead gold at major turns. We saw this at the bottom in March 2020 and more recently in June 2021.

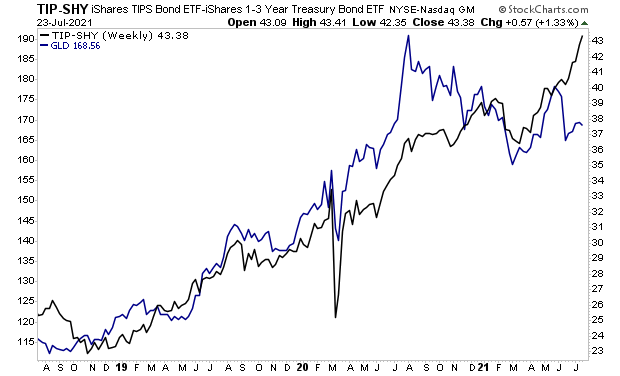
Recently a massive divergence has developed between real rates and gold with real rates rising and gold lagging (see the chart below).

This would suggest gold will be going MUCH higher in the coming months.

What would trigger this?

 Inflation.

Remember, real rates represent the difference between the yields on Treasury Inflation-Protected Securities (TIPS) and regular Treasuries. So, when TIPs outperform regular Treasuries, this line rises, and when regular Treasuries outperform TIPs, this line falls.

So, the fact real rates are rising so aggressively means that TIPS which focus on inflation are dramatically outperforming Treasuries right now. This means the bond market is predicting greater inflation is coming.

What would trigger this?

Two things:

  1. The $2-$4 trillion infrastructure program the Biden Administration is hoping to sign into law in the near future.
  • Jerome Powell’s continued tenure as Fed Chair in 2022.

Regarding #1, policymakers have already made it clear from their response to the 2020 shutdowns that their entire blueprint for dealing with crises, boils down to just two words.

PRINT MONEY.

Shutting down the economy triggers a depression?

Print money.

Stock market experiences fastest 30% crash in history?

Print money.

Municipal bonds collapse because the bond markets don’t believe cities and states will be able to meet their debt obligations?

Print money.

The economy still hasn’t come back because state officials continue to keep their economies on partial or complete lock downs?

Print money.

The economy isn’t coming back fast enough despite vaccines and states reopening?

Print money.

Indeed, policymakers printed so much money to combat the impact of the COVID-189 lockdowns that if you add up all of the money the U.S. has ever printed… over 40% of it was printed in 2020.

And the Biden administration doesn’t intend to stop anytime soon. It has already implemented a $1.9 trillion stimulus. It’s now attempting to get a $2-$4 trillion infrastructure program signed into law. And after that it hopes to implement a $1.7 trillion climate change program.

Inflation is already roaring. What do you think another $2-$4 trillion in money printing will unleash?

And bear in mind, that’s just the Federal Government. We’re not even accounting for the Fed here.

I’ll dive into that tomorrow.

In the meantime, if you’re concerned about inflation, we have published a Special Investment Report concerning FIVE secret investments you can use to make inflation pay you as it rips through the financial system in the months ahead.

The report is titled Survive the Inflationary Storm. And it explains in very simply terms how to make inflation PAY YOU.

We are making just 100 copies available to the public.

To pick up yours, swing by:

https://phoenixcapitalmarketing.com/inflationstorm.html

Best Regards

Graham Summers

Chief Market Strategist

Phoenix Capital Research

Posted by Phoenix Capital Research in Inflation

Is Gold About To Rip Higher?

On Friday we outlined the strange price action in gold.

As a quick recap:

  1. Because we are in a fiat-based monetary regime, gold trades like any other asset.
  • Specifically, gold typically tracks “real rates” or the actual cost of money as illustrated by the difference between yields on Inflation Treasury Inflation-Protected Securities or TIPS and regular Treasuries).
  • Recently a massive divergence has developed between real rates and gold.

Regarding #3 in the list above, the divergence between the two items is quite large, which means either real rates need to come down, or gold needs to catch up.

Chart, histogram

Description automatically generated

I believe we will see gold begin it next leg up relatively shortly.

Why?

Because real rates usually lead gold on turns.

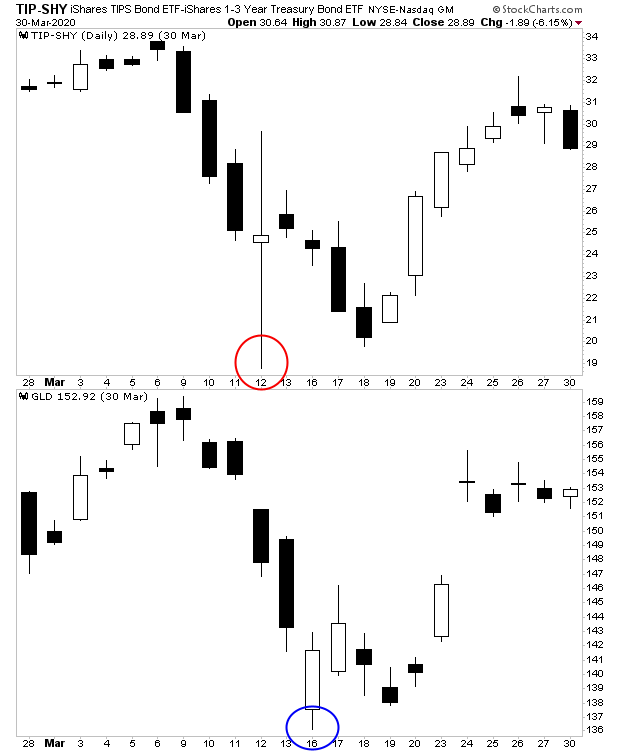
Let’s go back to the COVID-19 meltdown. Note that real rates (top box) bottomed a few days before gold did (bottom box). Real rates bottomed on March 12th, while gold bottomed on March 20th.

Chart

Description automatically generated

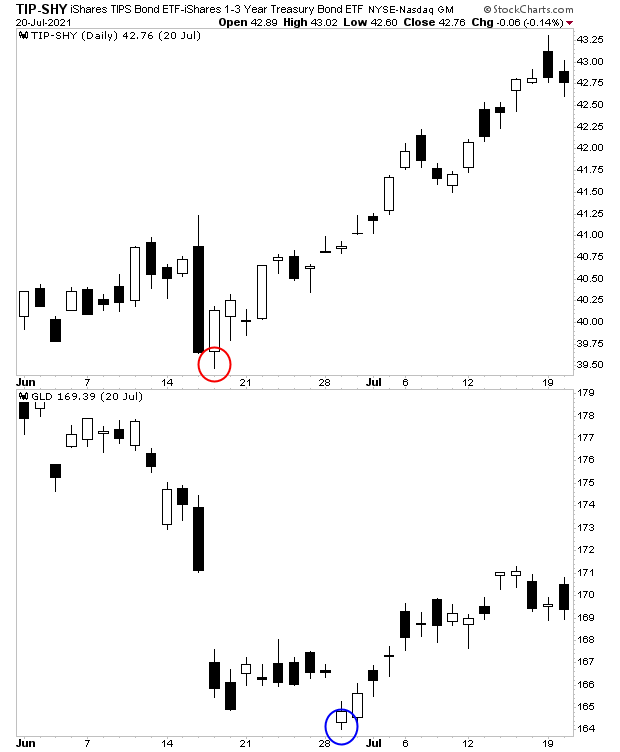
We saw this same dynamic play out again more recently in June of 2021 when real rates bottomed on the 17th of June (red circle) while gold didn’t bottom until the 29th (blue circle).

Chart, waterfall chart

Description automatically generated

This would suggest that real rates will in fact lead gold higher going forward. Again, real rates have been soaring while gold is struggling to ignite higher. The below chart suggests gold will eventually be running to $2,000 per ounce in the coming months.

Chart

Description automatically generated

What would trigger a run like this?

Inflation.

I’ll outline how and why in tomorrow’s article until then.

In the meantime, if you’re concerned about inflation, we have published a Special Investment Report concerning FIVE secret investments you can use to make inflation pay you as it rips through the financial system in the months ahead.

The report is titled Survive the Inflationary Storm. And it explains in very simply terms how to make inflation PAY YOU.

We are making just 100 copies available to the public.

To pick up yours, swing by:

https://phoenixcapitalmarketing.com/inflationstorm.html

Best Regards

Graham Summers

Chief Market Strategist

Phoenix Capital Research

Posted by Phoenix Capital Research in Inflation

Something BAD is Brewing in the Economy

Yesterday I noted that Friday’s action was very troubling. By quick way of review:

  1. It is unusual for stocks to close down on Friday.
  2. It’s even more unusual for stocks to finish the week down.
  3. Not only did stocks finish the day and week down but they did so near the lows. This too is highly irregular as typically the markets bounce hard off the lows even if they finish the session or week down.

Today I’d like to delve into the specifics of what the market is telling us.

The market is telling us that something BAD is brewing in the economy. While it’s true that stocks no longer have a close relationship with the economy (stocks will often rally on both bad and good economic news), certain sectors are HIGHLY correlated to economic activity. And they all are flashing major warnings.

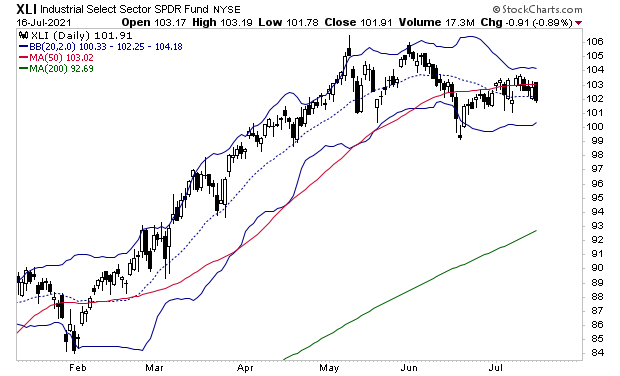
First and foremost are Industrials (XLI). These are companies that either produce actual things like tractors, cranes, HVAC systems, etc. or that are involved in real economic activity (mail/shipping). As such, they represent a good gauge of how strong the real economy is doing: during economic expansions these businesses receive more orders.

The chart is downright awful. Industrials have rolled over and broken below their 50-day moving average (DMA).

Chart, histogram

Description automatically generated

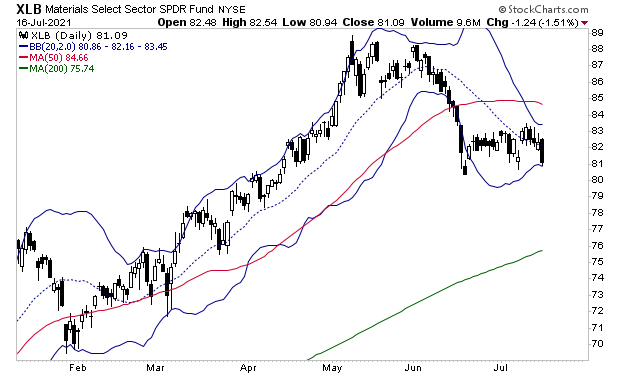
Next up are Materials (XLB). These are companies involved in producing things like concrete, copper, steel and the like. During economic expansions these companies receive more orders as they are the primary suppliers of commodities needed for construction, manufacturing and the like.

Here again the chart is awful. The breakdown is more severe than that of industrials. Not only is XLB further below its 50-DMA but the down days are powerful, wiping out weeks’ worth of gains in a single session.

Chart, histogram

Description automatically generated

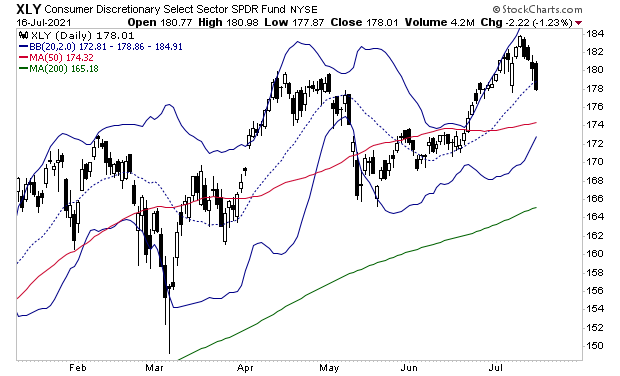
Finally, we have the Consumer Discretionary (XLY). The consumer accounts for 75% of the U.S. economy. The chart is not nearly as bearish as that of Industrials or Materials, but it is still awful.

XLY has effectively gone nowhere since April. The rally in June/ early July failed miserably and now it looks as though we’ll see a test of the 50-DMA. By itself this is an ugly chart, but in the context of what’s happening in Industrials and Materials it is very worrisome.

Diagram

Description automatically generated with medium confidence

Add these charts up and they are telling us something BAD is happening in the economy right now. With that in mind, we’ve reopened our Stock Market Crash Survival Guide to the general public.

Within its 21 pages we outline which investments will perform best during a market meltdown as well as how to take out “Crash insurance” on your portfolio (these instruments returned TRIPLE digit gains during 2008).

We are making just 100 copies available to the general public.

To pick up your copy of this report, FREE, swing by:

http://phoenixcapitalmarketing.com/stockmarketcrash.html

Best Regards

Graham Summers

Chief Market Strategist

Posted by Phoenix Capital Research in It's a Bull Market

Why a Rising $USD is a Major Issue for the U.S.

The #1 issue for the markets this week is the $USD.

The U.S. dollar is strengthening. A strong dollar is not necessarily a bad thing, but it runs completely contrary to the Fed’s stated goal of creating inflation.

Following a brief spike during the deflationary episode of March, for most of 2020, the $USD dropped like a stone (see area highlighted by a red arrow in the chart below). However, it’s been a completely different era for 2021 as the $USD has been rangebound thus far (see blue rectangle in the chart below).

Chart, waterfall chart

Description automatically generated

This is happening at a time when the Fed has explicitly stated that it wants to create inflation. It is also happening at a time when the U.S. is $28 trillion in debt, and the U.S. is attempting to run a $3+ trillion deficit.

And therein lies the problem.

The U.S. finances its spending via tax revenues. If tax revenues are not great enough to cover the costs, the U.S. issues debt. This is deficit everyone is always talking about. In simple terms the U.S. finances its massive spending sprees by issuing debt.

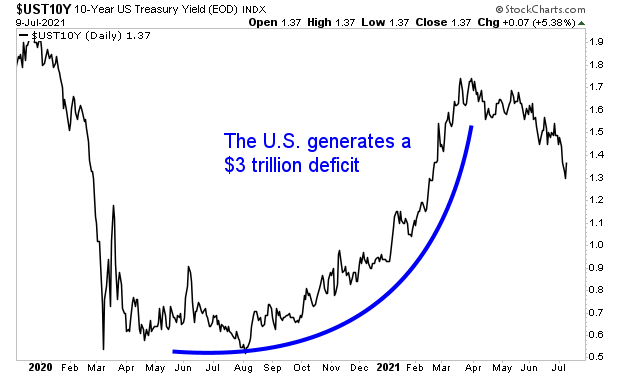
In order for the bond market to absorb the massive debt issuance the U.S. generated in 2020 (the U.S. ran a $3 trillion deficit that year), it required higher yields. In simple terms, this was the bond market saying, “if you want us to buy all of this debt, you need to pay us more.” You can see this in the chart below.

Diagram

Description automatically generated

This changed in 2021, at which time bond yields began to roll over as it appeared Congressional gridlock would limit the Biden administration’s plans on spending some $6 trillion. Yields started to come down as the bond market began to process this information.

But that doesn’t mean the $USD at current levels isn’t a problem. Even if the Biden administration can’t run a $6 trillion budget, it will still run a $3+ trillion deficit. Indeed, the U.S. is already $2 trillion in the red for 2021 as of June.

The stronger the $USD is in this environment, the more “expensive” it is the U.S. to pay its debts. A big part of the Fed/ Federal Government’s scheme with inflation is that it means the U.S. can pay back its debts with dollars that are technically worth less.

But if the $USD stays strong, this means it becomes more expensive for the U.S. to finance its debt loads. And with total public debt north of $28 trillion, this can be a real problem.

Indeed, it’s possible the U.S. is finally approaching a potential debt crisis in the coming months. With that in mind, we’ve reopened our Stock Market Crash Survival Guide to the general public.

Within its 21 pages we outline which investments will perform best during a market meltdown as well as how to take out “Crash insurance” on your portfolio (these instruments returned TRIPLE digit gains during 2008).

We are making just 100 copies available to the general public.

To pick up your copy of this report, FREE, swing by:

http://phoenixcapitalmarketing.com/stockmarketcrash.html

Best Regards

Graham Summers

Chief Market Strategist

Phoenix Capital Research

Posted by Phoenix Capital Research in Debt Bomb

These Are the Two Most Horrifying Charts I’ve Seen in a Long-Time

Over the last three days, I’ve been outlining how the Fed “spooked” the bond markets into believing it will move to crush inflation sometime in the next 18 months.

Yesterday we detailed why the Fed would do this, namely because long-term bond yields represent the “growth expectations” against which stocks are priced. So provided these yields are falling to new lows, stocks can continue to rise to new highs.

Put another way, the primary means through which the Fed can keep the “music playing” for the bull market is by manipulating the markets into buying ever cheaper and cheaper debt.

This will allow stocks to go to truly spectacular bubble territory. Yesterday I posited that we could even see the S&P 500 rise to 5,000.

However, it’s important to note the risks associated with this monetary policy. And those risks are clearly illustrated in the below chart.

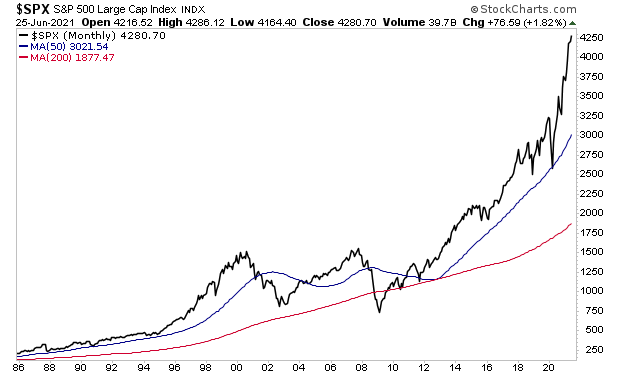
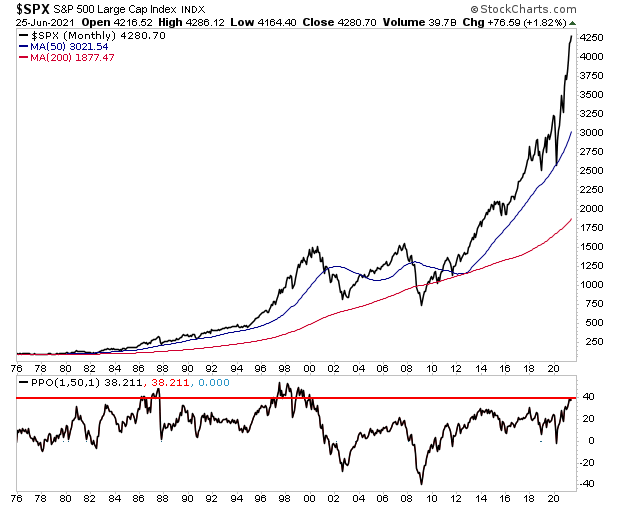
This is a long-term chart of the S&P 500 along with its 50-month and 200-month moving averages (MMAs).  

As you can see, the 50-MMA is of extreme importance to the stock market. During bull markets, the S&P 500 usually bounces hard off this line. And at the start of bear markets, a breakdown below this line is usually the first sign that a bull market is over.

The key item I want to draw your attention to is just how stretched the S&P 500 is above its 50-MMA. The below chart has an added lower box that shows stocks are currently 38% above this level. It’s also worth noting that the market has only been more stretched above this level two times: during the Tech Bubble of the late ‘90s and right before the 1987 Crash.

Suffice to say, both of those instances resulted in pretty dramatic drops.

It’s important to note that the fact stocks are this stretched above the 50-MMA doesn’t necessarily mean that stocks will crash right here and now. As I’ve just detailed, stocks have in fact been even more stretched than this before during other bubbles.

Moreover, with the Fed making it clear it wants stocks to roar even higher, we could indeed see stocks become even MORE stretched above their 50-MMA. It’s never smart to fight the Fed. And until stocks do “something wrong” I wouldn’t sell the farm just yet.

But for certain, when this bubble bursts, we’re in for a spectacular collapse to at least the 50-MMA, which would mean a drop to 3,000. And if stocks enter a new bear market, then we’re talking about a drop to the 200-MMA which would mean stocks falling by more than 50% to 2,000.

A crash is coming. Maybe not this week or next, but it’s coming… which is why we’ve reopened our Stock Market Crash Survival Guide to the general public.

Within its 21 pages we outline which investments will perform best during a market meltdown as well as how to take out “Crash insurance” on your portfolio (these instruments returned TRIPLE digit gains during 2008).

We are making just 100 copies available to the general public.

To pick up your copy of this report, FREE, swing by:

http://phoenixcapitalmarketing.com/stockmarketcrash.html

Best Regards

Graham Summers

Chief Market Strategist

Phoenix Capital Research
Posted by Phoenix Capital Research in It's a Bull Market