Today is also the
second to last day of the week, which means we are about to see a new weekly
candle on the charts.
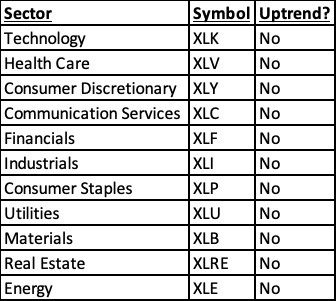
If the markets do not rally hard into the end
of the week, we will end this week without a single sector is in a definitive
uptrend. We have two potential uptrends (Consumer Discretionary and
Financials), but everything else would be in a confirmed DOWN-trend.
This means NONE of the market would be in a
confirmed uptrend and a full 76% of the market would in a DOWN-trend.
Sector
Symbol
Uptrend?
Weighting
Technology
XLK
No
27.60%
Health Care
XLV
No
13.50%
Consumer Discretionary
XLY
Maybe
12.70%
Communication Services
XLC
No
10.80%
Financials
XLF
Maybe
10.40%
Industrials
XLI
No
8.40%
Consumer Staples
XLP
No
6.50%
Utilities
XLU
No
2.80%
Materials
XLB
No
2.60%
Real Estate
XLRE
No
2.40%
Energy
XLE
No
2.30%
In Uptrend
0.00%
Counting Maybes
23.10%
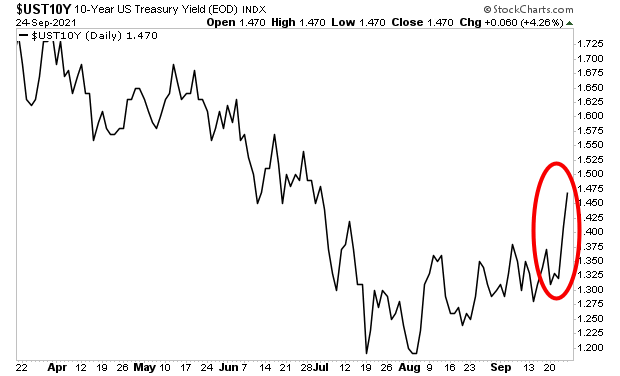
This is the kind of environment in which real FIREWORKS can hit. Indeed, the below chart needs no explanation.
This has many investors asking themselves, “
is a crash about to hit?”
To figure this out, I rely on certain key
signals that flash before every market crash.
I detail them, along with what they’re currently saying about the market today in
a Special Investment Report How to Predict a Crash.
The markets are
bouncing today, but nothing has been resolved.
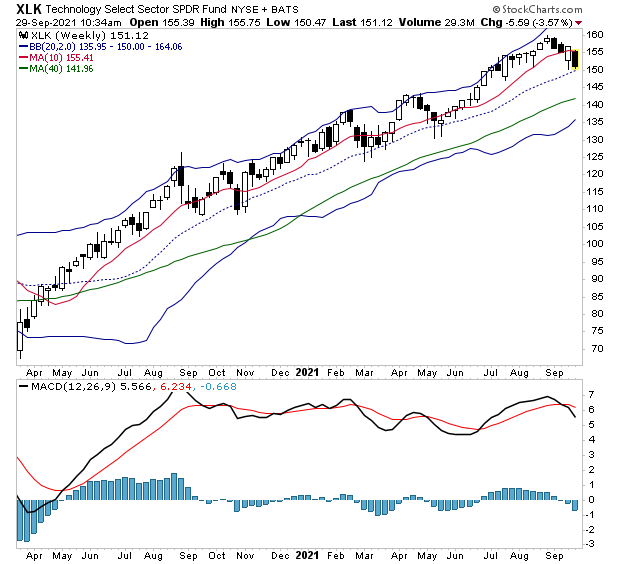
The technical
damage from the last few weeks has been horrific. The two most heavily weighted
sectors in the S&P 500 (Tech and Healthcare) are in confirmed downtrends.
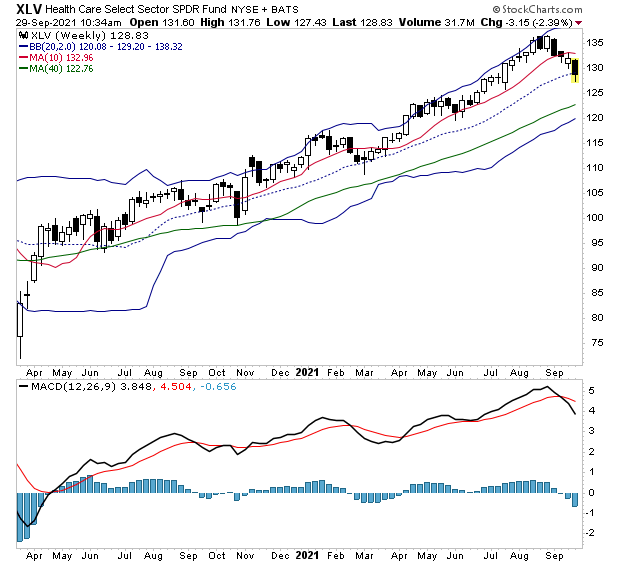
Tech (XLK) has broken
below its 50-DMA. It also as a sell on its weekly MACD.
It’s the same
story for Healthcare (XLV).
These two sectors
alone count for 40% of the S&P 500’s weighting. With both breaking down
like this, the market is under significant duress. Throw in the fact that all
but three sectors are in a similar situation, and we have some 85% of the
market’s weighting in DOWNTRENDS.
This is the kind of environment in which fireworks can hit.
But is a crash
about to hit?
To figure this out, I rely on certain key signals that
flash before every market crash.
I detail them, along with what they’re currently saying
about the market today in a Special Investment Report How to Predict a
Crash.
The
Fed continues to push the narrative that inflation is transitory.
On one level, Fed officials are correct. Everything is transitory. But the Fed isn’t being
philosophical here…it’s
attempting to argue that they don’t need to do anything, and the current wave
of inflation will naturally dissipate.
I know, this is ridiculous. But the Fed is so
desperate to maintain its $120 billion per month money printing scheme, that it
must come up with ridiculous excuses.
First it tried Climate Change, but since it’s
not clear how printing money fixes the weather, they’ve shifted gears to
claiming inflation isn’t an issue and will go away on its own.
Why do this?
Well, it’s difficult to claim that printing
$1.4 TRILLION per year is a benign enterprise when the cost of living is rising
by double digits. And so we end up with ridiculous situations in which Fed
officials are forced to make foolish claims such as their biggest concern is
that we won’t have enough inflation.
I’m not kidding.
Yesterday, Chicago Fed President Charles
Evans stated the following whopper: “I am more uneasy about us not generating enough inflation in
2023 and 2024 than the possibility that we will be living with too much.”
It’d be hilarious if it wasn’t causing so
much suffering for everyday Americans. Anyone who’s been to the grocery store
or filled up their cars at the gas station knows this is bunk.
The same goes for anyone who is paying
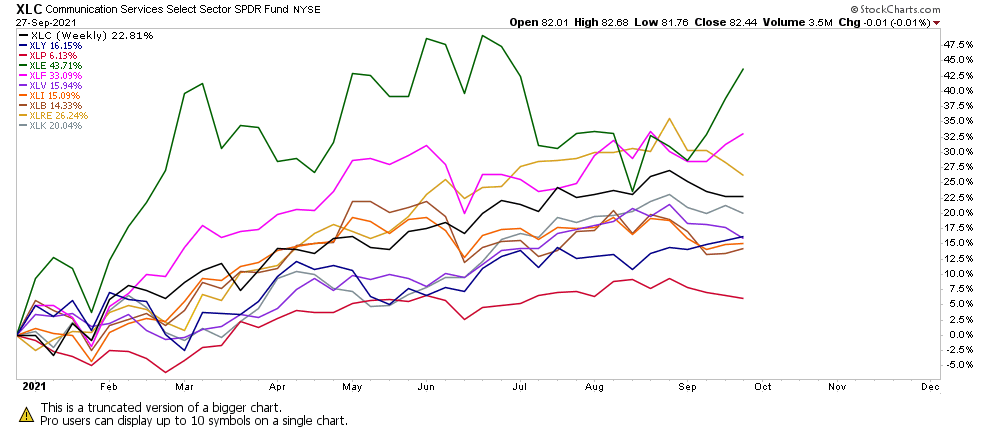
attention to what the markets are actually saying. If you turn off the news and
simply focus on the charts, it’s clear the market is SCREAMING “inflation!”
The top performing asset classes this year
are Energy (XLE), Financials (XLF) and Real Estate (XLRE). They are up 43%, 33% and 26%, respectively.
These are all inflation plays.
Energy and real estate are obvious. And
Financials rally when yields rise (and yields are rising due to inflation).
Heck, even Goldman Sachs has figured this out and is warning its private
clients about a commodities super-cycle courtesy of an inflationary storm.
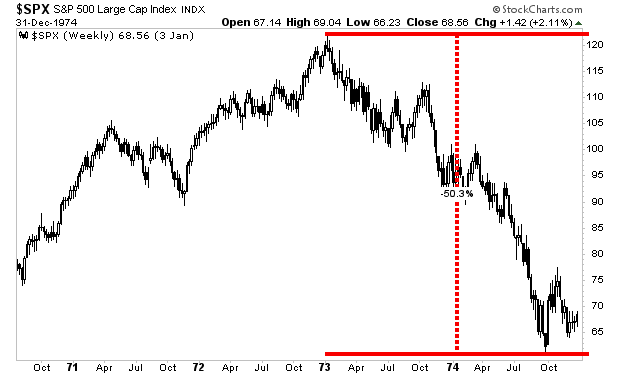
If you think this will be great news for the stock market, think again. During the last major bout of inflation in the 1970s, stocks collapsed some 50%. Even worse, they finished the decade DOWN.
Put another way, a crash is coming. The big question is, “WHEN?”
To figure this out, I rely on certain key signals that
flash before every market crash.
I detail them, along with what they’re currently saying
about the market today in a Special Investment Report How to Predict a
Crash.
The biggest
development last week was the breakout in the 10-year U.S. Treasury.
The 10-year US
Treasury is arguably the single most important bond in the world.
The yield on this bond represents the risk-free rate of return against which
all risk assets (stocks, corporate bonds, mortgages, real estate, etc.) are
valued.
Now, this yield
moves based on a slew of issues: economic growth, portfolio balancing, Fed
monetary policy, what’s happening in international bond markets… and inflation.
I mention all of
this, because the yield on the 10-year US Treasury SPIKED sharply higher last
week.
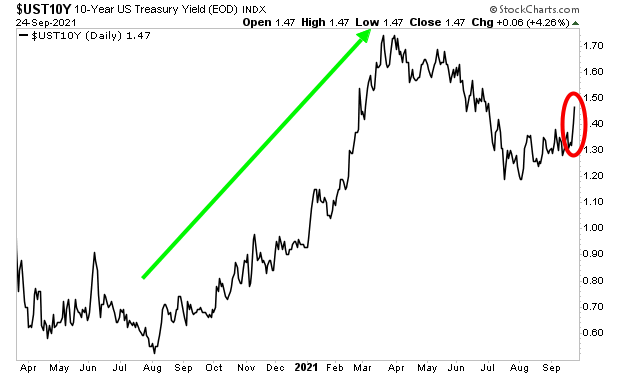
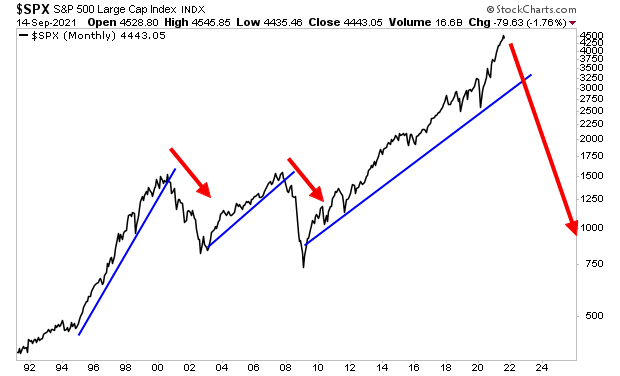
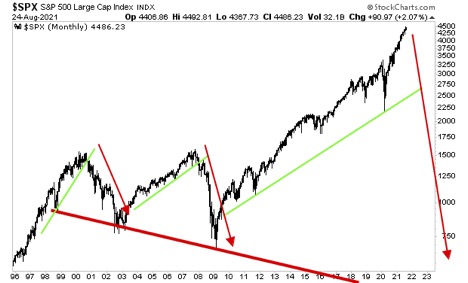
Let’s put this
spike in a larger context.
From August of
last year (2020) until March of this year (2021), the yield on the 10-Year
Treasury spiked rose rapidly as inflation entered the US financial system. I’ve
illustrated this spike with a green arrow in the chart below.
Then, in March of
2021, the Fed began to suggest that it was planning to tighten monetary policy.
This hurt inflation expectations as the financial system began to believe the
Fed would act quickly enough to stop inflation before it became a real problem.
As a result of this, the yield on the 10-year Treasury dropped from March of
2021 until July.
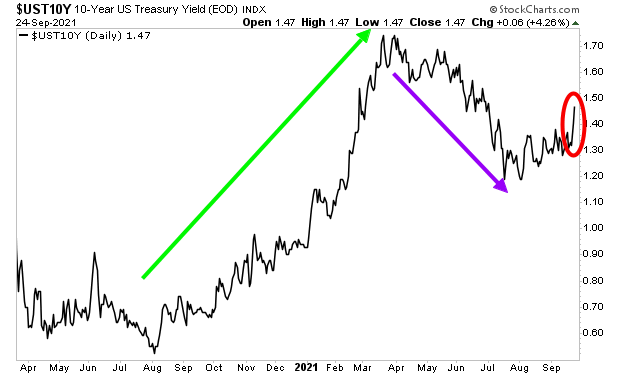
I’ve illustrated
this with a purple arrow in the chart below. This was, effectively, the bond
market giving the Fed the benefit of the doubt when it came to monetary policy.
In this context,
last week’s spike in the yield on the 10-year US Treasury represents the first
time since March that the bond market began to freak out about inflation again.
This is a MASSIVE
deal. It tells us that the market has called the Fed’s bluff: that the Fed won’t
act to stop inflation in time and that the economy and financial system are
heading towards a crisis in the near future.
If the Fed acts
now, by tightening monetary policy aggressively, it will crash stocks. After
all, the primary driver of this insane stock market bubble has been the Fed keeping
rates at zero and pumping $120 billion per month into the financial system.
And if the Fed DOESN’T
act now, inflation will rage, leading to a stag-flationary collapse in the economy…
and stocks will still crash as inflation destroys profits in the
corporate sector.
Just like in the mid-1970s, when stocks dropped 50% as inflation crippled the economy.
Put simply: a
crisis is coming no matter what the Fed does.
The big question is “WHEN”!?!?
To
figure this out, I rely on certain key signals that flash before every market
crash.
I
detail them, along with what they’re currently saying about the market today in
a Special Investment Report How to Predict a Crash.
On
Monday, the markets were melting down due to fears of contagion from
Evergrande, China’s second largest real estate company, going bankrupt.
Since
that time, the market has bounced hard… despite the fact nothing has changed
about Evergrande, or its $300 billion in debt, or the contagion issues that it
presents to the financial system (commodities, EU banks, Australian miners,
etc.).
So,
the big question for stocks is: was this a dead cat bounce or the start of a
new major rally?
Let’s
find out.
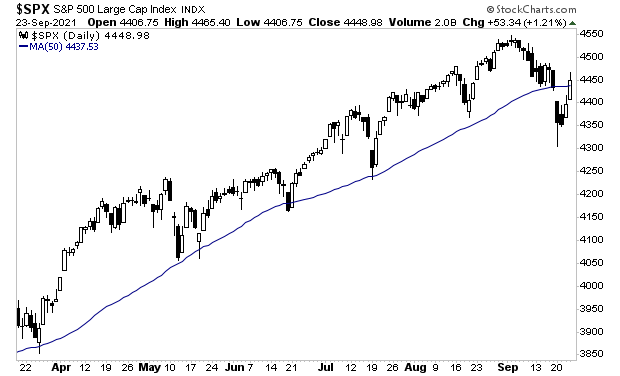
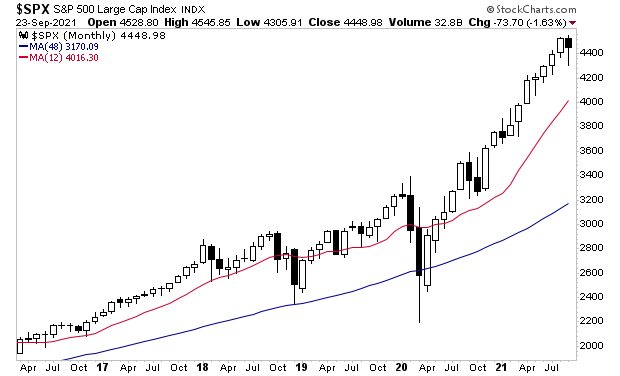
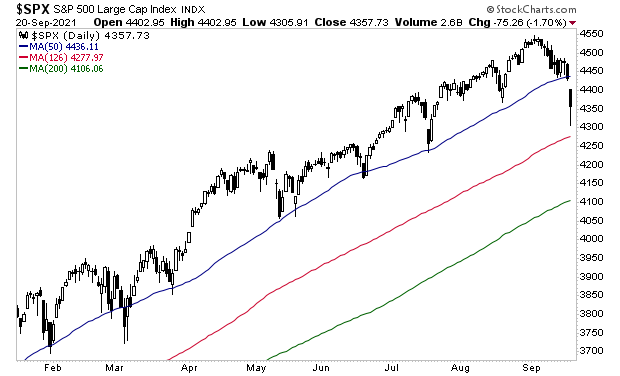
The S&P 500 is attempting to reclaim its 50-day moving average (DMA). As the below chart shows, this line has acted as major support throughout much of 2021. So, the fact we broke below it is significant. If the S&P 500 cannot reclaim this level and stay there… then stocks are in MAJOR trouble.
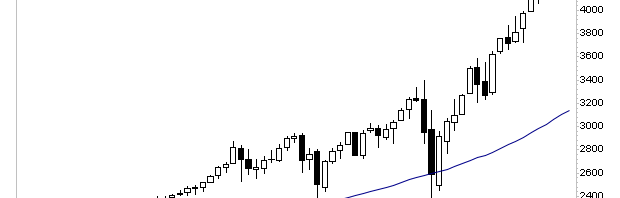
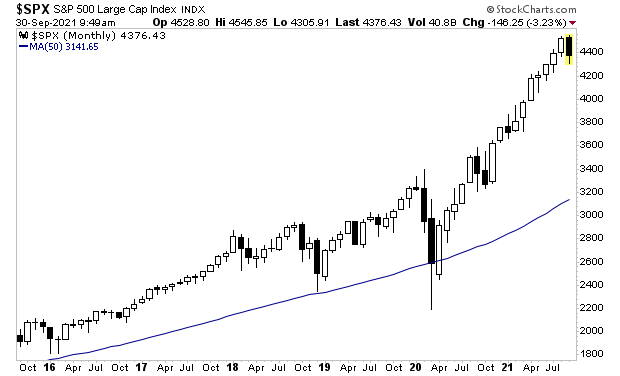
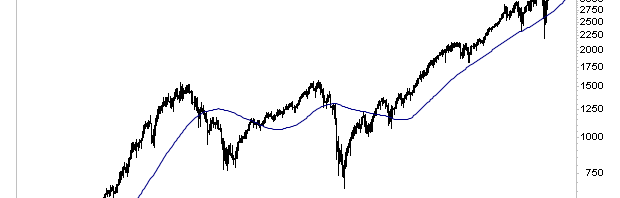
For anyone who understands risk management, the below chart has been a MAJOR concern for the last few months. On a monthly basis, the S&P 500 is EXTREMELY overstretched to the upside. At a minimum, you would expect a drop to the 12-month moving average (MMA) to occur sometime this year.
This would mean a 10% drop in stock prices.
Note in
the above chart that every drop to the 12-MMA started with a significant black
candle. We’ve got one week left in September, but it looks like we could be
getting our first black candle of the year.
However,
given that stocks are in their largest bubble of all time by some measures…
that leverage levels are obscene, and that we are seeing the kind of mania
associated with major tops… smart investors are asking…
“Is a Crisis about to hit?”
To
figure this out, I rely on certain key signals that flash before every market
crash.
I
detail them, along with what they’re currently saying about the market today in
a Special Investment Report How to Predict a Crash.
The
markets have rallied hard on news of a potential Evergrande debt payment.
In
case you’ve missed this story, Evergrande is a massive property developer in
China. The company is effectively insolvent, and with $300 billion worth of
debt many analysts were predicting this would lead to China’s “Lehman moment.”
We
had some fireworks on Monday, but the markets have since rallied hard on news
that Evergrande would make a payment on one of its Yuan-denominated
bonds.
That
payment is expected to be made today.
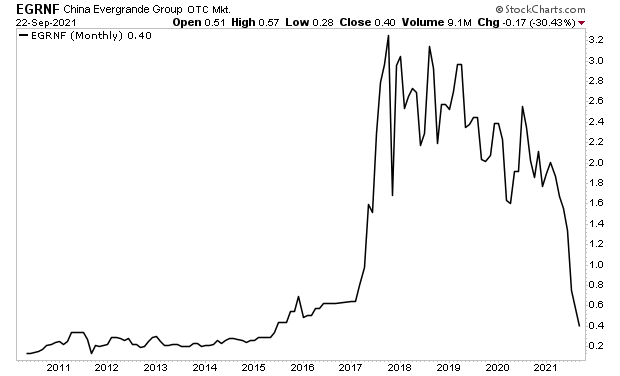
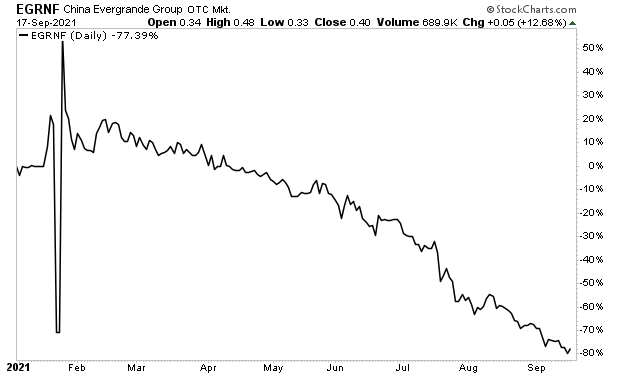
Regardless of what happens with this specific payment, the fact remains that Evergrande is effectively insolvent. The chart says it all.
Moreover, this company is not an isolated situation. China’s government has made it clear it wants the real estate sector to deleverage, which means many of the over-indebted property developers are at risk of similar issues. Real estate and construction account for 16% of China’s ~$15 trillion economy… so this is not a small problem.
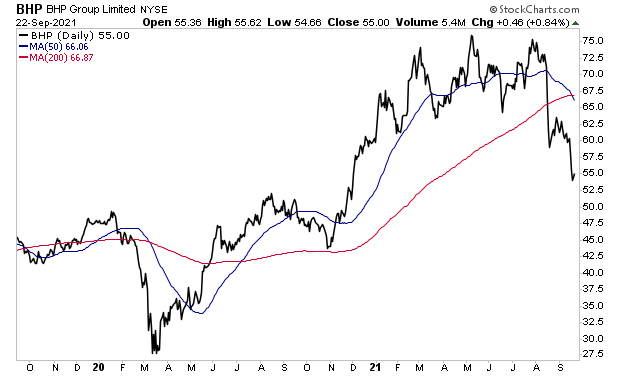
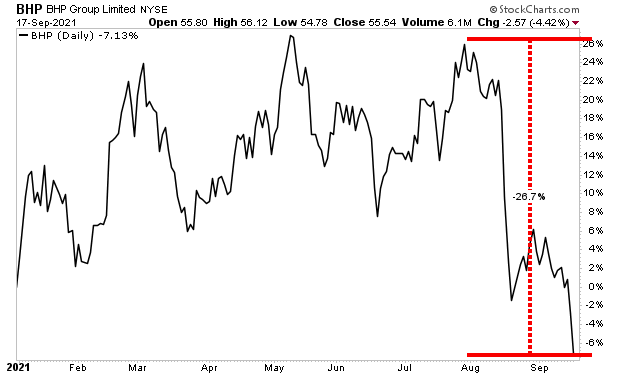
Keep an eye on BHP Group limited (BHP). As one of the largest
Australian mining companies responsible for supplying China’s construction/real
estate sectors, it’s a decent litmus test for whether or not this issue
is really resolved or not.
As I write this, BHP is staging a VERY small bounce. The chart is profoundly ugly.
At the end of the day, whether Evergrande pays its bond or not
today is just one paragraph in the book of bad debts that are floating around
the financial system. The fact the Fed has spent over $4 trillion propping
things up since 2020 doesn’t mean this whole mess won’t come crashing down.
In chart terms, it’s only a matter of time before this happens.
The multi-trillion dollar question is…
WHEN?!?!
To
figure this out, I rely on certain key signals that flash before every market
crash.
I
detail them, along with what they’re currently saying about the market today in
a Special Investment Report How to Predict a Crash.
The Fed is expected
to announce its tapering schedule for its current $120 billion per month Quantitative
Easing (QE) program. The Fed has been hinting at its plan for months, via both
Fed officials and media proxies.
The current proposal
appears to be a $10-$15 billion per month tapering program, starting in
November 2021. This is a very rapid scheme that would bring its QE program
to a complete end by mid-2022.
By way of comparison,
during the Fed’s last QE taper (that pertaining to QE 3 in 2017), the Fed reduced
the pace of its then-QE program by $10 billion every THREE months, with the pace
stopping at $30 billion per month.
Again, the current
proposed tightening is much faster and aggressive than the last.
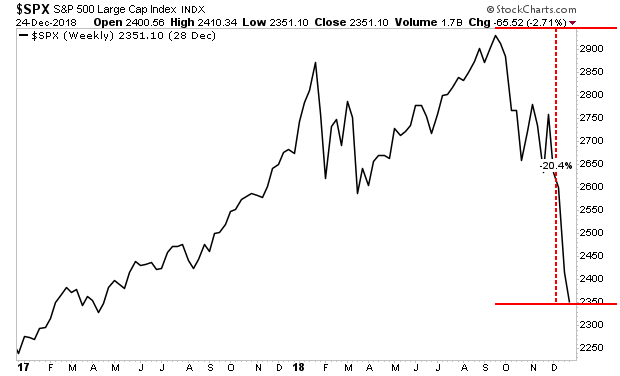
The big question
is how the markets digest this. The last time the Fed attempted to taper a
major QE program, it ultimately blew up the corporate debt markets resulting in
stocks collapsing 20% in a matter of weeks.
Will the Fed blow
things up again?
It’s quite
possible, particularly when you consider that stocks are currently in their
largest bubble in history by some measures… financial leverage is
extraordinarily high… and we are seeing the types of mania associated with
major market tops.
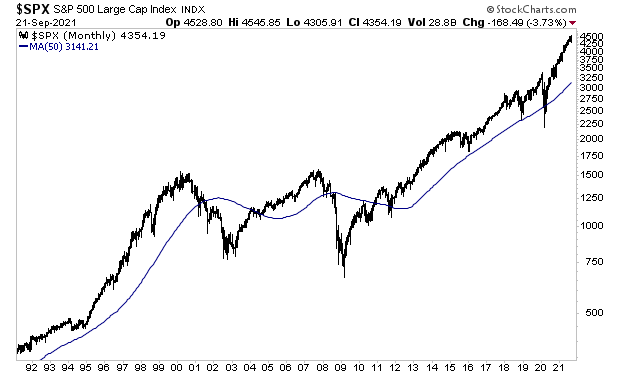
At the end of the
day, the stock market is EXTREMELY overstretched above its 50 -month moving average.
The only time it’s been more stretched was before the 1987 Crash and during the
Tech Bubble.
At some point we
are revisiting that blue line. The market always does.
By the way, the
50-MMA is currently at 3,141 while the S&P 500 is at 4354.
The big question
is WHEN will this happen?
To
figure this out, I rely on certain key signals that flash before every market
crash.
I
detail them, along with what they’re currently saying about the market today in
a Special Investment Report How to Predict a Crash.
Stocks got creamed
yesterday, but thanks to late day manipulation, they ended up well off the
bottom.
From a purely
technical perspective, the S&P 500 has broken below its 50-day moving
average (DMA) for the first time since March 2021. Stocks then bounced hard off
the 126-DMA (six month moving average).
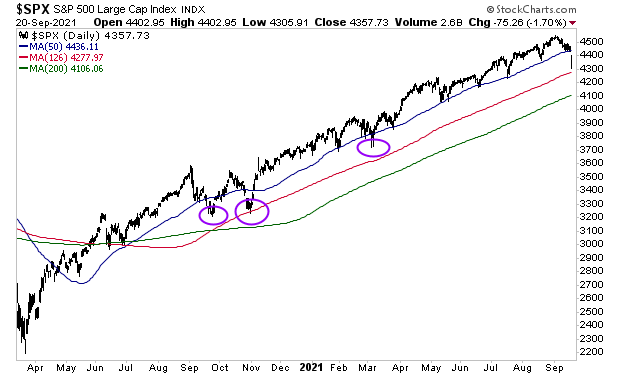
It will be crucial
to see how the markets act the next few days. We’ve had three significant
breaks below the 50-DMA since the March 2020 bottom: one in September ’20,
October ’20 and March ’21 (purple circles in the chart below). All of those
were resolved in a little over a week.
On the surface
things don’t look that bad. But “underneath the hood” things are terrible. None
of the S&P 500’s sectors are in uptrends.
Moreover, four out
of the five most heavily weighted stocks (AAPL, FB, AMZN, and GOOGL) have lost
their 50-DMAs and are losing their uptrends.
This is the kind
of environment in which actual crashes can happen.
To
figure this out, I rely on certain key signals that flash before every market
crash.
I
detail them, along with what they’re currently saying about the market today in
a Special Investment Report How to Predict a Crash.
The issue at hand
is China’s massive Evergrande property developer. The company is effectively
insolvent, with over $300 billion in bad loans. Many are calling this “China’s
Lehman Moment.”
The company’s
stock is down 80% Year to Date.
How serious is
this?
Serious.
Real estate
comprises nearly 8% of China’s economy. Construction is another ~8%. So, all in
all, you’re looking at 16% of the second largest economy in the world
experiencing the bankruptcy of one of its largest players. This has significant
implications for everything from commodities (use in construction) to finance
(the loans used to build the buildings and finance the mortgages for
consumers).
And in these types
of situations, there is never just one player at risk.
Contagion has
already begun. Hong Kong property developers and Chinese industrial producers
are getting hit. And if you think this will be confined to China you are
mistaken.
Australia supplies
much of the commodities China uses for its construction. It is not coincidence
that BHP Group (BHP) and other major Australian miners are nosediving, crashing
26% in the last few weeks.
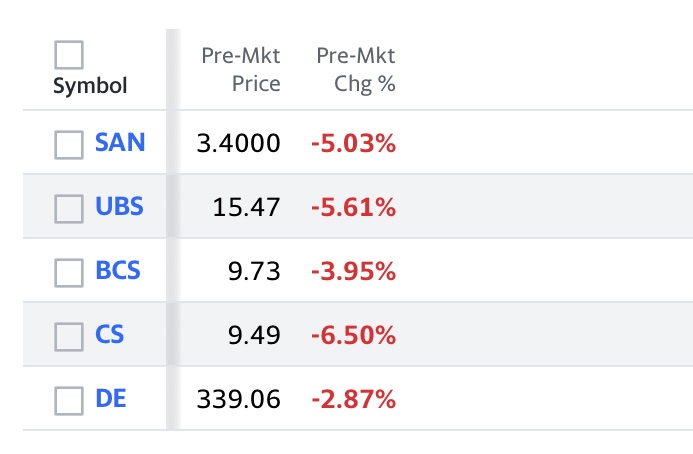
And then there’s
European banks, which have massive exposure to China. By the look of the
bloodbath this morning, things are spreading to there as well.
This is the
problem with an Everything Bubble: you never know where the black swan is going
to come from.
With the financial
system in the single largest bubble of all time, and leveraged to the hilt by
easy debt courtesy of Central Bank policies, even a single spark can set the
whole thing to blow.
As I warned a few
weeks ago, this whole mess will come crashing down one day. In market terms,
this is going to happen, it’s just a matter of time.
The question of
course is “when”?
To
figure that out, I rely on certain key signals that flash before every market
crash.
I
detail them, along with what they’re currently saying about the market today in
a Special Investment Report How to Predict a Crash.
That the Fed knows the
official inflation measure, the Consumer Price Index (CPI) is
practically useless for forecasting future inflation.
In a little-known paper published in 2001, the
Fed found that food inflation, NOT CPI
or PCE, is the best predictor of future inflation. Fed researchers wrote
the following:
We see that past inflation in food prices has
been a better forecaster of future inflation than has the popular core measure [CPI and PCE]…Comparing the past
year’s inflation in food prices to the prices of other components that comprise
the PCEPI (as in Table 1), we find that the food component still
ranks the best among them all…
Source: St Louis Fed (emphasis added).
I want you to focus on these two admissions:
The Fed has admitted that
its official inflation measures do not accurately predict future inflation.
The Fed admitted that
FOOD prices are a much better predictor of future inflation. In fact, food
prices were a better predictor of inflation than the Fed’s PCE, non-durables
goods, transportation services, housing, clothing, energy and more.
I mention all of this because today food
inflation is erupting higher.
We already noted that agricultural commodities
are ripping higher.
But the situation is even worse than I
imagined. The below quote is truly horrifying…
Adjusted for inflation and
annualized, [food]costs
are already higher now than for almost anytime in the past six decades, according
FAO data. Indeed, it’s now harder to afford food than it was during the 2011
protests in the Middle East that led to the overthrow of leaders in Tunisia,
Libya and Egypt, said Alastair Smith, senior teaching fellow in global
sustainable development at Warwick University in the U.K.
Source: Yahoo! Finance
Put simply, food inflation today than at almost any time in the
last 60 years. That would include the 1970s, when inflation went into the
double digits and the stock market crashed over 50% in a matter of months.
If you think we’re immune to something like this now, take a look
at the below chart. This is a massive bubble, looking for a pin. And by the
look of things, inflation is it!
On that note, we published a Special Investment
Report concerning FIVE secret investments you can use to make inflation pay
you as it rips through the financial system in the months ahead.
The report is titled Survive the
Inflationary Storm. And it explains in very simply terms how to make
inflation PAY YOU.
We made 100 copies available to the public.
Today is the last day this report is available
to the general public.
Yesterday I explained how the official
inflation statistic used by policymakers, the Consumer Price Index or CPI, is practically
useless.
I realize this is quite controversial.
After all, everyone on the planet from hedge fund managers to social security
administrators uses this data point as THE inflation measure.
Unfortunately for them, CPI is pretty
much useless. It doesn’t accurately measure inflation in any way shape or form.
Today, I’m going to let you in on a
little secret.
The Fed knows this.
In fact, the Fed has known this for
years… since 2001 to be exact.
Back in 2001, the Fed had several
researchers dive into the subject of inflation. Their goal was the analyze
whether the Fed’s preferred measures of inflation (the CPI and the Personal
Consumption Expenditures or PCE) are decent predictors of future inflation.
The Fed also investigated a whole slew of
other inflation measures for comparison purposes.
The results?
The Fed found that food inflation,
NOT CPI or PCE, is the best predictor of future inflation. Fed researchers wrote the following:
We see that past inflation in food prices has been a better forecaster of future inflation than has the popular core measure [CPI and PCE]…Comparing the past year’s inflation in food prices to the prices of other components that comprise the PCEPI (as in Table 1), we find that the food component still ranks the best among them all…
Source: St Louis Fed (emphasis added).
I want you to
focus on these two admissions:
The
Fed has admitted that its official
inflation measures do not accurately predict future inflation.
The
Fed admitted that FOOD prices are a much better predictor of future inflation.
In fact, food prices were a better predictor of inflation than the Fed’s PCE, non-durables
goods, transportation services, housing, clothing, energy and more.
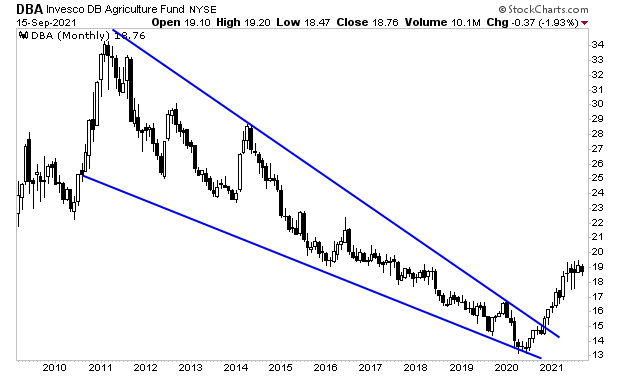
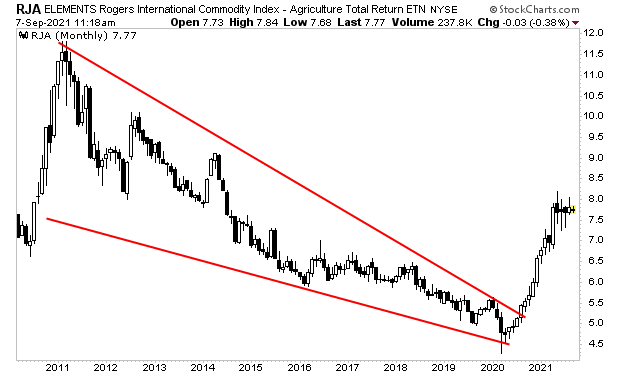
With that in mind,
take a look at what is happening with agricultural commodities, which are the
primary supplies for food.
You are looking at
the end of a 12-year bear market… and the beginning of a new bull market.
If you think this
is going to go well for stocks, you are mistaken. During
the last major bout of inflation in the 1970s, stocks initially ripped higher
for a few years before crashing ~50% erasing all their gains and then some.
Even worse, the stock market finished the decade having gained ZERO in 10
years.
On
that note, we just published a Special Investment Report concerning FIVE secret
investments you can use to make inflation pay you as
it rips through the financial system in the months ahead.
The
report is titled Survive the Inflationary Storm. And
it explains in very simply terms how to make inflation PAY YOU.
The government bean counters are working overtime to hide inflation.
Yesterday’s Consumer Price Index (CPI) number would be hilarious if it wasn’t so damaging to Americans. According to the Bureau of Labor Statistics (BLS), inflation rose only 0.3% month over month for the month of August and 5.3% year over year.
Anyone who lives in America knows this is total bunk
The BLS claims inflation in rents is up a mere 2.9% year over year. The very same day this came out, the Wall Street Journal reported that in the real-world rents are up 10.3%. Also, home prices are up 18% over the same period.
Put simply, unless you live in a cave, your cost of living for shelter (which the BLS uses to calculate total inflation) is up a whole lot more than 2.9%.
Let’s keep going, shall we?
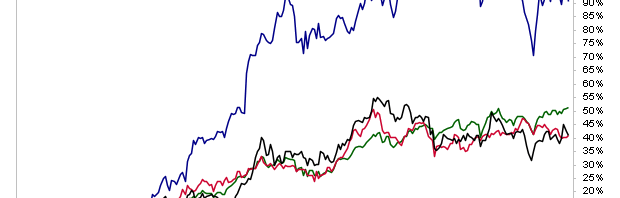
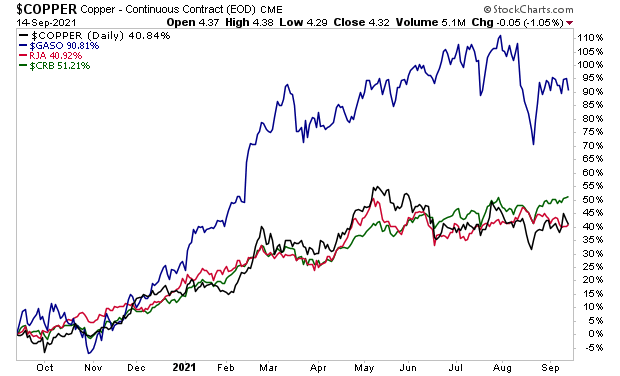
Over the last 12 months, the cost of every commodity is up 51%. Agricultural commodities are up 30%. So is copper. Gasoline prices have nearly doubled at 90%.
And yet, somehow the BLS claims inflation is just 5.3% year over year. I guess if you don’t drive a car, eat food, build anything, or use any commodities in any way, you’re probably fine.
The whole thing is ridiculous. And it begs the question… why is the BLS doing this?
I can’t claim to be psychic, so I have no idea what’s going on in these peoples’ minds. But I do know that a big reason to understate inflation is to mask the fact that real quality of life is in steep decline in the U.S.
This fact stares all of us in the face on a daily basis.
In the 1950s typically only one parent worked, and most Americans were able to afford their homes and live reasonably comfortable lives. In contrast, today typically both parents work, and most families have massive mortgages, student debt, credit card debt, auto loans, etc.
The whole system requires credit/ debt to function. Without it, most people cannot afford to live anything resembling a “middle class’ existence.
This whole mess will come crashing down one day. In market terms, this is going to happen, it’s just a matter of time.
The question of course is “when”?
To figure that out, I rely on certain key signals that flash before every market crash.
I detail them, along with what they’re currently saying about the market today in a Special Investment Report How to Predict a Crash.
The government bean counters are working overtime to hide
inflation.
Yesterday’s Consumer Price Index (CPI) number would be
hilarious if it wasn’t so damaging to Americans. According to the Bureau of
Labor Statistics (BLS), inflation rose only 0.3% month over month for the month
of August and 5.3% year over year.
Anyone who lives in America knows this is total bunk
The BLS claims inflation in rents is up a mere 2.9% year
over year. The very same day this came out, the Wall Street Journal
reported that in the real-world rents are up 10.3%. Also, home prices are
up 18% over the same period.
Put simply, unless you live in a cave, your cost of living
for shelter (which the BLS uses to calculate total inflation) is up a whole lot
more than 2.9%.
Let’s keep going, shall we?
Over the last 12 months, the cost of every commodity is up
51%. Agricultural commodities are up 30%. So is copper. Gasoline prices have
nearly doubled at 90%.
And yet, somehow the BLS claims inflation is just 5.3% year
over year. I guess if you don’t drive a car, eat food, build anything, or use
any commodities in any way, you’re probably fine.
The whole thing is ridiculous. And it begs the question… why
is the BLS doing this?
I can’t claim to be psychic, so I have no idea what’s going
on in these peoples’ minds. But I do know that a big reason to understate
inflation is to mask the fact that real quality of life is in steep
decline in the U.S.
This fact stares all of us in the face on a daily basis.
In the 1950s typically only one parent worked, and most
Americans were able to afford their homes and live reasonably comfortable
lives. In contrast, today typically both parents work, and most families have
massive mortgages, student debt, credit card debt, auto loans, etc.
The whole system requires credit/ debt to function. Without
it, most people cannot afford to live anything resembling a “middle class’
existence.
This whole mess will come crashing down one day. In market
terms, this is going to happen, it’s just a matter of time.
The question of
course is “when”?
To figure
that out, I rely on certain key signals that flash before every market crash.
I
detail them, along with what they’re currently saying about the market today in
a Special Investment Report How to Predict a Crash.
Yesterday, I explained why I believe we are due for a period of below average stock market returns.
By quick way of review:
Inflation is roaring higher. Official inflation measures put it at over 5%. Unofficial, more accurate measures have it clocking in at over 8%. And we are seeing corporations raise prices to deal with this.
Inflation is NOT good for stocks. During the last major bout of inflation in the 1970s, stocks initially ripped higher for a few years before crashing ~50% erasing all their gains and then some. Even worse, the stock market finished the decade having gained ZERO in 10 years.
The stock market is now extremely overstretched to the upside. On a monthly chart, the market is 40% above its 50-month moving average (MMA). The only time it has been more stretched above this line was right before the 1987 crash and during the Tech bubble.
So now the big question is… how do we profit from the inevitable collapse?
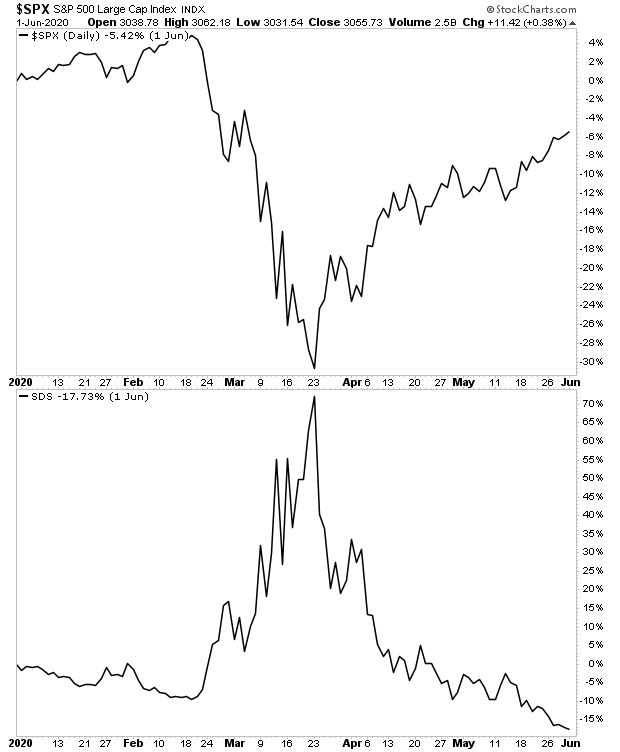
One method of doing this is the UltraShort S&P 500 ETF (SDS).
SDS was a leveraged play on the U.S. stock market collapsing.
You see, the SDS returns TWO TIMES the inverse of the S&P 500 ETF (SPY).
So, if the SPY falls 5%… the SDS returns 10%. Etc.
During market meltdowns, SDS is a great means of profiting from stocks collapsing. The below chart shows how it performed during the 2020 meltdown. Note SDS (bottom box) skyrocketed over 70% while the S&P 500 dropped some 30% in the month of March 2020.
However, I want to be clear here, DO NOT go out and buy this investment right now. SDS is a TRADE, not a long-term investment. Put another way, SDS ONLY works when the market is melting down. So, if you buy it at any other time, you’ll lose money.
So how do we know when the market is going to melt down?
To do that, I rely on certain key signals that flash before every market crash.
I detail them, along with what they’re currently saying about the market today in a Special Investment Report How to Predict a Crash.
One of the most
difficult things to learn about the stock market is the fact that it has little,
if anything, to do with the real economy.
This is a fact
borne out by both statistical studies and real-world analysis. And yet I would
argue that over 95% of investors don’t understand this.
For whatever
reason, most investors believe that the stock market is effectively a
derivative of economic growth.
The reality is
that the people thinking this haven’t really thought their arguments through to
their logical conclusions.
Indeed, if you
think I’m being naive with my views of the weak correlation between stocks and
the economy, consider that the mutual fund giant Vanguard performed a study
analyzing the correlation between stock market returns and various items
(dividend yield, stock market valuations, etc.), from 1926 to 2011.
They found that
the correlation between stock market returns and the direction or trend of GDP growth
was 0.05, or about 5%. Put another way, the trend of the economy only
explained roughly 1/20th of the stock market’s returns.
To put this into
perspective, it’s lower than the correlation between rain and stock
market returns. Yes, rain, as in whether or not it’s raining outside on
a given day.
If you still find
this hard to believe, let’s take a real-world example.
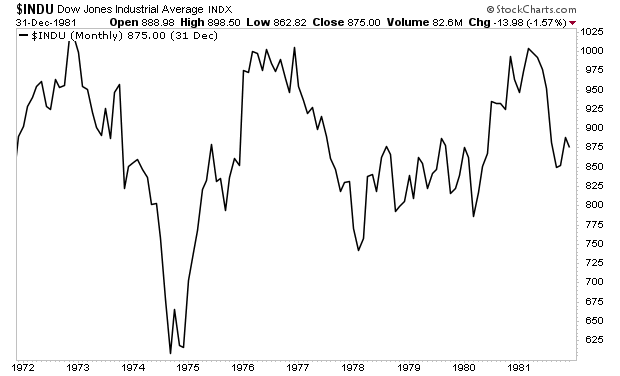
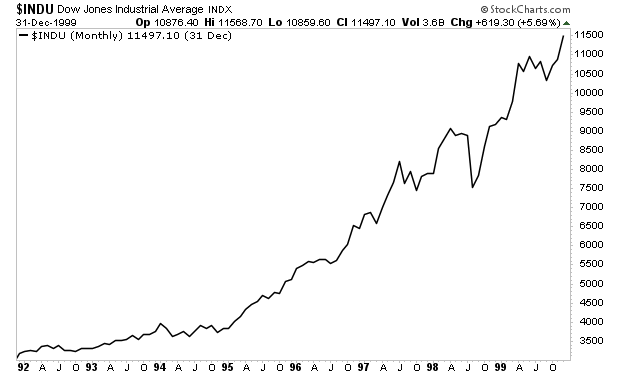
Between
1972 and 1982, the US economy nearly tripled in size from $1.2 trillion to $3.2
trillion. And yet, throughout that entire period the stock market traded
sideways for ZERO GAINS!
In
contrast, from 1982 to 2000, the US economy again nearly tripled in size from
$3.2 trillion to $10 trillion. But during this particular time, the stock
market exploded higher rising nearly 1,500%!
So, we
have two time periods in which the economy nearly tripled in size. During
one of them, the stock market went nowhere. During the other, the stock market
rose nearly 1,500%.
Again, stocks have little if any correlation to the economy. This is especially true during asset bubbles like the one we’re in today.
So how
do you determine when a bubble has burst and a crisis is about to begin?
To do
that, I rely on certain key signals that flash before every market crash.
I detail them, along with what they’re currently saying about the market today in a Special Investment Report How to Predict a Crash.
That the Fed is very likely now a political entity.
By quick way of review:
Fed Chair Jerome Powell’s term as Fed Chair ends this year.
The Biden administration has leaked in the media that it is considering giving Powell a second term.
Powell failed to present any meaningful information concerning the tightening of monetary policy at the Fed’s annual Jackson Hole meeting.
Based on inflation, GDP, and unemployment numbers, there are ZERO economic reasons for the Fed to NOT be already tightening monetary policy aggressively.
The above items suggest strongly that Powell has cut a deal with the Biden administration to gain reappointment.
That deal?
Keep the easy money flowing.
Again, there are no economic reasons for the Fed to continue its current monetary path. The fact that Jerome Powell won’t even commit to presenting a clear timeline for when the Fed will taper is truly negligent.
So where does this leave us?
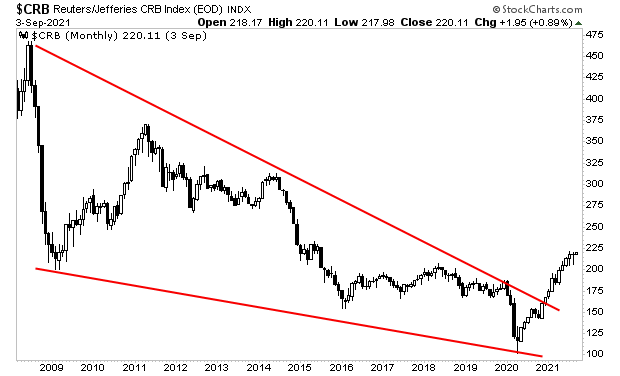
As I’ve outlined recently, there are clear signs that inflation has entered the financial system.
Commodities, which are inflationary hedges, have just broken out of a 13-year BEAR market.
Most important in this sector are agricultural commodities. The Fed’s own research has shown that the single best predictor of future inflation is food inflation. Well, take a look at what agricultural commodities are doing.
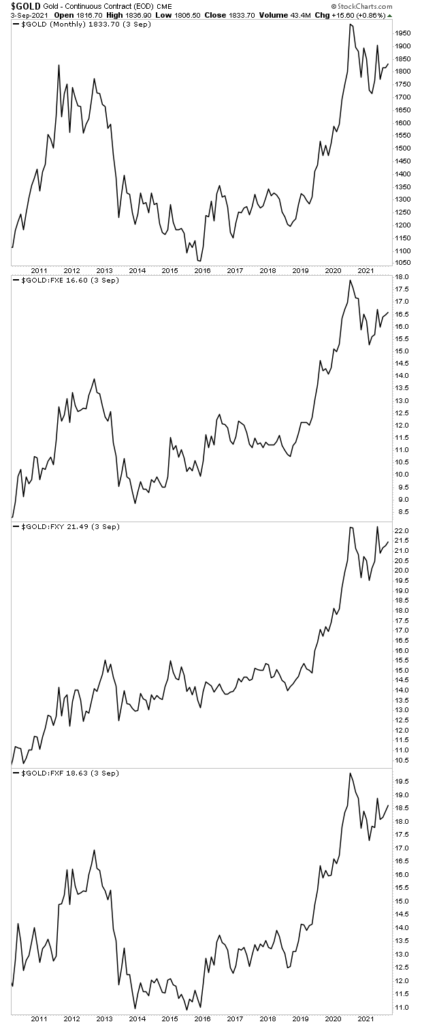
And then there’s gold, which recently rose to new all-time highs in every major currency.
These charts are SCREAMING inflation. And with the Fed refusing to tighten monetary policy for political reasons, this is likely just the beginning.
Smart investors are taking steps to profit from inflation today. I’ll outline some of my favorite ideas tomorrow.
On that note, we just published a Special Investment Report concerning FIVE secret investments you can use to make inflation pay you as it rips through the financial system in the months ahead.
The report is titled Survive the Inflationary Storm. And it explains in very simply terms how to make inflation PAY YOU.
Over the last two
days, I’ve outlined THE single most important development you need to see, in
order for the market to crash.
Think of them as
BIG warnings, or the FOUR Horsemen that precede a stock market apocalypse.
What are they?
When most heavily
weighted companies began to break down badly.
Technically, the
S&P 500 is made up of 500 companies. However, each of those 500 stocks
don’t receive the same weight from the index. Rather, certain stocks receive a
disproportionate weighting giving them a much larger impact on the market’s
price action.
Because of this,
in order to get a crash, you need the heaviest weighted stocks to break down
badly. Put another way, even if most of the 500 companies in the overall market
are in a downtrend, if the heaviest weighted stocks DON’T break down, it’s
pretty much impossible for the overall market to crash.
Yesterday we
reviewed the 1987 crash, noting that the vast majority of the 10 most heavily
weighted stocks had broken down in clear warnings that the market was in
serious trouble.
Let’s apply this
same methodology to today’s market. Today, the top 10 most heavily weighted
stocks in the S&P 500 are:
Company
Symbol
Weight
Apple Inc.
AAPL
6.26
Microsoft
Corporation
MSFT
5.96
Amazon.com Inc.
AMZN
3.82
Facebook Inc.
Class A
FB
2.38
Alphabet Inc.
Class A
GOOGL
2.27
Alphabet Inc.
Class C
GOOG
2.16
NVIDIA
Corporation
NVDA
1.47
Tesla Inc
TSLA
1.47
Berkshire
Hathaway Inc. Class B
BRK.B
1.41
JPMorgan Chase
& Co.
JPM
1.27
Total
28.48
Note that out of
an index of 500 companies, these 10 alone account for nearly 30% of the
market’s weight. So, in order for the market to crash, we need to see them
breakdown badly.
So, let’s take a
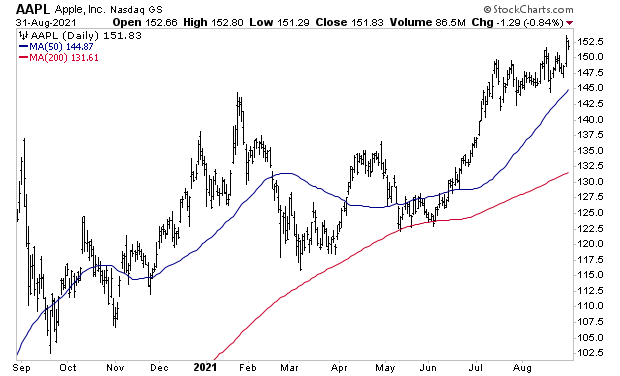
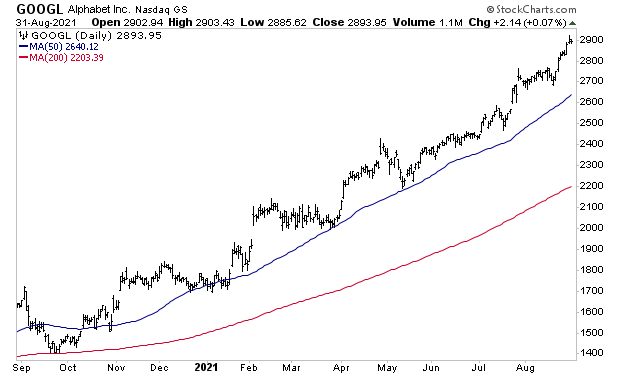
look at the top five today (September 2021).
Apple (AAPL): this
stock is clearly in an uptrend.
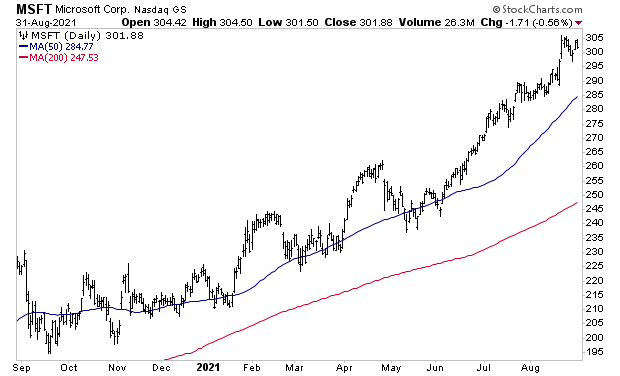
Microsoft (MSFT):
STRONG uptrend.
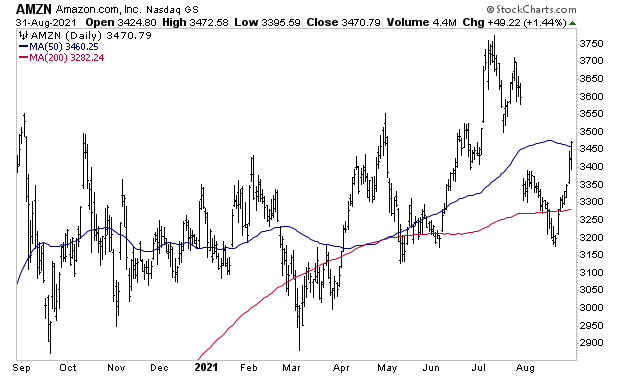
Amazon (AMZN): this is a weak chart. AMZN has been chopping back and forth for a year now. It’s not as bad as if the company had entered a definite downtrend, but it’s still pretty bad.
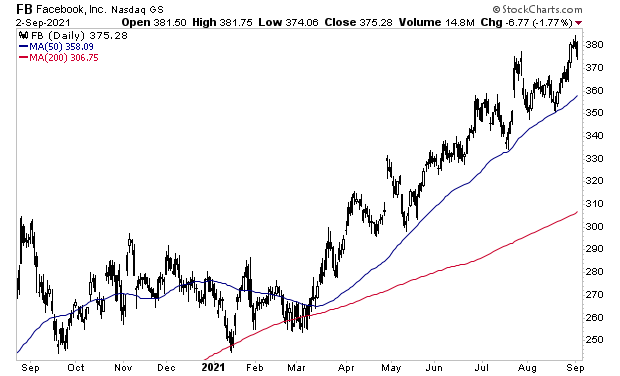
Facebook (FB): strong uptrend.
Alphabet (GOOGL):
incredible uptrend.
Put simply, out of
the top FIVE companies in the S&P 500, which account for nearly a quarter
of the market’s weight (22.8% to be exact), FOUR of them are in strong
uptrends.
While the market
is definitely in a bubble, until these companies break down, the odds of a
crash remain small. So, for now, it’s best to let this bubble run. Just keep an
eye on these companies. Once they start to break down, you’ll know it’s time to
start getting defensive.
In the meantime, if you’re looking for a guide on how to means to accurately predict crashes, what investments perform best during them, and how to take out “portfolio insurance” on your portfolio, we offer an Exclusive Investment Report, The Stock Market Crash Survival Guide outlining all those items and more.
Yesterday I outlined THE single most important development
you need to see, in order for the market to crash.
Think of them as BIG warnings, or the FOUR Horsemen that
precede a stock market apocalypse.
What are they?
When most heavily weighted companies began to break down
badly.
Technically, the S&P 500 is made up of 500 companies.
However, each of those 500 stocks don’t receive the same weight from the index.
Rather, certain stocks receive a disproportionate weighting giving them a much
larger impact on the market’s price action.
Because of this, in order to get a crash, you need the
heaviest weighted stocks to break down badly. Put another way, even if most of
the 500 companies in the overall market are in a downtrend, if the heaviest
weighted stocks DON’T break down, it’s pretty much impossible for the overall
market to crash.
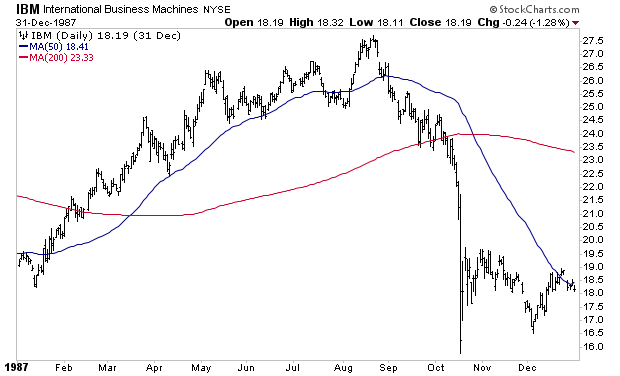
So today, let’s review the 1987-Crash: arguably the worst
single-day collapse in stock market history.
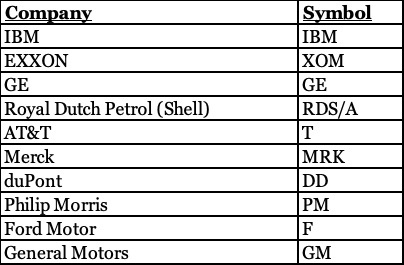
In 1987, the 10 largest companies by market weight were:
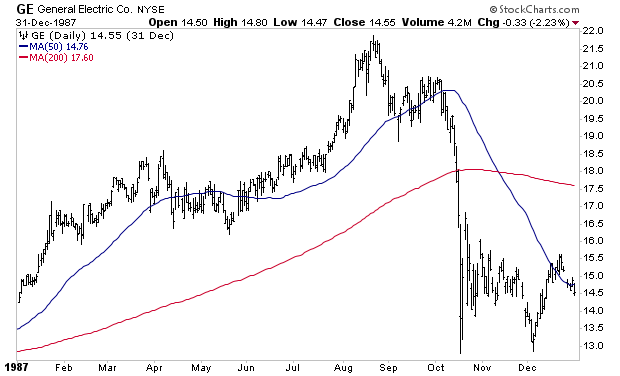
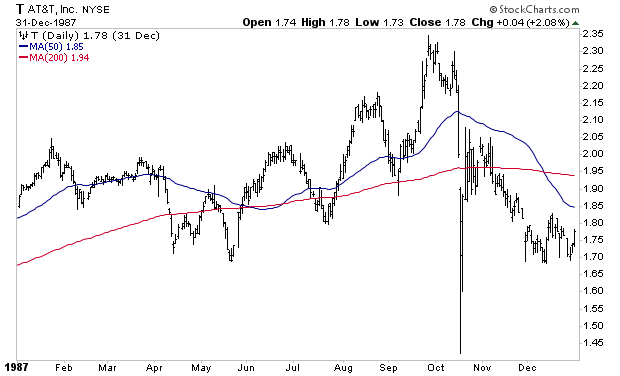
Of these, IBM, XOM, GE and T have charts that are easy to
find. So, let’s review them.
In 1987, IBM had already taken out both its 50-DMA and its 200-DMA before the crash hit. Put another way, the largest company on the index (the equivalent of the tech sector today) had already broken down VERY badly.
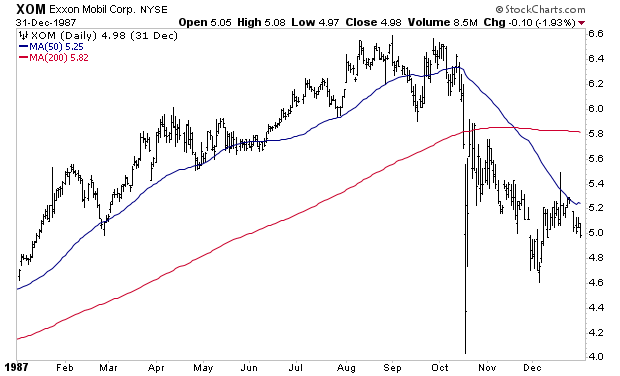
Exxon had yet to look as terrible, but it was clearly struggling, having traded sideways for months before finally breaking down.
General Electric looked awful, breaking its uptrend and
falling below its 50-DMA long before the Crash hit.
AT&T (T) was the only one that looked remotely good, as
it was still in something of an uptrend when the crash hit.
For space reasons, we’re only looking at four of the top 10
companies today. But if you were to look at all 10 charts, you’d quickly see
that the majority of them had entered downtrends, and were breaking down badly,
weeks before the Crash hit.
So does this impact the market today? Put another way, how
do we know when THIS will happen?
I’ll outline that in
tomorrow’s article. Until then…
In the meantime, if you’re looking for a guide on how to means to accurately predict crashes, what investments perform best during them, and how to take out “portfolio insurance” on your portfolio, we offer an Exclusive Investment Report, The Stock Market Crash Survival Guide outlining all those items and more.
Over the last few weeks, I’ve been outlining the clear evidence that stocks are in a bubble, arguably the largest stock market bubble of all time.
In truth, however, it’s not just a bubble in stocks, it’s a bubble in Treasuries, which the Fed has manipulated to absurd levels via over $2 trillion in Quantitative Easing (QE) during the last 18 months.
These bonds are the senior most asset in the current financial system. Their yields represent the “risk free” rate of return against which all risk assets (including stocks) are valued. So, when the Fed created this bubble in Treasuries, it was creating a bubble in Everything, which is why I call this the Everything Bubble.
Of course, this begs the question… when will it burst?
Put another way, when does THIS happen?
Predicting the actual week, let alone the day, of a market crash is all but impossible. However, there are certain key developments that MUST happen for the market to crash.
Think of them as BIG warnings, or the FOUR Horsemen that precede a stock market apocalypse.
What are they?
The most heavily weighted companies began to break down badly.
Technically, the S&P 500 is made up of 500 companies. However, each of those 500 companies don’t receive the same weight from the index. Rather, certain companies receive a disproportionate weight giving them a much larger impact on the market’s price action.
Because of this, in order to get a crash, you need the heaviest weighted stocks to break down badly. Even if most of the 500 companies in the overall market are in a downtrend, if the heaviest weighted stocks DON’T break down, it’s pretty much impossible for the overall market to crash.
I’ll outline precisely how this played out before the 1987 Crash (arguably the worst single-day collapse in stock market history) in tomorrow’s article.
In the meantime, if you’re looking for a guide on how to means to accurately predict crashes, what investments perform best during them, and how to take out “portfolio insurance” on your portfolio, we offer an Exclusive Investment Report, The Stock Market Crash Survival Guide outlining all those items and more.